

1 Introduction
Semiconductor nanoparticles have fascinated scientists during the past decades, resulting in both fundamental researches and technical applications due to their unique size- and shape-dependent optical and electronic properties [1,2]. The nanometer-sized binary chalcogenides semiconductors such as CdS, PbS, ZnS, CdSe, PbSe, etc., belonging to groups II–IV have attracted great attention due to their unique optical as well as mechanical properties as compared to their bulk counterparts on account of their size-quantization effects [3–7]. CdS is an important semiconductor among those with a direct band gap of 2.42 eV [8], and therefore invited much attention for its applications in logic circuits [9], photodevices [10–13] and photocatalysts [14–18]. CdS nanocrystals are believed to be a promising photocatalyst for removing organic waste from water due to their suitable band gap, high specific surface area, which effectively absorbs solar light, which further leads to more photon absorption on the surfaces [19]. A number of methods have been employed for the synthesis of CdS nanoparticles, viz., hydrothermal methods [20], direct reaction of metals with sulphur powders under high temperature [21], thermal decomposition of molecular precursors containing metal–sulphur (M–S) bonds [22,23], use of poisonous H2S as the S2− source at higher temperature [24], the chemical precipitation method involving the precipitation of metal ions with Na2S as the source of S2− ions [25,26] and γ-irradiation [27,28]. However, several problems related to the stability of nanoparticles such as control of the crystal growth, aggregation of the particles and heterogeneity resulting in broadening of the particle sizes distributions [29–31] have been reported with these methods. In order to meet the exponentially growing technological demand for nanomaterials, there is a need for developing a new cost-effective and eco-friendly approach for the synthesis of nanomaterials. Therefore, attention has been directed towards a biological route for the synthesis of nanomaterials [32], and a number of metal/semiconductor nanoparticles have been reported using various plants and microorganisms [33,34]. There are few reports on the synthesis of inorganic nanoparticles using carbohydrates as capping agents [35,36] inviting the attention of the chemists toward the synthesis of inorganic metal sulphide nanoparticles using other biomolecules.
The effluent from the fabric industry has long been considered a serious environmental issue [37]. Most paper mills and fabric industries produce wastewater that contain toxic aromatic dyes that are difficult to degrade due to their relatively stable chemical structures [38]. The dyes are used in industry for a range of purposes including frequently used methylene blue (MB) for agriculture, textile, paper-making, cosmetic, and pharmaceutical purposes [39]. Among various physical, chemical and biological techniques for the treatment of wastewater, heterogeneous photo catalysis has been considered as a cost-effective alternative for water remediation [40]. Photocatalytic degradation has been shown to be one of the most promising processes for the wastewater treatment due to its advantages over the traditional techniques, such as quick oxidation, absence of formation of polycyclic products, oxidation of pollutants in the ppb range, etc. [41–44]. The primary mechanism of photodegradation is the generation of hydroxyl radicals obtained by the reaction of holes with surface hydroxyls or water, and their attachment to organic compounds [45]. The photocatalytic treatment of wastes containing dyes using TiO2 has also been widely reported in the literature, in contributions where other semiconductors had been used in nanoscale dimensions [46]. The main drawback of TiO2 photocatalysts arises from the rapid charge recombination of the electron−hole pairs, thereby suppressing the quantum efficiency, and the wide band gap (3.2 eV) of the material, which restricts light absorption to only ultraviolet region (wavelength < 390 nm) and thus limits the practical applications of TiO2-based photocatalysts for solar light harvesting. While the CdS nanoparticles are believed to be a promising photocatalyst for removing organic waste from water on account of their effective absorption of solar light, which is due to their high specific surface area and suitable band gap and leads to more intense photon absorption on the surfaces.
Herein a simple biomolecule-inspired chemical approach has been adopted for the synthesis of CdS nanoparticles by using glucose and maltose as capping agents in view of the fact that carbohydrates can easily be transformed and modified into simple products [45]. The synthesized CdS-G/M nanoparticles were characterized by XRD, SEM, TEM, and UV–visible spectroscopy. The photocatalytic properties of CdS-G/M nanoparticles were investigated through the degradation of MB as a model pollutant under visible-light irradiation. The anthelmintic activity of the synthesized CdS-G/M nanoparticles was also investigated.
2 Experimental
2.1 Materials
All chemicals were of analytical grade and were used without further purification. Cadmium chloride monohydrate (CdCl2.H2O), Sodium sulphide flakes (Na2S·xH2O) was obtained from Merck, Mumbai, India, while maltose monohydrate (C12H22O11.H2O) and d-glucose, anhydrous (C6H12O6) were purchased from Fisher Scientific, Mumbai, India.
2.2 Synthesis of cadmium sulphide nanoparticles
CdS-G/M nanoparticles were prepared by dissolving 8 g of cadmium chloride in 100 ml of deionized water at room temperature followed by the slow addition of 100 ml aqueous solution of 1 M maltose/glucose over a period of 30 min. The mixture was constantly stirred at 60 °C for 3–4 h. This was followed by the addition of 50 ml of an aqueous 1 M solution of sodium sulphide. The temperature of the resultant reaction mixture was maintained at 80 °C for 1 h. Upon addition of the sodium sulphide solution, a change in colour of the reaction mixture was noticed from a clear transparent solution to a yellow and ultimately to a dark orange colloidal solution of cadmium sulphide nanoparticles, which were isolated after centrifugation and dried for 24 h at room temperature (Scheme 1).

(Colour online). Schematised representation of the synthesis of CdS-G/M nanoparticles.
3 Characterization
The scanning electron micrographs (SEM) of cadmium sulphide CdS-G/M nanoparticles were recorded on a JEOL (JSM840) scanning electron microscope at a voltage of 15 kV for the study of the morphology of cadmium sulphide (CdS-G/M) nanoparticles. The atomic percentage of Cd and S elements of CdS-G/M nanoparticles was determined using a SEM device equipped with an Oxford Instruments INCAx-sight energy dispersive X-ray (EDAX) spectrometer. The average particle size, their distribution and morphology were examined using a Philips Morgagni 268-D transmission electron microscope, TEM, FEI (USA) at a voltage of 120 kV. The aqueous dispersion of the particles was drop cast onto the carbon-coated copper grid, and the grid was air dried at room temperature before being loaded into the transmission electron microscope. XRD diffractograms of cadmium sulphide CdS-G/CdS-M nanoparticles were recorded on a MiniFlexTM II benchtop XRD system (Rigaku Corporation, Tokyo, Japan) at 40 kV. The diffracted intensities were recorded from 2θ = 20 to 2θ = 80°. The crystallite sizes (D) of the CdS-G and CdS-M nanoparticles were calculated following the Debye–Scherrer formula:
| (1) |
| (2) |
3.1 Photocatalytic activity measurement of cadmium sulphide nanoparticles
The photocatalytic activity of cadmium sulphide CdS-G/M nanoparticles was measured against the MB dye under visible-light irradiation. In a typical process, 0.01 g of the photocatalyst powder was added in 1 L of MB solution with an initial concentration of 5 mg/L. The suspension of photocatalyst and MB was magnetically stirred in a photoreactor in the dark for 1 h to establish an adsorption/desorption equilibrium of the dye. The solution was then irradiated by a 300-W Xe lamp as the light source for a set irradiation time. The suspension was periodically withdrawn after various time intervals and centrifuged to separate the CdS-G/M nanoparticles for analysis. The filtrate was analysed by recording the variation of its absorption spectrum at a maximal wavelength λmax = 665. A blank test was also conducted for the MB aqueous solution without CdS-G/M nanoparticles under visible-light irradiation. The active species generated in the photocatalytic system were measured by trapping with tert-butyl alcohol (TBA: C4H10O) and disodium ethlyenediamine tetraacetic acid dehydrate (EDTA-2Na).
The percentage photodegradation of the photocatalyst can be defined as follows:
| (3) |
The kinetics of photodegradation of MB can be expressed as follows:
| (4) |
3.2 Fluorometric hydroxyl radical assay
The generation of hydroxyl radicals during the irradiation of CdS-G/M nanoparticles was analysed in situ by a fluorometric assay [47]. In this assay, non-fluorescent disodium terephthalate reacts with hydroxyl radicals to form 2-hydroxylterphthalate, which forms a highly fluorescent anion in the presence of sodium hydroxide; this reaction is monitored by fluorescence emission spectroscopy at 425 nm using a fixed excitation wavelength of 310 nm. In this assay, 1 mL of the solution of CdS-G/M nanoparticles was mixed with 1 mL of sodium terephthalate (1 M), and the mixture was irradiated with visible light. The resultant mixture was withdrawn at regular intervals of time from this reaction mixture treated with 1 mL of a NaOH solution (1 M), and the 2-hydroxylterphthalate anion formed was monitored by fluorescence analysis.
3.3 Anthelmintic activity
To analyse the anthelmintic activity of CdS-M and CdS-G, two different concentrations were used against earthworms by applying a standard protocol [48]. Phreretima posthumahas, an Indian earthworm, has anatomically and physiologically close resemblances with the most destructive human parasites, known as helminthes and, therefore, P. posthuma has been extensively used as a model organism for in vitro anthelmintic screenings. Earthworms of 3–5 cm in length and 0.1–0.2 cm in diameter were collected from moist soil, and normal saline washing was done to remove adhering debris and mud. The test compounds and the standard drugs were dissolved in a minimum volume of DMSO, and a final volume of the working solution was increased to 10 mL with a normal saline solution to get a final concentration of 0.50% w/v and 0.20% w/v, respectively. The group of three earthworms of nearly equal size was taken separately for each concentration and released into different petri dishes containing test compounds, standard drug solution, and normal saline (control) at room temperature. Paralysis or mortality of individual earthworms was recorded as a function of time, and the mean paralysis time and mortality time of earthworms were calculated (Table 1) using a standard drug and the different test compounds as mean ± S.E.M. of three worms in each group.
Anthelmintic activity of CdS nanoparticles (CdS-G and CdS-M).
| Compounds | Mean paralysis time (min) Conc. in % w/v | Mean death time (min) Conc. in % w/v | ||
| 0.20 | 0.50 | 0.20 | 0.50 | |
| CdS-M | 2.2 ± 0.3 | 1.9 ± 0.2 | 4.0 ± 0.2 | 3.5 ± 0.3 |
| CdS-G | 2.5 ± 0.4 | 2.1 ± 0.3 | 4.4 ± 0.2 | 4.2 ± 0.1 |
| Albendazole | 1.6 ± 0.1 | 1.1 ± 0.3 | 3.5 ± 0.1 | 2.90 ± 0.2 |
| Control | - | - | - | - |
4 Results and discussion
4.1 Structural characterization and morphological analysis
The investigations regarding the phase and structure of the synthesized CdS nanoparticles were carried out by XRD analysis. The XRD patterns of CdS-G and CdS-M are displayed in Fig. 1a. The spectra of the CdS-G/M nanoparticles were found to be considerably broad due to very small size of the crystallites [49]. The peaks in the XRD spectra have been assigned by JCPDS 10-454. The XRD spectra exhibit three relatively strong peaks at 2θ 26.6°, 44.10° and 51.91°, corresponding to the (111), (220), and (311) reflection planes, respectively consistent with the cubic (zinc blende) phase of CdS. The average crystallite size D of the CdS-G/M nanoparticles was calculated from the main peak using Scherrer's equation,

(Colour online). (a) XRD diffractograms of the synthesized CdS-G/M nanoparticles; (b) FT-IR spectra of synthesized CdS-G/M nanoparticles.
The FTIR spectra of CdS nanoparticles (Fig. 1b) exhibit a strong intensity band at 615 and 625 cm−1 for CdS-G and CdS-M, respectively, which may reasonably be assigned to a Cd–S stretching vibration [50]. A broad band in the region from 3356 to 3545 cm−1 may be due to the O–H stretching vibration of adsorbed glucose and water [51]. A strong intensity band at 1625 cm−1 may be attributed to the O–H bending mode of the vibration of adsorbed water. However, the bands at 2735 and 2936 cm−1 may be due to the C–H stretching mode of carbohydrate moieties [52,53]. A considerably strong band in 1354–1405 cm−1 region may be due to the υso stretching vibration of the sulphate group and a weak band in 1035–1094 cm−1 region may reasonably be assigned to the vibration of the SO42−group [54].
The TEM micrographs of the CdS-G/M nanoparticles were recorded to determine the shape, size and uniformity of the nanoparticles. The TEM images of both CdS-G/M nanoparticles showed the spherical shape of the nanoparticles. However, the TEM image of CdS-G nanoparticles showed slightly agglomerated spherical morphology (Fig. 2a,b). The average particle size determined using Image J software was found to be within the range from 5 to 6 nm, i.e., 5.01 ± 0.21 nm for CdS-G and 4.97 ± 0.18 nm for CdS-M. The relatively small size of the CdS-M nanoparticles as compared to the CdS-G nanoparticles may possibly be attributed to the high capping ability of maltose. The surface morphological patterns of CdS-G/M nanoparticles have been analysed by scanning electron microscopy (SEM), and displayed a huddle image for CdS-G nanoparticles and a cluster image for CdS-M nanoparticles (Fig. 2c, d). The morphological difference in CdS-G/M nanoparticles may be due to different carbohydrate moieties used for their synthesis. The compositions of CdS-G/M nanoparticles have been examined by EDAX spectra showing elements approximately as per the expected stoichiometry (Fig. 2e, f).
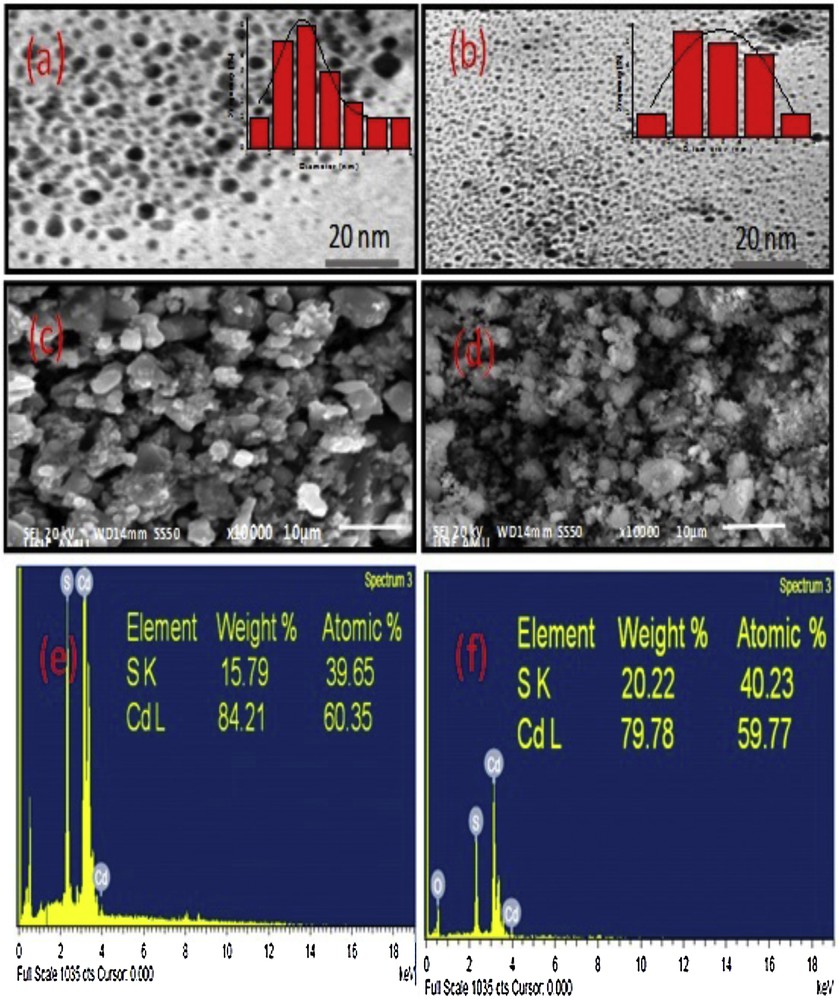
(Colour online). TEM micrographs of (a) CdS-G, (b) CdS-M nanoparticles, SEM micrographs of (c) CdS-G, (d) CdS-M nanoparticles, EDAX micrographs of (e) CdS-G and (f) CdS-M nanoparticles.
4.2 Optical and thermal characterization
The UV–visible spectra of CdS-G/M nanoparticles (Fig. 3a) show absorption bands in the region from 330 to 450 nm, which was found to be considerably blue-shifted relative to the absorption peak of bulk CdS, indicating a quantum confinement effect [55]. The optical band gap of CdS-G/M nanoparticles were evaluated using Tauc relation αhν = A (hν–Eg)n (where α is the absorption coefficient, A is a constant and n is an index number having the values 1/2, 3/2, 2 and 3 depending upon the nature of electronic transition) by an extrapolation of the linear region of the plot (αh□)2 on the y-axis versus photon energy (hν) on the x-axis (Fig. 3b), which was found to be 2.62 and 2.65 eV for CdS-G and CdS-M, respectively. The radii of CdS-G/M nanoparticles were also estimated by using the Brus equation [56]:
| (5) |

(Colour online). (a) Absorbance spectra of CdS-G/M nanoparticles, (b) Tauc plots depicting the energy band gap of CdS-G/M nanoparticles, (c) photoluminescence emission spectra of CdS-G/M nanoparticles, and (d) TGA thermograph of CdS-G/M nanoparticles.
Particles size analysis by TEM, XRD and UV techniques, and quantum yield (QY) of the sample.
| Sample no. | TEM size (nm) | XRD (nm) | UV (nm) | QY (%) |
| CdS-M | 4.97 | 6.75 | 5.03 | 8.12 |
| CdS-G | 5.10 | 6.93 | 5.12 | 12.20 |
The photoluminescence behaviour of CdS nanoparticles could give information about the energies and dynamics of photogenerated charge carriers as well as on the nature of the emitting states [57]. Photoluminescence emission spectral analysis was applied to reveal the migration, transfer and recombination process of photogenerated electron–hole pairs in a semiconductor [58]. Generally, a weaker PL intensity suggests a lower electron–hole recombination rate and corresponds to higher photocatalytic activity [59]. The photoluminescence emission spectra of CdS-G and CdS-M nanoparticles recorded at room temperature with an excitation wavelength of 350 nm (Fig. 3c) revealed that the photoluminescence emission spectrum of CdS-G nanoparticles is similar to that of CdS-M nanoparticles having a strong band centred at 537 nm. However, there is a significant decrease in the PL intensity of CdS-M nanoparticles compared to that of CdS-G nanoparticles (Fig. 3c). The weak-intensity PL signal indicates that the CdS-M nanoparticles have a lower recombination rate of photogenerated electron–hole pairs under visible light and correspond to higher photocatalytic activity as compared to that of CdS-G nanoparticles. The synthesized CdS-G/M nanoparticles were used to estimate the quantum yield. Rhodamine 6G was used as a reference (Table 2). The QY of CdS-G and CdS-M nanoparticles were found to be 12.20% and 8.12%, respectively.
The thermal stability of CdS-G and CdS-M nanoparticles was investigated using a TGA technique under N2 atmosphere in the temperature range between 50 and 800 °C (Fig. 3d). The TGA curves of CdS-G and CdS-M nanoparticles showed a first thermal degradation step in the temperature range from 50 to 250 °C, showing a weight loss of 35% and 11%, respectively, which may be accounted for by the loss of physisorbed water molecules. The second degradation step occurs in the range from 270 to 500 °C, corresponding to 6% and 11% weight losses in CdS-G and CdS-M nanoparticles, respectively, which may be due to the loss of carbohydrate moieties. The comparison of the two thermograms indicated that CdS-G nanoparticles exhibit more weight loss in the first step, which may be attributed to more physisorbed water molecules in CdS-G as compared to the CdS-M nanoparticles. The total mass loss up to 800 °C has been estimated to be about 41% and 22% for the CdS-G and CdS-M nanoparticles, respectively. The comparison of TGA results suggests that CdS-M nanoparticles have higher thermal stability than CdS-G nanoparticles.
4.3 Anthelmintic activity of CdS nanoparticles (CdS-G and CdS-M)
The efficacy of the tested CdS-G/M nanoparticles as anthelmintic agents against earthworms at 0.20% w/v and 0.50% w/v is tabulated in Table 1 vs. that of a standard drug (for comparison), which clearly indicates that CdS-M has higher activity than CdS-G (Fig. 4), which may be due to the presence of different particle size distributions, as anthelmintic activities depend on the size: CdS-M (4.97 ± 1.8 nm) has a relatively smaller size than that of CdS-G (5.01 ± 2.17 nm). The CdS-M nanoparticles show early paralysis and short lethal times in comparison to CdS-G. The CdS-M nanoparticles show early paralysis and lethal time 2.2 ± 0.3 & 1.9 ± 0.2 (0.20% w/v) and 4.0 ± 0.2 & 3.5 ± 0.3 (0.50 w/v), respectively.
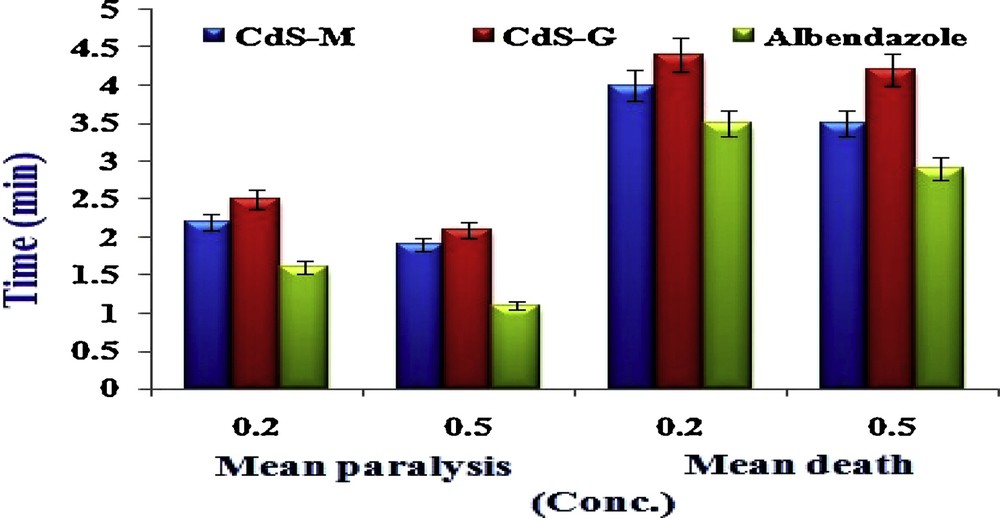
(Colour online). Anthelmintic activity of CdS nanoparticles (CdS-G and CdS-M).
4.4 Photocatalytic activity CdS nanoparticles (CdS-G and CdS-M).
Azo dyes are causing serious environmental pollution endangering public health due to their resistance to biodegradability and easy transformation into genotoxic and carcinogenic amines by different mechanisms [60]. MB, being a stable azo dye, has been used as a probe for photocatalytic degradation. MB has been widely chosen as a model pollutant to evaluate the photocatalytic activity of CdS nanoparticles [61,62]. In the present study, the photocatalytic activity of CdS-G and CdS-M nanoparticles against MB (λ = 665 nm) have been recorded by irradiation to visible light. A comparison of the photodegradation rates of MB in the presence and absence of CdS-G and CdS-M nanoparticles (Fig. 5a) revealed a negligible photodegradation of MB in the absence of CdS-G/M nanoparticles as a result of control analysis. However, the photodegradation of MB over CdS-G/M nanoparticles for a period of 60 min irradiation to visible light (Fig. 5b) results in 90.1 and 85.2% degradation of MB by CdS-M and CdS-G nanoparticles, respectively. This was further explained by the bar graph (Fig. 5c) for MB dye degradation, which revealed that most of the dye degrades during the first 30 min over the surface of the CdS-G/M nanoparticles, suggesting fast MB dye degradation. However, the MB solution becomes gradually colourless after standing for a long period of time. The kinetics of the MB degradation reaction is presented in Fig. 5d, which follows a pseudo-first-order kinetics in agreement with a general Langmuir–Hinshelwood mechanism:
| (6) |
| (7) |

(Colour online). (a) Absorbance spectrum of pure MB dye, (b) MB degradation as a function of irradiation time using different CdS-G, CdS-M nanoparticles and without catalyst, (c) degradation bar graph giving the photodegradation of MB by CdS-G/M nanoparticles as a function of time, and (d) pseudo-first-order linear plot of ln C0/C versus irradiation time for the degradation kinetics of MB using different photocatalysts.
The plot of ln (C0/C) versus time displays a straight line, whose slope is equal to the pseudo-first-order rate constant (0.03659 and 0.03133 min−1 for CdS-M and CdS-G, respectively).
4.4.1 Effect of photocatalytic dosage
A photocatalytic reaction is heterogeneous in nature and the rate of reaction depends upon the concentrations and active sites of the photocatalyst [63]. The effect of the dosage of the photocatalyst on the percent degradation of MB has been investigated, employing different concentration of CdS-G/M nanoparticles. It has been observed that there is a regular increase in MB degradation with the increase in concentration of CdS-M nanoparticles from 0.01–0.03 g/L. However, the photodegradation of MB decreases beyond the catalyst amount of 0.03 g/L (Fig. 6a). However, in case of CdS-G nanoparticles, the photocatalytic degradation of MB has been found to increase up to 0.02 g/L (Fig. 6b). The above experimental findings prove the optimum photocatalytic efficiency of CdS-G/M nanoparticles for the degradation of MB dye, which can be explained in terms of the optimum requirement of mass of the catalyst for the maximum adsorption of dye molecule and increased intensity of the nanoparticles under the area of illumination. However, beyond the optimum limits of loading of CdS-G/M nanoparticles, photocatalytic efficiency decreases, due to light scattering of catalyst nanoparticles [64].
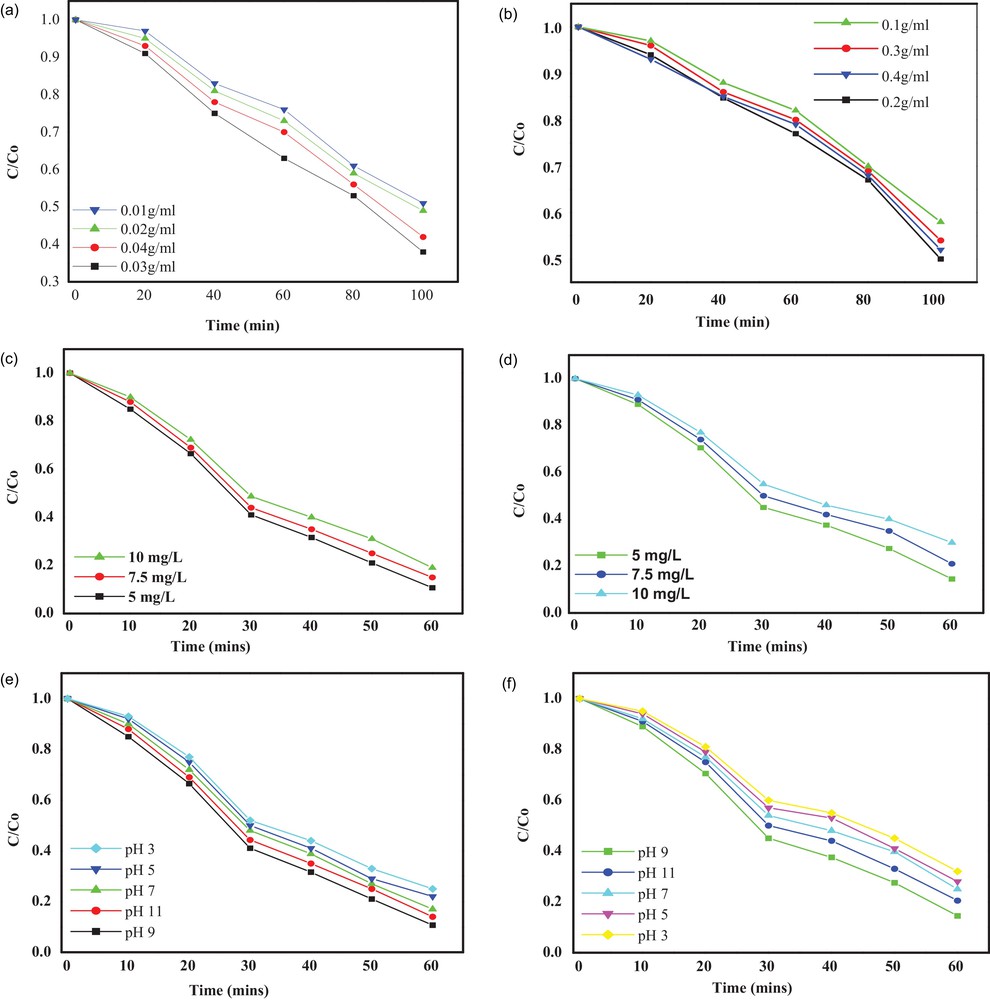
(Colour online). Effect of the photocatalyst dosage on the degradation of MB over the CdS nanoparticles (a) CdS-M, (b) CdS-G nanoparticles, effect of initial dye concentration on the photocatalytic degradation of MB over the CdS nanoparticles, (c) CdS-M (d) CdS-G, effect of the solution pH on the photocatalytic degradation of MB over the CdS nanoparticles, (e) CdS-M and (f) CdS-G.
4.4.2 Effect of dye concentration
Dye concentration is an important parameter that influences the rate of photocatalytic degradation of MB in wastewater [65]. The photocatalytic degradation of MB was investigated for different concentrations of dye solution varying from 5–10 mg/L in the presence of 0.03 g/L CdS-M and 0.02 g/L CdS-G nanoparticles, respectively, under visible-light irradiation (Fig. 6c,d). The photodegradation of different concentrations of the dye solution under the same experimental conditions follow pseudo-first-order kinetics. The pseudo-first-order rate constant for CdS-M/G nanoparticles at different MB concentrations, 5, 7.5 and 10, have been found to be 0.03659, 0.03150 and 0.02960 min−1 for CdS-M and 0.03133, 0.02922 and 0.02876 min−1 for CdS-G. The decrease in the rate constant of photodegradation by CdS-M and CdS-G upon an increase in the concentration of MB dye may be due to the adsorption of more and more molecules of dye on the surface of the CdS photocatalyst, as explained by the Beer–Lambert law, i.e. with the increase in dye concentration, the path length of photon entering the solution decreases, which results in lower photon adsorption on catalyst particles, leading to lower photodegradation activity [66]. In addition to the above, there may be a decrease in the generation of HO• radicals on the surface of CdS upon increase in the initial concentration of MB dye, due to a blockade of the active sites by MB molecules [67].
4.4.3 Effect of the pH of the solution
The pH is an important factor for the photocatalytic degradation of wastewater management, because industrial effluents may be complex in nature [68]. This can affect the photocatalytic efficiency of the catalyst for MB degradation; therefore, pH effects need to be examined. The effect of the solution pH on the photocatalytic degradation of MB was studied by varying the initial pH of the aqueous MB solution from 3 to 11 by adding aqueous H2SO4 and NaOH solutions, while keeping all other experimental conditions constant. It is well established that photodegradation depends on the adsorption of the dye on the surface of the photocatalyst [65]. The adsorption of dye is greatly influenced by the pH of the solution. The effect of the initial pH on MB degradation is shown in Fig. 6 (e, f). The pseudo-first-order rate constants for CdS-M nanoparticles at pHs 3, 5, 7, 9 and 11 were found to be 0.02959, 0.03017, 0.03125, 0.03659, 0.03412 min−1, while they were 0.0040, 0.02816, 0.02909, 0.03004. 0.03133 and 0.030105 min−1 for CdS-G nanoparticles. It has been noticed that an increase in pH from 3 increases the degradation rate of MB up to pH 9 and then decreases. The optimum pH for better degradation for MB on CdS-G/M is 9. However, in the acidic pH range, the removal efficiency is lower due to the dissolution of CdS nanoparticles.
4.4.4 Reusability and photostability of the CdS nanoparticles (CdS-G and CdS-M catalysts)
Recycling as well as maintaining high photocatalytic activity are serious issues for long-term use in practical application of the catalyst [68], which requires that two conditions be considered:
- • the stability of the catalyst to sustain its high activity over time;
- • the ease with which the catalyst could be recycled from the solution.
The reusability of CdS-G/M nanoparticles was tested for degradation of MB dye under identical conditions. The catalyst was separated after degradation and washed with large amounts of deionized water. The recovered catalyst was dried in an oven at 100 °C for 1 h and used for a second time. Fig. 7a shows MB degradation during three cycles. CdS-M/G nanoparticles exhibit remarkable photostability, as the degradation rates were found to be 100%, 98% and 96% for CdS-M nanoparticles and 100%, 96% and 89% for CdS-G nanoparticles (maximum degradation during the first, second and third cycles, respectively). Hence, the catalyst may be reused for continuous treatment of wastewater. It has been observed that there is no morphological change in the CdS-M catalyst before and after its use, as revealed by similar TEM spectra of CdS-M photocatalyst (Fig. 7b, c).
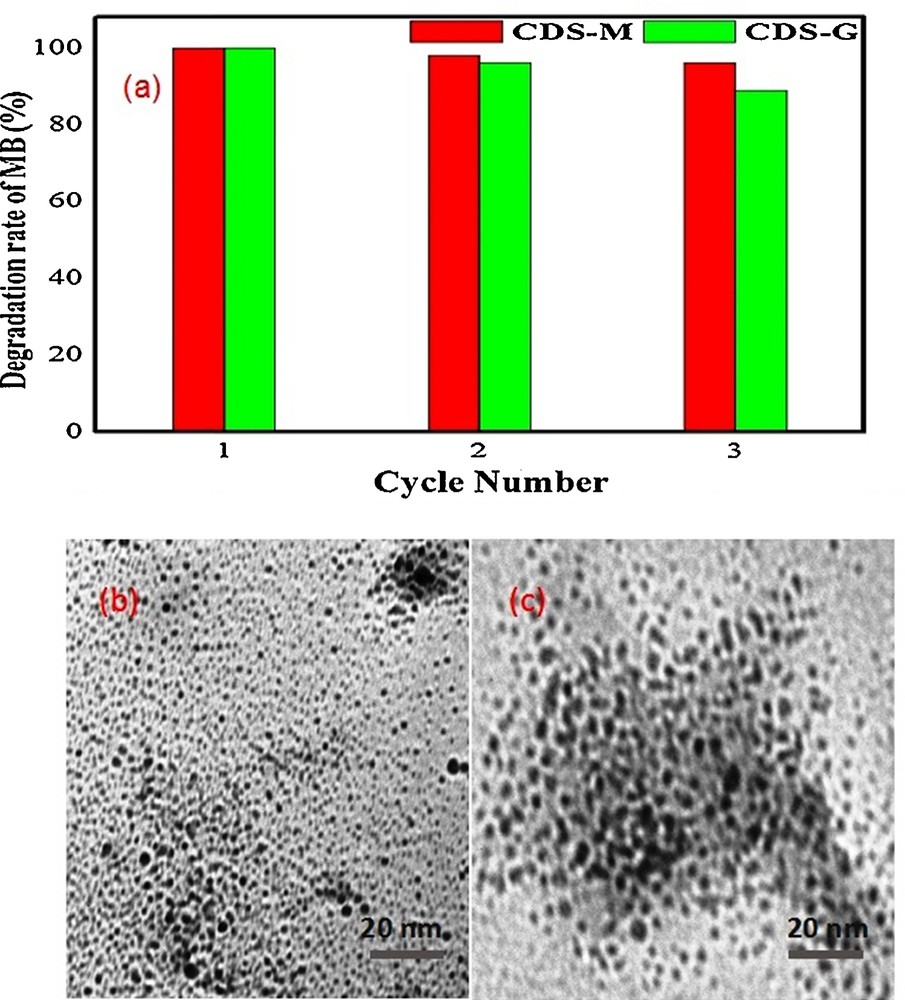
(Colour online). (a) Photocatalytic activity of the CdS-G/M nanoparticles for degradation of MB with three times recycling uses (b) TEM picture of CdS-M nanoparticles before photodegradation (c) TEM picture of CdS-M nanoparticles after reused for three cycles.
Furthermore, we determined the leaching of Cd2+ ions in the photocatalytic experiments by ICP analysis. The CdS-M catalyst had an average Cd2+ leaching rate of 60 μg/h, while the CdS-G particles had a high Cd2+ leaching rate of 199 μg/h for the degradation cycles 1 and 2, whereas In cycle 3, Cd2+ leaching from the CdS-M catalyst decreased too much, to a level lower by 8.3 μg/h as compared to CdS-G, with a leaching rate of 99.2 μg/h. Therefore, it may be concluded that CdS-M nanoparticles exhibit better photostability as compared to CdS-G nanoparticles.
4.4.5 Total organic carbon (TOC) analysis
The TOC values of irradiated solution were recorded in order to examine the effect of CdS-G/M nanoparticles on the mineralization of MB dye (Fig. 8). It was noticed that concentrations of TOC and MB decreased with time, suggesting the progressive mineralization of MB due to an effective decomposition of aromatic intermediates. The highest TOC removal efficiencies of 50 and 53% were observed concomitantly with 85.2% and 90.1% degradation rates of the MB solution with CdS-G and CdS-M nanoparticles, respectively, leaving behind some non-mineralized carbon.

(Colour online). Photocatalytic degradation and TOC of MB over CdS-G/M nanoparticles.
4.4.6 Possible photocatalytic mechanism
4.4.6.1 Active species responsible for MB degradation
In order to determine the predominant active species responsible for the degradation of MB dye molecules, comparative experiments of scavenger loading condition were carried out under optimized conditions over CdS-G/M nanoparticles. A large number of reactive species, including positive charge hole (h+), hydroxyl radical (HO•), superoxide anion radicals (O2•−) were produced during the photocatalyst degradation process. The mechanism of photodegradation of MB was investigated by adding various reactive species scavengers to the reaction system, and their effect on the overall photodegradation rate were analysed. Tert-Butyl alcohol (TBA; hydroxyl radicals scavenger) [69] and disodium salt of ethlyenediaminetetra-acetic acid (EDTA-2Na; photogenerated hole scavenger) [70] were added as the scavenger in the experiments. The photocatalytic degradation of MB by CdS-G/M (Fig. 9 a, b) has been found to be greatly suppressed by the addition of a scavenger (EDTA-2Na) for holes or (TBA) for radicals, suggesting that both the photogenerated hole and hydroxyl radicals are the main oxidative species of the CdS-G/M nanoparticles system. However, the rate of photocatalytic degradation of EDTA-2Na, which is higher than that of TBA, suggests that the photogenerated holes exhibit greater photocatalytic degradation as compared to the radicals.

(Colour online). Effect of different scavengers on the degradation of MB in the presence of CdS nanoparticles: (a) CdS-G and (b) CdS-M nanoparticles.
The formation of HO• radicals on the surface of CdS-G/M nanoparticles was further supported by PL spectral studies using terephthalic acid as a probe molecule [71]. A comparison of the PL spectra of CdS-G and CdS-M (Fig. 10) indicated that the CdS-M nanoparticles show higher intensity as compared to the CdS-G nanoparticles at a wavelength of 428 nm, implying a higher photocatalytic activity of CdS-M, possibly due to the higher formation rate of OH• radicals. Moreover, it has been noticed that there is a regular increase in intensity while increasing time intervals for CdS-M nanoparticles (Fig. 9), which may be explained in terms of fluorescent affect caused by interactions between terephthalic acid and the HO• radicals formed [72].
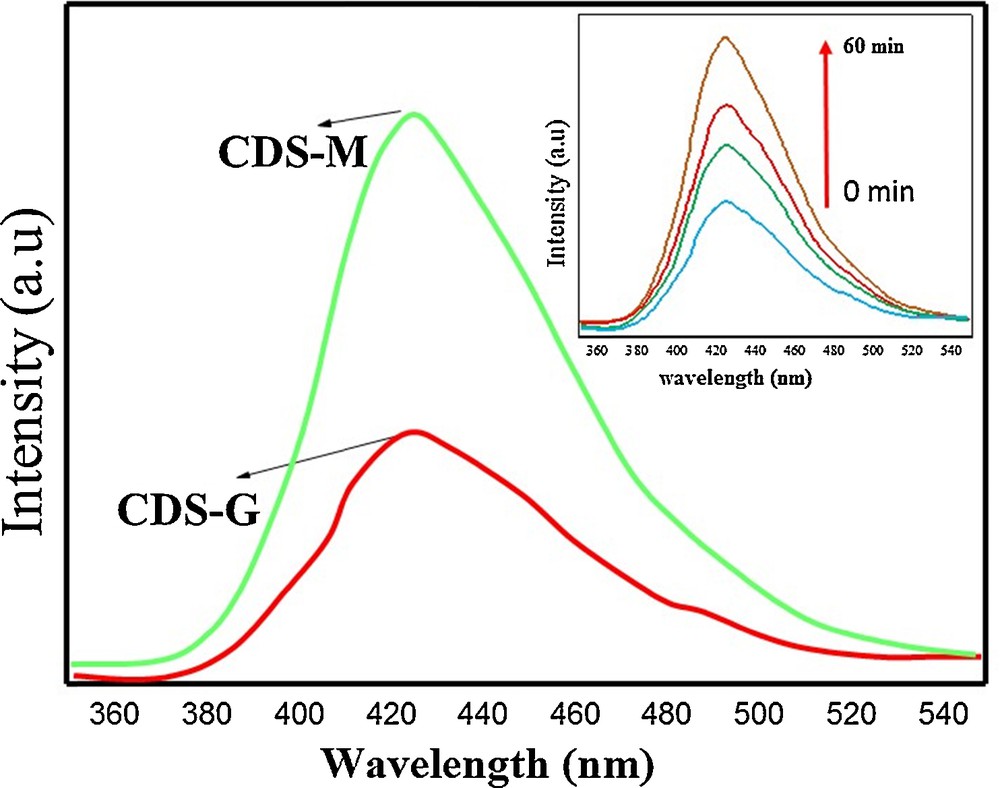
(Colour online). PL spectra of an aqueous solution of terephthalic acid under CdS-G/M nanoparticles for 60 min. (Inset: changes in the PL spectra as a function of irradiation time in the case of CdS-M nanoparticles).
4.4.7 Mechanism of degradation of MB dye
The mechanism involved in the photocatalytic degradation of CdS-G/M nanoparticles has been diagrammed in Fig. 11. The band gap of the synthesized CdS-G/M nanoparticles was found to be by 2.62 and 2.65 eV higher than the bulk CdS band gap of 2.42 eV. The photocatalytic reaction is initiated when a photoelectron is moved from the filled valence band of CdS-G/M nanoparticles to the empty conduction band upon visible-light irradiation energy, hν, of either equal to or greater than the band gap of CdS-G/M nanoparticles, leaving behind a hole (h+) in the valence band. The overall results in the formation of an electron (e−)–hole pair (see Eq. (8)) electron and hole acting as powerful oxidizing and reducing agents, respectively. [73].
| (8) |

(Colour online). Mechanism proposed for the photocatalytic degradation of MB over CdS-G/M nanoparticles.
The higher band gap of the nanoparticles leads to non-radiative recombination of electron and hole pairs [74], which enhances photocatalytic activity. The water molecules that are adsorbed on the surface of CdS nanoparticles trap the hole and get oxidized to give hydroxyl radicals. Subsequently, the electrons in the conduction band are taken up by oxygen, generating anionic superoxide radicals that take part in a further oxidation process, but also prevent electron–hole recombination, maintaining electron neutrality within the CdS-G/M nanoparticles. The superoxide further combine with proton to give (HOO•), which ultimately generate H2O2, which further dissociates into highly reactive hydroxyl radicals (HO•), as depicted below:
| h+ + H2O → HO• + H+ | (9) |
| O2 + e– → •O2– | (10) |
| •O2–+H+ → HOO• | (11) |
| 2HOO• → H2O2 |
| H2O2 → 2HO• | (12) |
| HO•/•O2–+MB → H2O + CO2+NO3–/SO42–+NH4+ | (13) |
These radicals degrade MB by interacting with the aromatic ring of the MB and opening the azo bond and hydroxylated ring to yield CO2, H2O, SO42−, NO3−, and NH4+ ions [75].
5 Conclusion
Cadmium sulphide nanoparticles have been successfully synthesized using glucose and maltose as capping agents. The crystallite sizes obtained from XRD and the particle sizes calculated from TEM analysis complement each other and range from 5 to 6 nm. The photocatalytic activity and kinetic studies of CdS-G and CdS-M nanoparticles evaluated by the photodegradation of MB under visible light revealed that CdS-M nanoparticles degrade MB dye faster than CdS-G nanoparticles, possibly due to the higher formation of HO• radicals. The optimum pH and catalyst amount of CdS-M for the degradation of MB were found to be 9 and 0.03 g/L, respectively. The anthelmintic activity of CdS-G and CdS-M nanoparticles has also been evaluated on the Phreretima posthuma earthworm.
Acknowledgements
The Chairman of the Department of Chemistry, Aligarh Muslim University, Aligarh, India, is acknowledged for providing the necessary research facilities. Prof. M. Shakir is thankful to KSU, Kingdom of Saudi Arabia, for VPP. The authors Mohd. Faraz and Mohd Shoeb Khan are thankful to the University Grants Commission (UGC). The facilities given to the department under SAP-DRS-II PURSE and FIST programs are highly acknowledged.