

1 Introduction
For several years, green technologies for natural and organic cosmetics are more and more approved by the community. Consumers have to become aware of the need to limit the impact of expansion controlled of chemistry on our environment with pollution, decreasing natural resources. Different alternative solutions have been found entitled under the name of green technologies. Nowadays, in green chemistry, a limitation of the use of organic and toxic solvents is required. As a consequence, the use of green technologies is more and more required [1].
Besides, the cosmetic field has a new trend: natural cosmetic products. Concentrated with natural ingredients, without or with a limited quantity of perfume, conservatives or dyes that are not detrimental to health, natural cosmetics guarantee the organic quality of products without chemical treatment and ecological criteria during their manufacturing. These arguments have been able to open a new cosmetic market with more vigilant consumers about the quality of cosmetic products and who want to make a good environmental choice. Consequently, new products made with vegetable resources are commercialized each year [1].
Supercritical Fluid Chromatography (SFC) is an environmentally-friendly alternative for analytical and purification applications. In SFC, CO2 is used as the mobile phase under precise conditions of (back) pressure and temperature. For pure CO2, the critical values are 74 bar and 31 °C. The main benefits of CO2 are its chemical and physical properties: CO2 is non-toxic, non-flammable, non-aggressive and its cost is lower compared to organic solvents commonly used in liquid chromatography. These properties respond to the green chemistry principles and demonstrate the interest of this method in analytical chemistry [2]. It is well known that SFC has become one of the favorite techniques for the collection of concentrated fractions of pollutants such as polycyclic aromatic hydrocarbons (PAHs), polychlorinated biphenyls (PCBs), pesticides, dioxins or aliphatic hydrocarbons from environmental samples; from biological samples such as blood or urine in order to collect drug residues; from food samples like seeds, plants or crops to concentrate fats and oils, fragrance and flavors [3]. The use of carbon dioxide is very popular because after the back pressure regulator, the CO2 is depressurized allowing the collection of concentrated fractions without additional energy to remove the solvent. Moreover, the non-polar character of CO2, comparable to n-hexane, increases the solubility and the analysis of hydrophobic compounds. Hence, SFC can replace Non Aqueous Reverse-Phase Liquid Chromatography (NARP-LC) for hydrophobic compounds such as triacylglycerols (TAG) [3]. The separation of isomers, non-polar compounds, lipids, polymers or thermolabile compounds is easier by SFC than by Liquid Chromatography (LC) or Gas Chromatography (GC). Consequently, for the analysis and characterization of vegetables oils or extracts of oleaginous plants, SFC coupled to Ultraviolet (UV) and Mass Spectrometry (MS) detections is an alternative to Reverse Phase Liquid Chromatography (RP-LC).
Vegetable oils are mainly composed of TAG (95–98%) and a complex mixture of minor compounds (2–5%) of a large chemical nature [4]. Among these minor compounds, tocopherols, phytosterols, quinones or carotenoids can be found [5]. T. Bamba et al. have developed an analytical system in SFC-MS enabling to analyze together different lipid families such as phospholipids, glycolipids, neutral lipids and sphingolipids [6]. T. Yarita et al. have determined tocopherols by SFC-UV from vegetable oils and studied their retention by modifying the density of the mobile phase and the effect of the addition of a modifier [7]. Choo et al. have used SFC-UV to isolate the minor compounds (carotenes, vitamins, sterols, and squalene) in a crude palm oil [8]. Concerning the families of fatty acids (FA), diacylglycerols (DAG) and TAG, are composed of various FA, such as oleic (O), linoleic (L), linolenic (Ln), stearic (S), palmitic (P), etc. differing in the acyl chain lengths, positions sn-1, 2 or 3 on the glycerol skeleton, in the number and positions of double bonds in the acyl chains. The separation of these compounds can partially be achieved by NARP-LC but this technique uses a lot of toxic and expensive organic solvents [9].
Moreover, the CO2 mobile phase has a low viscosity and a high diffusivity compared to the liquid mobile phases used in HPLC. Consequently, SFC can use higher flow rates, reducing the time of analysis or allowing the use of several columns in series to increase the efficiency, i.e. the theoretical plate number (N) [10, 11]. Instead of these advantages and because of the polarity of CO2, it is often necessary to add a small amount of an organic modifier such as methanol (MeOH), acetonitrile (ACN), ethanol (EtOH) or isopropanol (IPA) in order to improve the elution strength of the mobile phase and to mask some polar adsorption sites on the stationary phase, acting on retention and separation performances [10].
The retention behavior in SFC can be studied by the Linear Solvation Energy Relationships (LSER) using Abraham descriptors, which studies five interactions: dipole–dipole, hydrogen bond donor or acceptor of hydrogen bonding, charge transfer and molecular dispersion. So, the choice of the stationary phase is the most important criterion in SFC, with regards to one of the mobile phase compositions. Different kinds of interactions will be favored according to the chemistry of the stationary phase, giving different chromatographic profiles [10].
Finally, it is possible to use numerous detection methods in SFC. When pure CO2 is used as the mobile phase, a flame ionization detector (FID) or infrared (IR) detector is suitable. However, few compounds are eluted with pure CO2. Besides, when a modifier is used, it is possible to couple SFC with a UV detector placed between the outlet of the column and the back pressure regulator. An MS detector and Evaporative Light Scattering Detector (ELSD) are located after the back pressure regulator [10].
Nowadays, manufacturers provide a new generation of SFC devices, more effective and robust coupled to UV and MS detections. Some studies on the coupling of SFC and MS have been recently published. Jones et al. have studied the metabolic phenotyping of a biological matrix with Electrospray ionization (ESI) in SFC-ESI-MS in order to compare the chromatographic performance of SFC-MS and LC-MS. They concluded that these two techniques are complementary for the detection of complex samples [12]. When comparing Ultra High Performance Supercritical Fluid Chromatogrpahy (UHPSFC) and Ultra High Performance Liquid Chromatography (UHPLC), Guillarme et al. have shown a higher sensitivity for the former on pharmaceutical compounds [13]. However, few studies have been published about the SFC-MS hyphenation using an Atmospheric Pressure Chemical Ionization (APCI) as the ionization source. For example, Matsubara et al. have studied the separation and detection of epoxy carotenoids and carotenoids which are difficult to separate. They have performed this analysis by SFC and to increase the sensitivity, the MS detector has been chosen with an APCI as the ionization source [14]. François et al. have performed a separation of TAG from fish oil with a two dimensional chromatography: silver ion (SI)-SFC × RP-LC- APCI-MS [15].
In this work, we have developed an analytical strategy to determine the different molecular families present in a Kniphofia uvaria seeds extract with SFC coupled to UV and HRMS detections by the use of simple conditions.
2 Experimental
2.1 Stationary phases
Six Kinetex C18 core shell columns (150 × 4.6 mm, 2.6 μm) (Phenomenex, Le Pecq, France) and one Accucore C18 core shell column (150 × 4.6 mm, 2.6 μm) (ThermoScientific, Les Ulis, France) were connected in series for the separation of the total oil. A Viridis BEH-2EP column (250 × 4.6 mm, 5 μm) was used for anthraquinones separation (Waters, Guyancourt, France).
2.2 Chemicals
All solvents used were of HPLC grade and purchased from VWR (Darmstadt, Germany). For extraction, reagent grade for analytical conditions CO2 was supplied by Linde (Munich, Germany). For analytical chromatography coupled with UV detection, a CO2 bottle was supplied by Messer (Bad Soden, Germany) with a purity superior to 99%, whereas for chromatographic analysis coupled with MS detection, the CO2 bottle was supplied by Messer with a purity of 99.995%. Reference anthraquinone compounds (aloe emodin, physcion, chrysophanol, and rhein) were purchased from Extrasynthese (Genay, France). Stock solutions were prepared in MeOH:CH2Cl2 50:50 (v:v) at a concentration of 0.3 mg/mL.
2.3 Supercritical Fluid Extraction of plant seeds
K. uvaria seeds were collected by LVMH-Recherche. Seeds of K. uvaria (about 300 g) were ground with a Braun blender of 1 L. Seeds were extracted by Supercritical Fluid Extraction (SFE) with a Sepharex SFE-500 apparatus with pure CO2 at 290 bar and 60 °C. The extraction time was a function of the mass of CO2 passed in the extraction cell. When the CO2 mass reached 3 kg, the extraction was stopped. The oil was covered and dried in vacuum with some milliliters of ethanol in order to facilitate the drying. The oil extract was stored at 4 °C.
2.4 Analytical Supercritical Fluid Chromatography
Analytical SFC was carried out using Jasco equipment (Tokyo, Japan). The system was composed of a 2080-CO2 Plus pump and a 2080 HPLC pump for the modifier. Supercritical fluid and modifier were mixed in a Gilson 811 dynamic chamber (Villiers Le Bel, France) in order to obtain a homogenous mobile phase. A Rheodyne 7125 valve equipped with a 20 μL loop was used as the injector (Rheodyne, Cotati, CA). Columns were thermostatted with a Jetstream 2 Plus oven (Hewlett–Packard, Palo Alto, CA). The detector was a Gilson UV 151 detector equipped with a 690 bar pressure-resistant cell in stainless steel. After the detector, the outlet column pressure was controlled by using a Jasco BP-2080 Plus back pressure regulator (BPR) which was heated at 60 °C to avoid ice formation during CO2 depressurization. The separation on C18 columns was carried out with a CO2/methanol mobile phase under isocratic elution conditions at 1.5 mL min−1 or 1 mL min−1 depending of the number of chromatographic columns.
2.5 Supercritical Fluid Chromatography coupled with Mass Spectrometry (SFC-HRMS)
The SFC-HRMS system was composed of the CO2 pump from Jasco, an ultimate 3000 RSLC system (a binary pump, an autosampler and a thermostatted column compartment) (Dionex, Germering, Germany). The out of the back pressure regulator was connected to the MS detector by using a peek capillary with an internal diameter of 0.125 mm. MS detection was carried out using a maXis UHR-Q-TOF mass spectrometer (Bruker, Bremen, Germany) in positive and negative atmospheric pressure chemical ionization modes. For positive ionization mode, the corona voltage was set at 5000 nA and −5000 nA for negative mode. Nebulizer pressure was set up at 2 bar, the flow of dry gas was set at 3.5 L/min and heated at 200 °C and the APCI heater was set at 450 °C for both modes. Mass spectra were recorded in a range of 50–1400 m/z. Mass spectra were recorded in a range of 50–1400 m/z. Chemical formulas were generated using the Smart Formula algorithm from Data Analysis 4.0 software (Bruker). Compounds were identified with the Chemspider database.
2.6 Data analysis with Derringer's desirability function
The desirability function measures the quality of a separation based on the combination of several responses that provides a convenient mean to compare and classify several predicted separations [16]. Indeed, several multi-criteria decision-making procedures were possible and can be applied to separation methods. Among the possible methods, Derringer’s desirability function has proven to be helpful in selecting chromatographic conditions. This approach is based on the transformation of all responses in values dimensionless. Values of a desirability function (di) ranged between 0 and 1. The value of 0 corresponds to the worst response whereas the best response is associated with a value of 1. Resolution of chromatographic peaks (d1) and number of peaks per UV chromatogram (d2) were selected as discriminant parameters. Finally, the global desirability function (D) is calculated by geometric mean of the different derisability functions: D = (d1 × d2)1/2.
3 Results and discussion
3.1 Development of an analytical method in SFC
Recent studies show that the use of core shell particles allows increasing the column length to improve the high separation of the varied TAG species from vegetable oils in SFC [5]. The analysis method was first optimized in order to have the highest separation of all chromatographic peaks, not only the TAG but also compounds that were more polar, i.e. those eluted prior to the TAG on the chromatogram.
As a consequence, the quality of the separation was improved by the increase of the column number, leading to an enhancement of the theoretical plate number, the modification of the mobile phase nature and the column temperature to increase the separation factors (α) of compounds. To facilitate the development of chromatographic methods, the optimization of the mobile phase composition and the temperature has been carried out on 3 columns in order to decrease the analysis time and keep all separation of different chromatographic peaks. The optimization was performed using Derringer's desirability function (see part 2.6). The nature of the mobile phase was also selected using the Derringer’s desirability function. Different modifiers were tested with CO2. The best TAG separation was obtained with a mixture of ACN/MeOH 80/20 (v/v).
Table 1 summarizes different Derringer scores (d1,d2) obtained with different modifiers for the compounds eluted between 3 and 16 min, i.e. for the four mass of peaks (Fig. 1). As shown in this table, using a mobile phase composed of CO2/MeOH (90/10) or CO2/MeOH/ACN (90/8/2) gives the best performance for the analysis of the extract of K. uvaria. At the same overall Derringer score, the final choice was to use a mobile phase composed of CO2/MeOH (90/10).
Derringer’s desirability function values.
| MeOH | MeOH/ACN (80/20) | MeOH/ACN (50/50) | MeOH/ACN (20/80) | ACN | |
| d1: Resolution | 1 | 0.98 | 0.51 | 0.37 | 0.41 |
| d2 : Number of peaks | 0.97 | 1 | 1 | 0.57 | 0.66 |
| D: Derringer's factor | 0.98 | 0.99 | 0.71 | 0.46 | 0.52 |
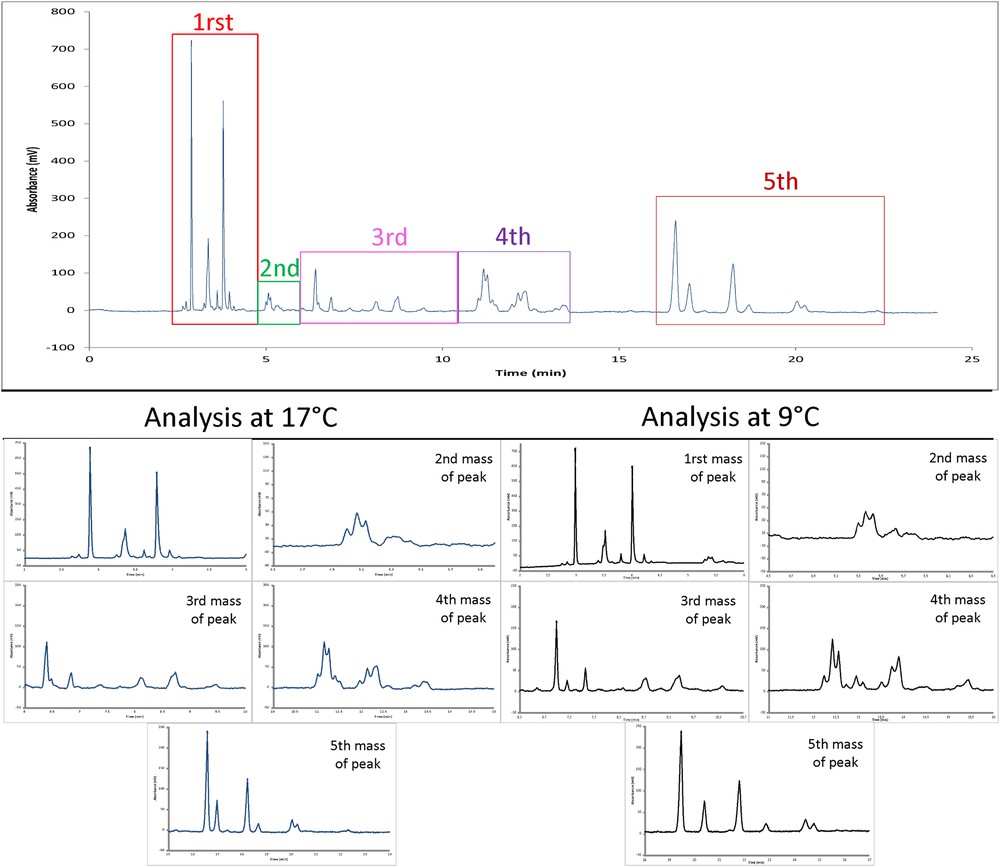
Comparison of Kniphofia uvaria extract UV chromatograms (30 000 ppm) according to two temperatures 17 °C (left column) and 9 °C (right column). Chromatograms represent different parts of analysis shown in Fig. 3 Kinetex C18 columns (150 × 4.6 mm; 2.6 μm). Mobile phase: CO2/MeOH (90/10) (v/v), isocratic elution at 1 mL/min, BPR: 100 bar, Vinj: 1 μL, UV detection at 210 nm.
Besides, a modifier of MeOH/ACN could be used for the analysis of other vegetable oils having a higher amount of TAG giving a slightly higher separation factor (α) between TAG (Table 2). Methanol is a protic solvent whereas acetonitrile is a non protic one. Acetonitrile interacts and modifies the elution of TAG having different double-bond positions, for instance OLL (C18:1/C18:2/C18:2)/OOLn (C18:1/C18:1/C18:3) in rapeseed oil. Due to the less number of TAG species in the extract of K. uvaria, the use of pure methanol as a modifier allows the complete separation of TAG, despite the lower separation factor values for some couples of TAG.
Selectivity between two couples of triacylglycerols in function of the nature of modifiers.
| MeOH | MeOH/ACN (80/20) | MeOH/ACN (50/50) | MeOH/ACN (20/80) | ACN | |
| Selectivity (LLL-PLL) | 1.031 | 1.042 | 1.053 | 1.064 | 1.065 |
| Selectivity (OLL-PLL) | 1.011 | 1.010 | 1.011 | 1.012 | 1.013 |
Concerning the temperature of the analysis, as shown in Fig. 1, it appears that a low temperature (9 °C vs 17 °C) improves the number of chromatographic peaks better separated, in particular for the 3rd and 4th groups of chromatographic peaks. Nevertheless, the number of chromatographic peaks was the same for the two temperatures. At low temperatures, the CO2 density is higher. As a consequence, interactions between the analytes and mobile phase were modified changing the retention of compounds on chromatographic columns.
3.2 Characterization by SFC-MS and SFC-UV
3.2.1 First screening by SFC-UV analysis
A first screening of the extract of K. uvaria at different wavelengths was performed in order to identify the different molecular families. For this first screening and to prevent having long run duration, the analysis was performed with 3 C18 Kinetex columns. The results of SFC-UV are presented in Fig. 2. The wavelengths used were 210, 280, 360 and 430 nm. At 210 nm, the different molecular families were not discriminated but this wavelength gives an overview of all compounds present in the extract; 280, 360 and 430 nm wavelengths were used to identify phenols, flavonoids and quinones/carotenoids compounds, respectively.

UV Chromatograms of Kniphofia uvaria extract (30 000 ppm) at 210, 280, 350 and 430 nm. 3 Kinetex C18 columns (150 × 4.6 mm; 2.6 μm), mobile phase: CO2/MeOH (90/10) (v/v), isocratic elution at 1.5 mL/min, BPR: 150 bar, Vinj: 1 μL, temperature: 9 °C, UV detection at 210, 280, 360 and 430 nm.
According to UV chromatograms, the extract of K. uvaria seems to have different molecular families. At 210 nm, all compounds such as TAG, DAG, FA and polyphenols absorbed. At 280 nm, glycerides and tocopherols respond. At 360 and 430 nm, the chromatographic profile showed the possible presence of flavonoids and carotenoids/quinonic compounds. The colored bioactive compounds are present in the beginning of the UV chromatogram. These ones were not correctly separated due to their higher polarity. As a consequence, an adapted system to an exhaustive separation of these compounds in a vegetable oil extract was further developed by SFC-UV (see part 3.3).
3.2.2 SFC-HRMS analysis
An SFC-HRMS hyphenation was realized to obtain structural information and to allow identification of the main compounds in the vegetable matrix. The identification process has been carried out using accurate mass measurements of pseudomolecular ions and their fragments. Analysis of vegetable oils by MS have already been reported in the literature and the APCI source in positive mode is the most widely used [15, 17]. Mass spectrometry by addition of another dimension is a common way to distinguish co-eluted compounds that cannot be chromatographically resolved. The increase of the number of columns is an important parameter to obtain the best possible separation. Indeed, with 7 columns linked in series, a total of 53 peaks were counted while 42 peaks were observed with 5 columns. As a consequence, the use of 7 chromatographic columns has been necessary in order to prevent co-elution peaks and simplify the identification of compounds. However, the analysis duration was enhanced, from 70 to 100 min. The obtained separation is illustrated in Fig. 3. A good resolution was obtained for TAG with the same Equivalent Carbon Number (ECN). ECN is defined as ECN = CN − 2DB, where CN is the number of carbon atoms and DB the total number of double bonds. Table 3 gives the name, symbol, carbon numbers and double-bond numbers of fatty acids.
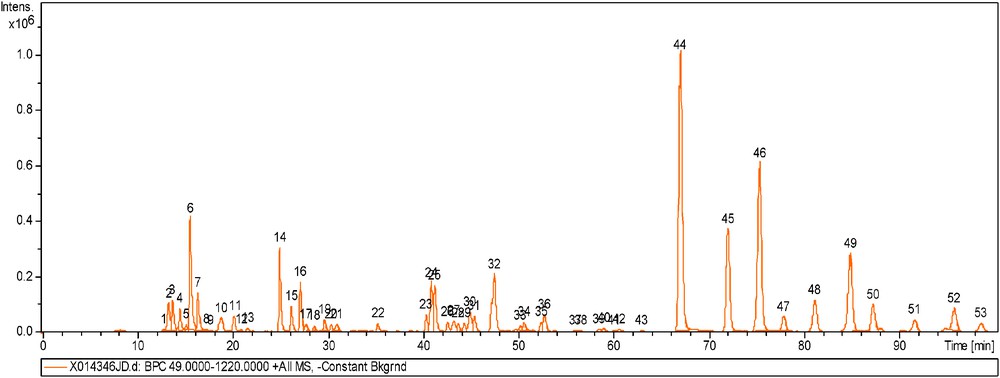
BPC chromatogram of the Kniphofia extract (500 ppm) in APCI+. 6 Kinetex C18 (150 × 4.6 mm, 2.7 μm) and 1 Accucore C18 (150 × 4.6 mm, 2.6 μm) columns connected in series, mobile phase CO2/MeOH (90/10) (v/v), at 1.1 mL/min, BPR: 100 bar, Vinj: 5 μL, temperature 9 °C.
Trivial names of fatty acids found in diacylglcyerols and triacylglycerols listed with their abbreviations, carbon numbers (CN), number of double bonds (DB), equivalent carbon numbers (ECN) and molecular masses.
| Trivial name | Symbol | CN: DB | ECN | Accurate molecular mass |
| Myristic | M | C14: 0 | 14 | 228.20893 |
| Palmitoleic | Po | C16: 1 | 14 | 254.22458 |
| Palmitic | P | C16: 0 | 16 | 256.24023 |
| Margaric | Ma | C17: 0 | 17 | 270.25588 |
| Stearidonic | – | C18: 4 | 10 | 276.20893 |
| Linolenic | Ln | C18: 3 | 12 | 278.22458 |
| Linoleic | L | C18: 2 | 14 | 280.24023 |
| Oleic | O | C18: 1 | 16 | 282.25588 |
| Stearic | S | C18: 0 | 18 | 284.27153 |
| Nonadecanoic | – | C19: 0 | 19 | 298.28718 |
| Gadoleic | G | C20: 1 | 18 | 310.28718 |
| Arachidic | A | C20: 0 | 20 | 312.30283 |
| Behenic | B | C22: 0 | 22 | 340.33413 |
| Lignoceric | Li | C24: 0 | 24 | 368.36543 |
The elution order of FA, DAG and TAG is coherent since they elute in function of their polarity as it was shown after identification by MS analysis. At the beginning of the MS chromatogram, FA elute, then DAG and finally TAG: the number of carbons increases inside a molecular family with the retention time.
Using accurate mass measurement from MS acquisition on the [M+H]+ pseudomolecular ion and SmartFormula algorithm (Bruker), hypothesis of molecular formulas was generated according to a mass tolerance of 3 ppm. The results obtained by the SFC method for the extract of K. uvaria are summarized in Table 4, where 51 compounds were detected by mass spectrometry. 14 compounds have not been identified by SFC-APCI-HRMS which are mainly present between DAG and TAG mass of peaks. It could be possible to have the presence of phenolic compounds in the oily extract as in olive oil or other non-identified sterols [18, 19].
Mass spectrometry results of the Kniphofia uvaria extract obtained in APCI+ and hypothesis for compound identification.
| Peak | Retention time (min) | Accurate mass [M+H]+ | Hypothesis of molecular formula [M+H]+ | Δmass (ppm) | CN | DB | ECN | Tentative of identification |
| 1 | 13.32 | 353.2684 | C31H37O4 | 0.60 | 31 | 4 | 23 | Linolenoylglycerol |
| 2 | 13.34 | 279.2317 | C18H31O2 | 0.46 | 18 | 4 | 10 | Ln |
| 3 | 13.78 | 297.2419 | C18H33O3 | 1.87 | 18 | 3 | 12 | Ln + H2O |
| 4 | 14.55 | 355.2837 | C21H39O4 | 1.76 | 21 | 3 | 15 | Linoleoylglycerol |
| 5 | 15.16 | 357.2990 | C21H41O4 | 0.87 | 21 | 2 | 17 | Oleylglycerol |
| 6 | 15.59 | 281.2472 | C18H33O2 | 1.21 | 18 | 3 | 12 | L |
| 7 | 16.40 | 283.2627 | C18H35O2 | 1.50 | 18 | 2 | 14 | S |
| 8 | 17.01 | 309.2782 | C20H37O2 | 1.91 | 20 | 3 | 14 | Eicosadienoic acid |
| 9 | 17.29 | 311.2951 | C20H39O2 | 2.00 | 20 | 2 | 16 | G |
| 10 | 18.81 | 615.4968 | C39H67O5 | 2.38 | 39 | 7 | 25 | LnL |
| 11 | 20.17 | 633.5079 | C39H69O6 | 1.55 | 39 | 6 | 27 | Acetoxy-palmitoyloxy-propanyl-octadecatrienoate |
| 12 | 20.96 | 591.4979 | C37H37O5 | 0.66 | 37 | 5 | 27 | PoL |
| 13 | 21.60 | 635.5227 | C39H71O6 | 1.82 | 39 | 5 | 29 | Acetoxy-palmitoyloxy-propanyl-octadecadienoate |
| 14 | 24.95 | 617.5138 | C39H69O5 | 0.28 | 39 | 6 | 27 | LL |
| 15 | 26.17 | 593.5136 | C37H69O5 | 0.64 | 37 | 4 | 29 | LP |
| 16 | 27.12 | 619.5294 | C39H71O5 | 0.36 | 39 | 5 | 29 | OL |
| 17 | 27.75 | 893.7357 | C57H97O7 | 1.80 | 57 | 9.5 | 38 | n.d |
| 18 | 28.60 | 595.5296 | C37H71O5 | 2.00 | 37 | 4 | 29 | OP |
| 19 | 29.62 | 621.5447 | C39H73O5 | 1.00 | 39 | 4 | 31 | OO |
| 20 | 30.35 | Not visible | C39H75O5 | n.d | 39 | 3 | 33 | OS |
| 21 | 30.75 | 893.7223 | C57H97O7 | 0.70 | 57 | 10 | 37 | n.d |
| 22 | 33.32 | 911.7360 | C57H99O8 | 2.80 | 57 | 9 | 39 | n.d |
| 23 | 40.3 | 877.7279 | C57H97O6 | 0.08 | 57 | 10 | 37 | LnLL |
| 24 | 40.84 | 877.7279 | C57H97O6 | 1.04 | 57 | 10 | 37 | LnLL |
| 25 | 41 | 877.7279 | C57H97O6 | 1.04 | 57 | 10 | 37 | LnLL |
| 26 | 41.19 | 853.7285 | C55H97O6 | 0.36 | 55 | 8 | 39 | n.d |
| 27 | 42.56 | 853.7283 | C55H97O6 | 0.36 | 55 | 8 | 39 | n.d |
| 28 | 43.65 | 853.7283 | C55H97O6 | 0.36 | 55 | 8 | 39 | 22:2-Glc-Stigmasterol or 22:3-Glc-Sitosterol |
| 29 | 44.27 | 879.7437 | C57H99O6 | 0.09 | 57 | 9 | 39 | n.d |
| 30 | 45.35 | 879.7449 | C57H99O6 | 0.00 | 57 | 9 | 39 | n.d |
| 31 | 45.67 | 879.7449 | C57H99O6 | 0.00 | 57 | 9 | 39 | 22:1-Glc-Stigmasterol or 22:2-Glc-Sitosterol |
| 32 | 47.42 | 895.7375 | C57H99O7 | 1.12 | 57 | 9 | 39 | LnLL + H2O |
| 33 | 50.14 | 871.7596 | C55H99O7 | 0.07 | 55 | 7 | 41 | PoLL + H2O |
| 34 | 50.50 | 871.7384 | C55H99O7 | 0.11 | 55 | 7 | 41 | PoLL + H2O |
| 35 | 52.30 | 897.7590 | C57H101O7 | 0.11 | 57 | 8 | 41 | LLL + H2O |
| 36 | 52.68 | 897.7549 | C57H101O7 | 0.82 | 57 | 8 | 41 | LLL + H2O |
| 37 | 55.91 | 873.7546 | C55H101O7 | 1.41 | 55 | 6 | 43 | PPL + H2O |
| 38 | 56.47 | 873.7573 | C55H101O7 | 1.72 | 55 | 6 | 43 | PPL + H2O |
| 39 | 58.40 | 899.7705 | C57H103O7 | 1.11 | 57 | 7 | 43 | OLL + H2O |
| 40 | 58.87 | 899.7703 | C57H103O7 | 1.11 | 57 | 7 | 43 | OLL + H2O |
| 41 | 59.93 | 899.7697 | C57H103O7 | 0.56 | 57 | 7 | 43 | PLL + H2O |
| 42 | 60.49 | 899.7692 | C57H103O7 | 0.33 | 57 | 7 | 43 | PLL + H2O |
| 43 | 62.83 | 853.7272 | C55H97O6 | 0.86 | 55 | 8 | 39 | PoLL |
| 44 | 66.90 | 879.7450 | C57H99O6 | 1.54 | 57 | 9 | 39 | LLL |
| 45 | 71.84 | 855.7435 | C55H99O6 | 0.19 | 55 | 7 | 41 | PLL |
| 46 | 75.19 | 881.7585 | C57H101O6 | 0.92 | 57 | 8 | 41 | OLL |
| 47 | 77.66 | Not visible | n.d | n.d | n.d | n.d | n.d | PPL |
| 48 | 80.96 | 857.7589 | C55H101O6 | 0.49 | 55 | 6 | 43 | POL |
| 49 | 84.66 | 883.7744 | C57H103O6 | 0.55 | 57 | 7 | 43 | OLO |
| 50 | 87.06 | 883.7762 | C57H103O6 | 1.44 | 57 | 7 | 43 | SLL |
| 51 | 91.42 | 859.7747 | C55H103O6 | 0.25 | 55 | 5 | 45 | PPO |
| 52 | 95.61 | 885.7906 | C57H105O6 | 0.03 | 57 | 6 | 45 | OOO |
| 53 | 98.35 | 885.7896 | C57H105O6 | 1.13 | 57 | 6 | 45 | SOL |
As shown in Fig. 3, the MS chromatogram can be divided into different parts corresponding to the molecular families. The first part is before 18 min and corresponds to FA and monoacylglycerol (MAG): linoleic acid and linolenic acid by their molecular masses at 281 and 279 m/z. At 13.78 min, a molecular mass of 297 m/z with a loss of 18u was detected and corresponds to a hydroxyled FA. Other FA such as eicosenoic acid or stearic acid were detected. FA have an elution that depends on the number of carbons and double bonds of acyl groups.
Acetylated DAG were observed at 20.17 and 21.60 min with m/z of 633 and 635. Between 18 and 30 min, the second part of this chromatogram, corresponds to DAG such as linaloyl-LL, which was identified by its molecular peak at 617 m/z and a specific fragment ion at 280 m/z corresponding to the loss of a linoleic acid. However, it could be difficult to identify the molecular ion of some compounds because of in-source fragmentation, leading to the formation of specific fragment ions like [M+H–H2O]+ for DAG. For example, LL has a [M+H]+ ion at 617 m/z and a [M+H–H2O]+ fragment at 599 m/z. According to other LC-MS studies performed in positive APCI, a loss of water was observed from DAG and the observed molecular ion was usually: [M–H2O + NH4]+ [20].
Between 40 and 60 min different kinds of compounds were detected: TAGs and two sterol glucosides. The PPL TAG was identified by ions fragments. According to V. Wewer and co-workers, these last compounds have been found in the genus Arabidopsis from leaves and roots [21]. In this previous study, the use of an analytical chromatographic method coupled to a quadrupole-time-of-flight mass spectrometer (Q-TOF-MS/MS) allows the resolution and identification of the molecular species of all sterol lipid classes from Arabidopsis thaliana: free sterols, acylated sterol glucosides, sterol glucosides and sterol esters. Moreover, sterol glucosides such as β-sitosteryl glucoside have already been identified in olive oil [22].
The last part of the MS chromatogram corresponds to TAG, which were easier to identify due to the loss of two FA by fragmentation. As was shown on the MS chromatogram in Fig. 3 and in Table 4, TAG isomers with the same ECNs are also possible, for example the pair OLL and PLL (ECN = 41) or the group of POL, OLO and SLL (ECN = 43) can be easily resolved. Fig. 4 shows the MS spectrum of LLL with a molecular peak at 879 m/z and some fragment ions. Fig. 5 explains the fragmentation pathway of TAG and leads to a fragment with an ion mass at 599 m/z. Then, a new fragmentation occurs, leading to two complementary ions at m/z 337 (-linoleoyl) and 263. Identification of the position of each fatty chain was not performed because the aim of this study was to identify the main molecular families in the matrix.
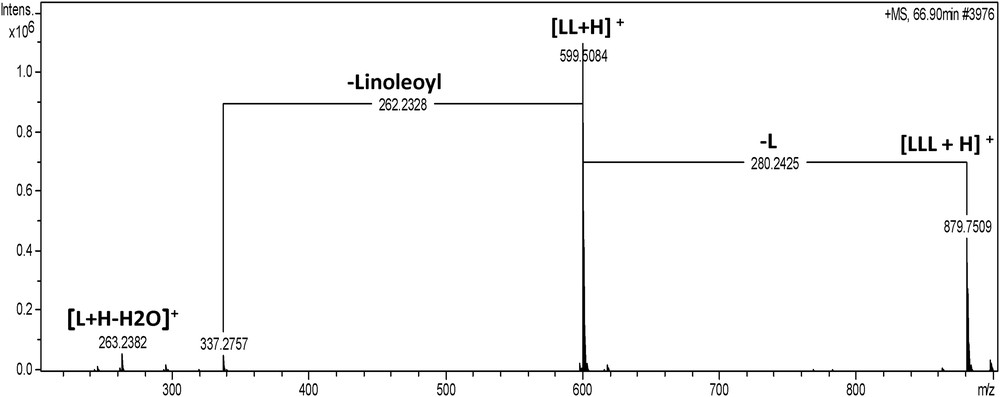
MS spectrum of LLL triacylglycerol.
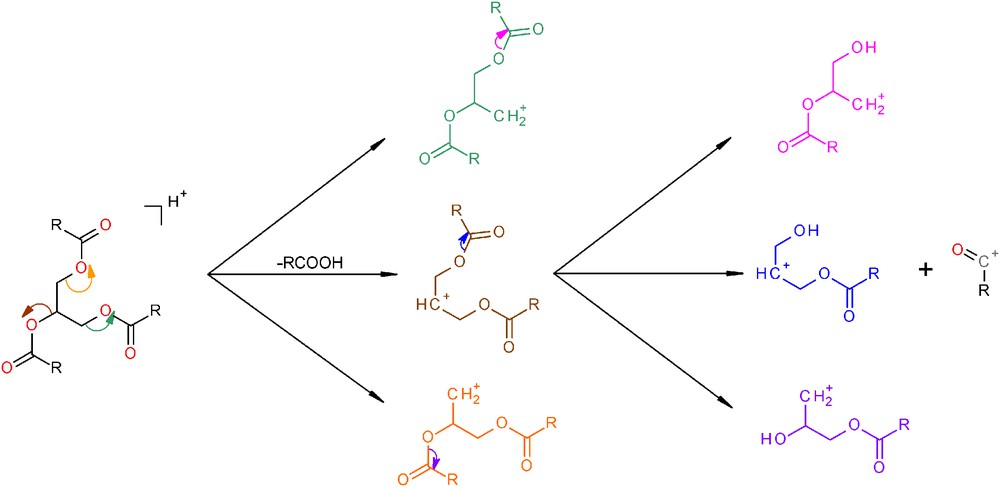
Fragmentation scheme of triacylglycerols.
Moreover, one part of the chromatogram has not been identified as shown in Fig. 6. However, in focusing on the 3D map representing the fragmentation pattern of different compounds in function of the retention time, it seems to be possible that a part of the chromatogram represents another kind of TAG family. Indeed, numerous kind of fatty acids exist such as hydroxylated FA, ketonic fatty acids, aldehydic fatty acids and epoxidized fatty acids [23]. In 1823, M.E. Chevreul suggested that TAG were the result of the esterification of FA with glycerol [24]. As a result, it would not be surprising to have non-typical molecules in an unknown complex vegetable matrix.
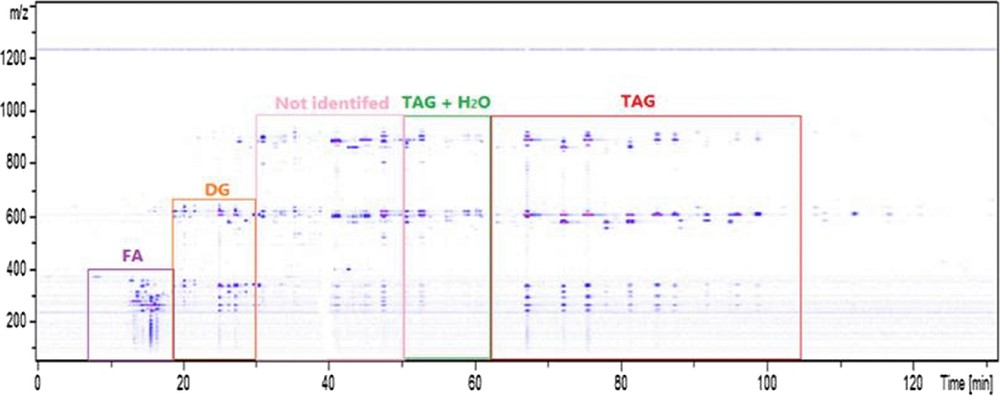
SFC-HRMS 3D map of the Kniphofia uvaria extract with retention times on the x-axis and mass spectra on the y-axis.
As can be seen in Table 4 and in Fig. 7 (at 897 and 899 m/z), several hydroxylated TAG have been identified. Several hydroxylated TAG have been characterized from castor oil, which triricinolein is the dominating one and was determinated by HPLC-APCI-MS and MALDI-MS [25]. Nevertheless, it must be noted that hydroxylated triacylglycerol derivatives could be produced from LLL and PLL triacylglycerols. Our first hypothesis was a degradation phenomenon during the extraction process or the storage. However, the benefit of using pure CO2 for the extraction process is its inertness toward most compounds. As a consequence, the degradation should not happen during the supercritical CO2 extraction [26].
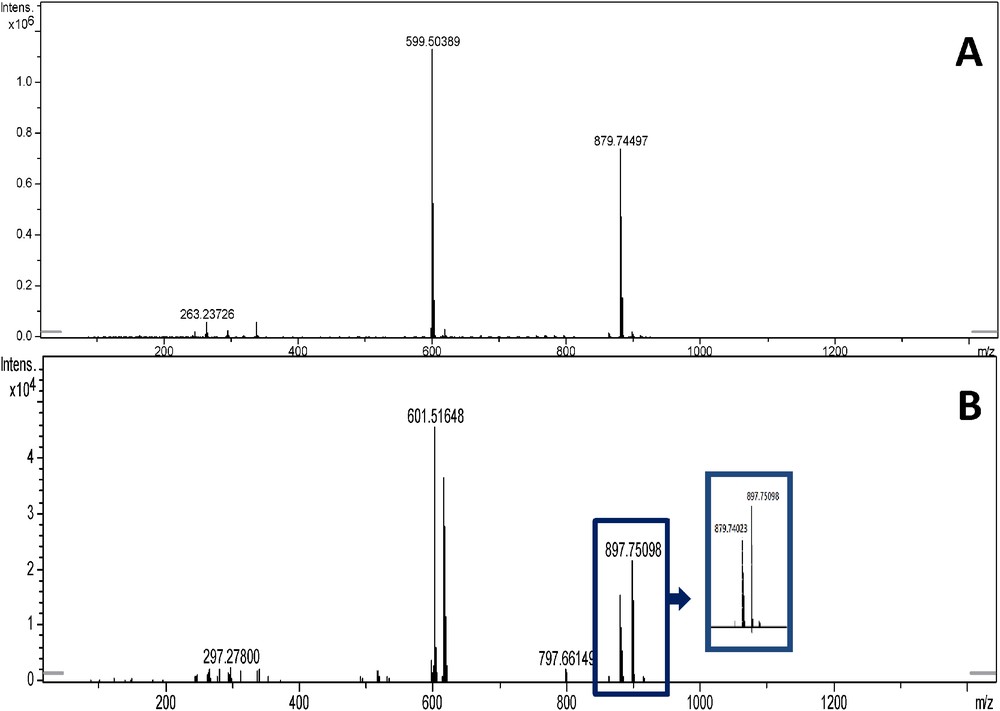
MS spectra of LLL (A) and LLL + H2O (B) triacylglycerols.
Despite the absorbance at 430 nm (Fig. 2), no anthraquinone peak has been found by using the Base Peak Chromatogram (BPC) that is a selection of the most intense ion per unit of time. It was necessary to perform an Extracted Ion Chromatogram (EIC) to determine and confirm their presence in the sample. With an EIC at 271.06 ± 0.01 m/z, one compound was found at 13.80 min. The area of this peak (79 392 au), corresponding to aloe emodin, was very small in comparison to the ones of FA: linoleic acid has an area of 271 779 au for example.
The analysis was performed in negative mode too. From this analysis, 44 chromatographic peaks were detected. After identification of the compounds, no new molecular family has been found. Nevertheless, other FA have been detected in the oil: stearic, palmitic and oleic acids, showing the higher response of acidic compounds in negative APCI. However, it was possible to detect chrysophanol, physcion, aloe emodin and rhein by the use of EIC at 253.0506, 283.0612, 269.0455 and 283.0248 ± 0.001 m/z, respectively. Physcion and chrysophanol were not detected in positive APCI due to their very low amounts in the extract, whereas the acidic group of rhein and the hydroxyl group of aloe emodin allow a better response in negative APCI. Moreover, the co-elution of anthraquinones with FA can lead to ion suppression in mass spectrometry.
3.2.3 Activity pattern of profiling analysis platform for an exhaustive identification
In the studies of vegetables, a wide chemical diversity of compounds exists that is associated with the high variability in physicochemical properties of natural products. This makes separation, detection and identification from their natural matrices extremely challenging. Therefore, a single analytical technique is not sufficient for an exhaustive analysis of a complex phytochemical composition, and the use of multiple technologies is necessary in order to identify each compound present in the global matrix. Different methods of detection such as UV and MS were performed to validate the nature of compounds present in the oily extract of K. uvaria.
3.3 Confirmation of anthraquinones by SFC-UV on a polar stationary phase
To avoid co-elution of quinones with other analytes (FA, DAG, and TAG) in order to achieve a better detection and quantification, a chromatographic method based on a polar stationary phase (BEH-2EP) was studied. This method has allowed confirming the presence of anthraquinone derivatives in K. uvaria extract by comparison of retention times with several standards. Fig. 8 shows four identified anthraquinones with UV detection at 430 nm: chrysophanol, physcion, aloe emodin and rhein. These compounds elute inverse of their polarities as it was observed with their structures. Indeed, chrysophanol and physcion elute first. Aloe emodin and rhein, the two main anthraquinones in terms of quantity, elute later due to their additional polar group. The differentiation between aloe emodin and rhein is the presence of a carboxylic acid on rhein which induces higher interactions with the basic stationary phase.
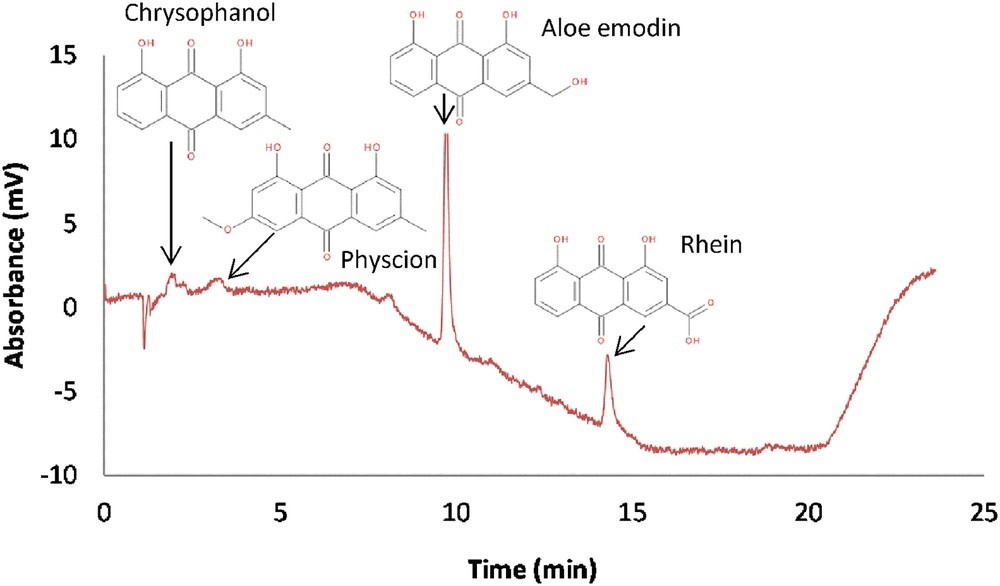
UV Chromatogram of the Kniphofia uvaria extract (30 000 ppm). BEH-2 EP (250 × 4.6 mm; 5 μm), Mobile phase A : CO2, B: MeOH, gradient elution: 0–5 min: 2% B, 5–14 min: 2–30% B, 14–19 min: 30% B, 19–21 min: 30-2% B at 3 mL/min, BPR: 150 bar, Vinj: 20 μL, UV detection at 430 nm.
The presence of these anthraquinones is well known and described in the genus Aloe [27], which belongs to the same plant family as Kniphofia: Xanthorrhoeaceae. This could explain their phytochemical similarities.
4 Conclusion
Fats and oils are important ingredients of skin care products. Studies conducted have revealed that although water plays an important role in keeping the skin moist, the ability of the top layers of the skin to resist moisture loss depends on the presence of certain long chain polyunsaturated lipids.
In this study SFC-UV and SFC-APCI-HRMS systems were used for the identification of lipid derivatives in a K. uvaria seed extract. As a result, the main molecular families were determined. The major constituents are triacylglycerols, diacylglycerols and fatty acids that were well detected by SFC-HRMS. The amount of these compounds is important in comparison to anthraquinone ones, but thanks to the high sensitivity of HRMS, they were also detected. Anthraquinone derivatives have been identified by comparison of retention time with standards in SFC-UV, and then confirmed by accurate mass measurement and retention time in SFC-HRMS. These anthraquinone compounds are well known and have already been identified in the genus Aloe. As a result, SFC coupled to UV and HRMS detections is a good analytical tool to analyze oil. Indeed, an exhaustive analysis was performed from a complex and natural mixture under simple chromatographic conditions (CO2/MeOH 90/10 in isocratic mode). More than 50 compounds have been detected and most of them have been identified. Moreover, this green technique needs only 10% of methanol, thus considerably reducing the amount of organic and toxic solvents used in HPLC. SFC coupled to mass spectrometry and UV detections is a complementary technique to liquid chromatography for hydrophobic compound screening.