1 Introduction
Keggin-type polyoxometalates [XM12O40]q− have long been studied due to their stability, acidity and oxidizing properties. There is a large range of applications for these compounds, going from new drug design or nuclear waste treatment to solar cell fabrication [1,2]. Perhaps, the most important application of these anions is as catalysts [1]. Nowadays, the search for more efficient, less waste producing “green routes” for on-plant processes has been intensified, and so has the research on the properties of Keggin type polyoxometalates as heterogeneous catalysts.
Fig. 1 shows the structure of the α-Keggin heteropolyanion [XM12O40]q−. Atoms in the M position are usually referred to as addenda atoms, and most frequently correspond to W, Mo and V. Other transition metal atoms can figure as addenda, but a high cationic charge is mandatory, although the ability to form double bonds with oxygen importantly increases the stability of the Keggin type polyanions. The atom at the X position, referred to as the heteroatom, can be practically any element that accepts a tetrahedral coordination [3].
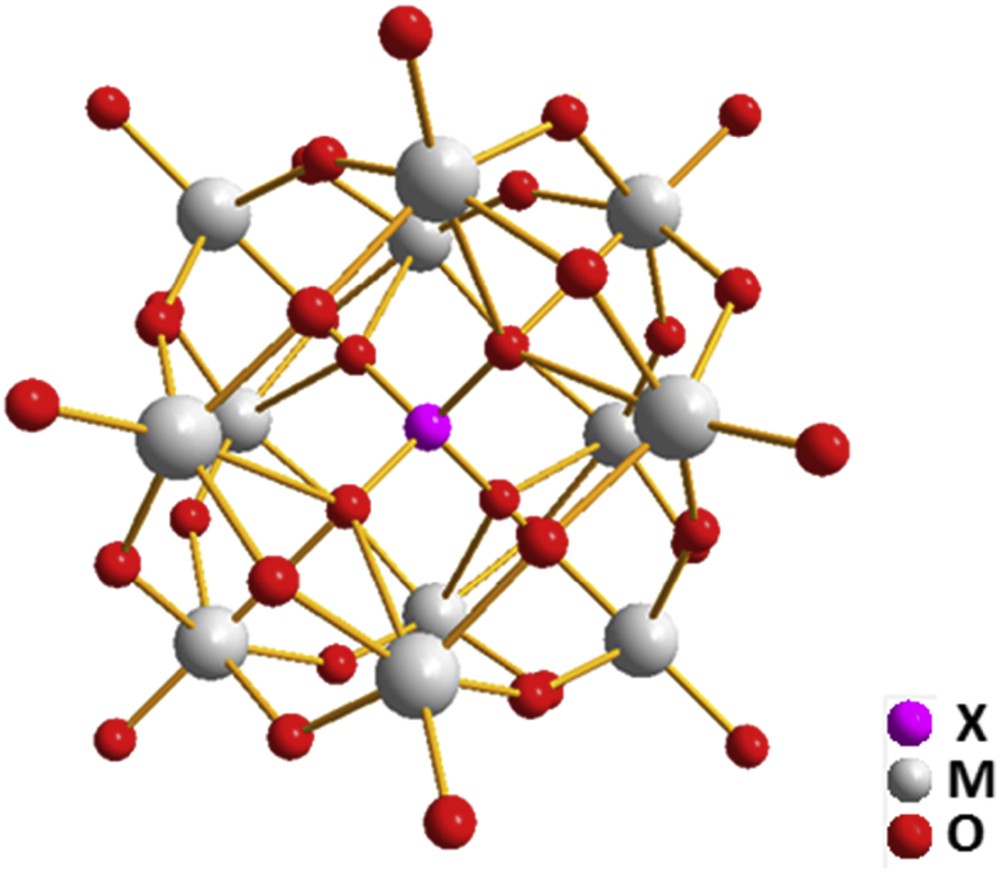
Ball and stick representation of a generic α-Keggin structure. One tetra coordinated heteroatom surrounded by an oxide-like shell formed by 12 cationic metal atoms with a distorted octahedral configuration.
A major advantage in using salts of Keggin heteropolyacids in catalyst design is the possibility of tuning their properties. The surface area, particle size and shape, thermal stability, solubility, permeability, acidity, redox properties, among other features, can be adjusted by the choice of addenda and heteroatoms, counter cations, or synthetic route. Further modifications, such as functionalization, are also feasible [3–7].
Vanadium substituted Keggin type heteropolyanions [XVxM12−xO40]q− have been investigated as catalysts for selective oxidation of acids, aldehydes and hydrocarbons, as well as oxidative dehydrogenation of alkanes [8–11]. Vanadium substitution in the Keggin anion does not affect its overall structure. Moreover single crystal X-ray diffraction analysis does not show any preferential position of vanadium in the crystal structure. Due to rotational disorder of the polyanion at the respective site, one can only obtain information on the cation site occupancy or M:V ratio [12], which does not rule out the possibility of compositional disorder such that polyanions with (x − 1), x and (x + 1) vanadium atoms coexist in the same crystal. NMR experiments have been performed to address this question, but no clear-cut conclusions are available. Mothé-Esteves et al. concluded from 31P and 51V MAS NMR analyses that the coexistence of different levels of substitution is in fact possible for H4PVMo11O40, if the samples are not crystallized in a desiccator under sulfuric acid vapors for several days [12]. Huang et al. used REAPDOR NMR to measure the P–V distance in the mono-substituted K4PVW11O40 and found a value that is compatible with the formal substitution degree [13].
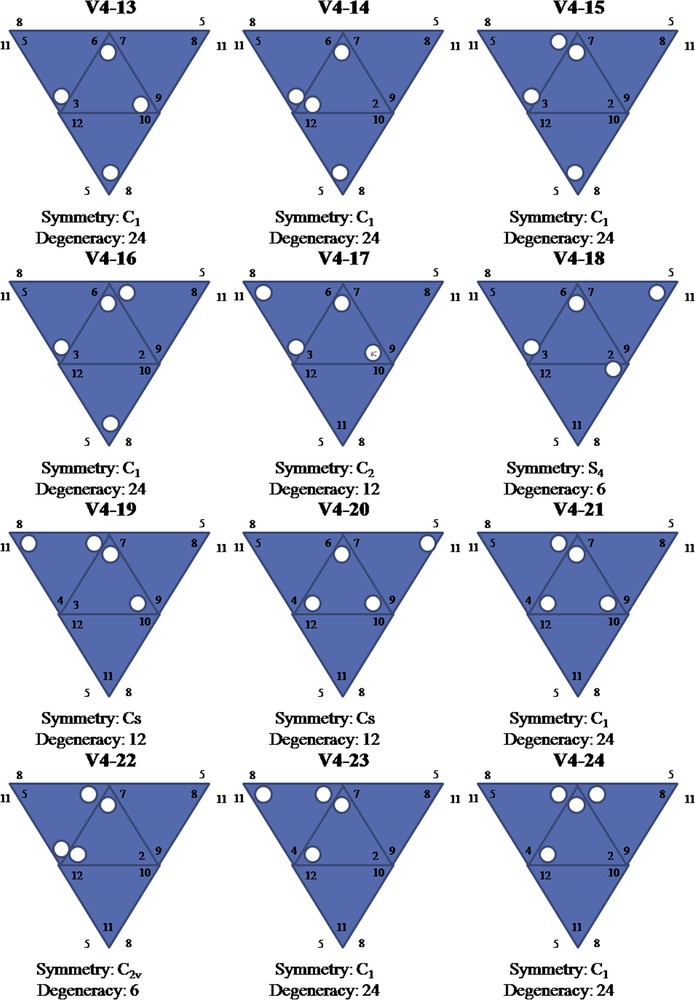
Due to the symmetrical structure of the Keggin anion, there are many different ways to substitute M for V when more than one V is added (Table 1). The current impossibility of preparing pure species for all possible isomers leads to difficulties in experimental analyses of mixed addenda Keggin anions. The unambiguous identification of different isomers in a given sample is not a trivial task, requiring 1- and 2-D NMR experiments [14].
Number of isomers, degeneracy and symmetry groups for the series [X-VnM12−nO40]q− 0 ≤ n ≤ 4.
| n | Number of isomers | Isomers (degeneracy; symmetry) |
| 0 | 1 | 1(1; Td) |
| 1 | 1 | 1(12; Cs) |
| 2 | 5 | 1(6; C2v) 2(12; Cs) 1(12; C2)a 1(24; C1)a |
| 3 | 13 | 2(4; C3v) 1(8; C3)a 3(12; Cs) 7(24; C1)a |
| 4 | 27 | 1(3; D2d) 1(6; S4) 1(6; C2v) 2(12; C2)a 6(12; Cs) 16(24; C1)a |
a Asymmetric isomer, both enantiomers counted.
A synthesis strategy of some specific isomers based on the utilization of known lacunary species has been proposed, the idea being to induce the insertion of substituent vanadium atoms in the vacant positions of the structure. From another perspective, Jentoft et al. [7] stated that Keggin polyanions undergo a dynamic equilibrium in solution, and are not kinetically inert species. This was evidenced by the fast precipitation of insoluble Zr3(PO4)4 after addition of ZrOCl2 to a solution containing Keggin ions; this precipitation suggests the presence of unbound, or at least accessible, PO43− anions in the solution. Rapid isotopic exchange of 18O by solid H3PMoO12 in H218O vapor flow supports this hypothesis as well [15]. In a general picture, one could have a thermodynamically favorable distribution of the isomers that are subjected to a kinetically controlled process. All these mechanisms and driven forces are still in debate and the present study aims to contribute and clarify this point.
As experimental investigation relative to Keggin anions is subjected to intrinsic limitations (e.g., preparation and separation of isomers), theoretical chemistry studies have the potential to provide invaluable information about these systems. However, the large number of electrons, the presence of many transition metal atoms and the high molecular charge make this kind of approach an uneasy task [16]. Semi-empirical and Hartree–Fock methodologies do not properly describe important characteristics of the system. DFT is the most commonly used theoretical method for investigating Keggin structures, with a growing number of publications on this subject after the year 2001 [2]. It has been shown that solvent effects must be included explicitly or via continuum models. In the same way, periodic calculations can be used to model Keggin species in the solid state in order to get more accurate results [2,17,18]. In fact, Keggin structures can only exist in the condensed state and the improvements gained in the calculations are probably due to the inclusion of stabilizing effects of the medium on such a highly charged anion.
As the precise molecular structure and the distribution of vanadium atoms among the Keggin units are of fundamental importance to rationalize the catalytic mechanism of Keggin based catalysts, the present work investigates the thermodynamics of isomerization and vanadium distribution in substituted Keggin structures by DFT calculation. We also propose an interpretation of vibrational spectra of these species that may help identifying the different isomers by comparison between theoretical and experimental infrared and Raman spectra.
2 Computational methods
The geometry optimization and vibrational frequency calculations were performed for all 54 possible isomers in the series [PVxW12−xO40](3+x)− 0 ≤ x ≤ 4 and [SiVxW12−xPO40](4+x)− 0 ≤ x ≤ 3. No geometric or symmetry restrictions were imposed during geometry optimizations.
All calculations were performed on the DFT/B3LYP level. Double ζ split valence Pople type basis set, plus one polarization function, (6-31G*) were used for phosphorus and silicon atoms. This same basis with an added diffuse function (6-31+G*) was used for oxygen atoms. For tungsten and vanadium, the Effective Core Potential (ECP) LanL2DZ basis set was used. This ECP basis set uses an effective potential to describe n equal to one and two orbitals for V and n up to four orbitals for W. The remaining orbitals were described by a double ζ quality basis set with relativistic effects implicitly included [19].
The polarizable continuum model with the integral equation formalism variant (Integral Equation Formalism Polarizable Continuum Model – IEFPCM) was used to include aqueous solvent stabilization effects [20].
Extra calculations were performed for the [PVW11O40]4− and [SiVW11O40]5− anions with the same basis and PCM, but with the M062X functional [21].
All calculations were performed on the Gaussian09 program [22]. Gaussview 5.0 was used for visualization of the results [23].
The main differences between Density Functional Theory (DFT) and Hartree-Fock (HF) method are worth emphasizing. In the HF method, the many-electron problem is approached by solving a 1-electron equation for each electron in an effective potential due to the nuclei and the other electrons. The electronic repulsion is taken into account as an average, which means that instantaneous interactions between electrons are not considered. It is commonly said that in the HF method, electronic correlation is missing. DFT, in the form presented by Kohn and Sham, leads to an equation that is formally similar to the HF one but with the important difference that, in principle, correlation is accounted for by the so-called exchange-correlation functional. The exact form of this potential is not known. Two approximations to it are used here, i.e. B3LYP and M062X.
Primary SCF convergence criterion was 10−8 Hartree. For geometry optimization, the maximum force should be less than 4.5×10⁻⁴. Vibrational frequencies are calculated from energy second derivatives with respect to nuclear coordinates. IR and Raman intensities are obtained from the derivative of the dipole moment with respect to nuclear coordinates and to the electric field respectively, as implemented in Gaussian.
3 Experimental section
3.1 Vibration spectroscopy
Infrared (IR) spectra were recorded using CsI pellets in the mid-region (4000–400 cm−1) and in the far region (600–200 cm−1) on a 550 FTIR Nicolet spectrometer. Raman spectra were acquired in the range of 100–1200 cm−1 with a Raman LabRAM Infinity microprobe (Jobin-Yvon – Horiba) equipped with a liquid-nitrogen-cooled detector and a frequency-doubled Nd:YAG laser supplying the excitation line at 632 nm. The power was less than 5 mW at the sample, avoiding structural damage to the sample under irradiation.
3.2 Synthesis
3.2.1 [SiVnW(12−n)O40]−(4+n)
The synthesis of all species with Si as the heteroatom was performed using a Titrino 799 Potentiometric Titulation apparatus from Metrohm in the static pH titulation mode. Na2WO4 (Σ, 99%), Na3VO4 (Σ, 98%), Na2SiO3 (Σ, 99%), NaVO3 (Σ, 99%), KCl (Spectrum, 99%), NaCl (Spectrum, 99%), Na2CO3 (Spectrum, 99%), KOH (Merck, 99.9%), HCl (Spectrum, 36% w/w) and methanol (Spectrum, 99.9%) were used as received.
Potassium salts of the [SiVW11O40]−5 and [SiV3W9O40]−7 Keggin anions were prepared from lacunary species [SiW11O39]−8 and [SiW9O34]−10; the method was adapted from the literature [14,24,25].
K4[SiW12O40] – 9.1 g of Na2WO4·2H2O (27.5 mmol) were dissolved in 15 mL of hot H2O (80–100 °C). 8.3 mL of 4 M HCl were added drop by drop under stirring for 5 min (solution A). 0.55 g of Na2SiO3·9H2O (2.5 mmol) were dissolved in 5 mL of water (solution B). Solution A was slowly added to B and 2.5 mL of 4 M HCl was added to the resulting solution, under stirring, and kept under reflux for 1 h. After cooling to room temperature 2.5 mL of a 1 M Na2WO4, and 4 mL of a 1 M HCl solutions were added. Final pH was adjusted to 2 with a 1 M KOH solution. 2.5 g of KCl (33 mmol) were used to precipitate the compound. Recrystallization was performed by adding H2O at 50 °C and adjusting the pH to 2 with a 4 M HCl solution.
K3[H2SiVW11O40] – prepared following Bonfim et al. [25]. Elemental analysis: calculated ratios K:W = 0.27; V:W = 0.09; Si:W = 0.09. Observed ratios K:W = 0.26; V:W = 0.05; Si:W = 0.11.
K6[SiV2W10O40] – prepared by Bonfim et al. (unpublished results).
K7[SiV3W9O40] – prepared as described by Bonfim et al. [26]. Elemental analysis: calculated ratios K:W = 0.78; V:W = 0.33; SI:W = 0.11. Observed ratios K:W = 0.71; V:W = 0.30; Si:W = 0.08; Na:W = 0.03; 11.29 H2O molecules.
3.2.2 [PVnW(12−n)O40]−(3+n)
The preparation of all species with P as the heteroatom was performed using NaVO3 and Na2WO4‧2H2O from Sigma–Aldrich, KCl from Merck and H3PO4 (85%) from Vetec. The synthesis route of all the following vanadium-containing polyanions was adapted from Smith and Pope [27], where the proportion between reagents was changed in order to obtain different substitution degrees.
K3[PW12O40]‧xH2O – 0.13 g of KCl (1.74 mmol) were dissolved in 10 mL of 70 °C pre heated water (solution A). 2.08 g of phosphotungstic acid were dissolved in 10 mL of water (solution B). Solution A was added to B under continuous stirring and kept at 70 °C until the formation of a gel. Further steps were adapted from Zhang et al. [28]. Elemental analysis: calculated ratio K:W = 0.25. Observed ratio K:W = 0.24.
K4[PV1W11O40]‧xH2O – 0.92 mol of Na2WO4‧2H2O and 0.1 mol of NaVO3 were used; H3PO4 was added until the pH reached 2.0; sufficient KCl was added to initiate the precipitation. Elemental analysis: calculated ratios K:W = 0.36; V:W = 0.09. Observed ratios K:W = 0.42; V:W = 0.08.
K5[PV2W10O40] – 0.84 mol of Na2WO4‧2H2O and 0.2 mol of NaVO3 were used; H3PO4 was added until the pH reached 3.0; sufficient KCl was added to initiate the precipitation. Elemental analysis: calculated ratios K:W = 0.50; V:W = 0.20. Observed ratios K:W = 0.66; V:W = 0.18.
K6[PV3W9O40] – 0.50 mol of Na2WO4‧2H2O and 0.3 mol of NaVO3 were used; H3PO4 was added until the pH reached 5.0; sufficient KCl was added to initiate the precipitation. Elemental analysis: calculated ratios K:W = 0.67; V:W = 0.33. Observed ratios K:W = 0.64; V:W = 0.43.
K7[PV4W8O40] – 0.67 mol of Na2WO4‧2H2O and 0.4 mol of NaVO3 were used; H3PO4 was added until the pH reached 7.5; sufficient KCl was added to initiate the precipitation. Elemental analysis: calculated ratios K:W = 0.88; V:W = 0.5. Observed ratios K:W = 0.72; V:W = 0.5.
4 Results and discussion
4.1 Validation of the calculation method
In order to validate our calculation methodology, we compared our results with published experimental data. Comparison with theoretical data from others groups was also included for the same purpose.
As mentioned, it is impossible to obtain a pure sample of the large majority of the target compounds, so a case to case validation is not feasible. Instead, the non-substituted Keggin polyanions [PW12O40]3− and [SiW12O40]4− were used to validate the methodology and the merit was extended to all other species.
Table 2 shows bond length data obtained from X-ray diffraction along with four published DFT data including our own results for the [PW12O40]3− species.
Bond lengths for the Keggin structure [PW12O40]3−.
| Bond lengths | ||||||
| Bond | Experimentala | Molecular DFT [31] | Molecular DFTb | Molecular plane wave DFTd,c | Periodic plane wave DFTd [32] | This work |
| WOd | 1.70 | 1.73 | 1.71 | 1.72 | 1.73 | 1.71 |
| W–Oc | 1.91 | 1.93 | 1.92 | 1.93 | 1.92 | 1.93 |
| W–Ob | 1.90 | 1.91 | 1.91 | 1.93 | 1.92 | 1.92 |
| W–Oa | 2.43 | 2.43 | 2.42 | 2.48 | 2.48 | 2.46 |
| P–Oa | 1.53 | 1.58 | – | 1.54 | 1.54 | 1.55 |
Calculations led to good agreement with the experimental values, but with slightly longer bonds. The five theoretical approaches shown in Table 2 differ from each other, and all of them give rise to satisfactory values. This fact suggests that bond lengths are, in some ways, unresponsive to the calculation methodology. Bridgeman stated that Hartree-Fock methodology gives rise to optimized geometries of good agreement as well, but leads to poor vibration frequencies [29]. Summarizing, a good geometry optimization is an important part of the task, but this data alone does not guarantee a good description of the system. As the theoretical vibrational analysis is based on the second derivative of the energy with respect to coordinates, it is much more reliable for the evaluation of the applied methodology.
Comparison of our data, including or not the PCM model, with the experimental spectrum acquired by Rocchiccioli-Deltcheff [30], and with the theoretical spectra published by Bridgeman [29] is given in Table 3.
Theoretical and experimental spectra for the Keggin species [PW12O40]3−.
| Label | Symmetry | Calculated | Calculated without PCM | Calculated by Bridgeman [29] | Experimental [30] | |
| IR | Raman | |||||
| ν43 | T2 | 1078 (0.05) | 1083 | 1066 (0.09) | 1080 (s) | |
| ν1 | A1 | 1025 | 1026 | 998 | 1004 (vs)a | |
| ν14 | E | 1009 | 1009 | 987 | 993 (m) | |
| ν44 | T2 | 1005 (0.06) | 1008 | 981 (0.19) | 987 (sh) | 986 (m) |
| ν45 | T2 | 991 (0.15) | 996 | 969 (0.46) | 976 (s) | |
| ν15 | E | 902 | 929 | 927 | 925 (sh) | |
| ν46 | T2 | 872 (0.15) | 910 | 915 (0.24) | 895 (s) | 898 (w) |
| ν47 | T2 | 770 (1.00) | 834 | 840 (1.00) | 810 (vs) | |
| ν48 | T2 | 584 (0.01) | 585 | 550 (0.02) | 596 (m) | |
| ν3 | A1 | 531 | 539 | 530 | 523 (w)a | |
| ν49 | T2 | 520 (0.04) | 530 | 522 (0.03) | 522 (m) | |
| ν4 | A1 | 507 | 511 | 521 | 518 (m) | |
| ν50 | T2 | 498 (0.01) | 512 | 515 (0.01) | 511 (m) | |
| ν18 | E | 462 | 474 | 466 | 474 (w) | |
| ν5 | A1 | 425 | 428 | 446 | 433 (w) | |
| ν53 | T2 | 392 (0.15) | 413 | 417 (0.14) | 387 (s) | |
| ν19 | E | 424 | 425 | 409 | 412 (w) | |
| ν6 | A1 | 373 | 390 | 401 | 375 (w) | |
| ν54 | T2 | 364 (0.02) | 383 | 383 (0.01) | 335 (m) | 337 (w) |
| ν56 | T2 | 278 (0.001) | 284 | 290 (0.001) | 268 (sh) | 260 (w) |
| ν21 | E | 222 | 237 | 231 | 239 (sh) | |
| ν7 | A1 | 223 | 226 | 228 | 231 (m)a | |
| ν8 | A1 | 214 | 218 | 219 | 216 (s) | |
| ν22 | E | 208 | 212 | 217 | 207 (w) | |
| ν23 | E | 183 | 190 | 186 | 187 (w) | |
| ν24 | E | 156 | 162 | 166 | 156 (m) | |
| ν9 | A1 | 141 | 142 | 145 | 143 (s) | |
| ν25 | E | 107 | 107 | 114 | 101 (s) | |
| ν26 | E | 84 | 84 | 86 | 87 (s) | |
| Maximum error | 40 | 48 | 46 | |||
| Average of the | 212.24 | 231.83 | 310.90 | |||
| Square of errors |
a Reported as polarized on DMF solution.
It is not possible to perform a statistical analysis, such as χ2 or t-Student distribution, for the determination of the best results. On one hand, the error on experimental and calculated data are of distinct nature, and the latter does not generate a normal distribution around an expected value. On the other hand, the experimental data cannot be taken as the expected value since it has its own error distribution. To deal with this difficulty, we used the maximum error and the average of the square of errors as comparison tools.
Our results are in close agreement with the experimental data and showed the smallest maximum error and average of the square of errors. Most importantly, the PCM model led to a correct estimate of vibrational data (Table 3). Fig. 2 shows the theoretical spectrum of [PW12O40]3− compared with the experimental spectrum of its potassium salt.
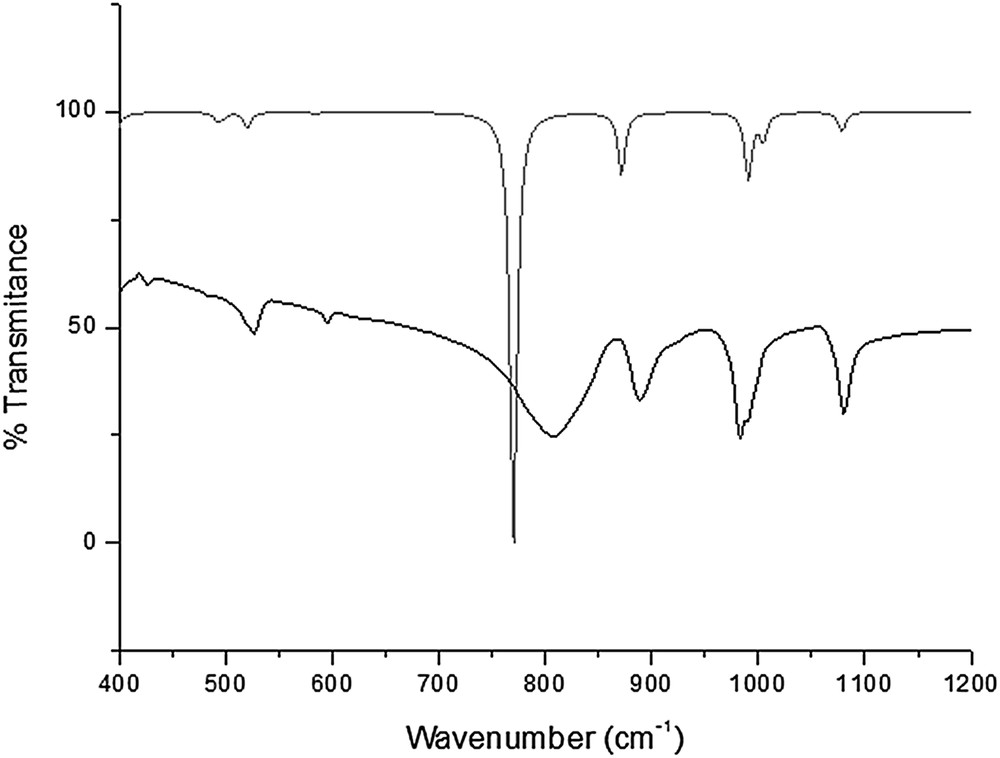
Theoretical (gray line) IR spectrum of [PW12O40]3− and experimental (dark line) IR spectrum of its K salt.
Vanadium substituted Keggin anions show additional bands in the IR spectrum compared to the non-substituted one because of their lower symmetry and vibrational modes involving lighter vanadium atoms. In Keggin structures containing phosphorus as the heteroatom, the vanadium predominant collective modes lay near the PO43− inner tetrahedron modes in the 1060–1100 cm−1 region. The respective band shape has been used as an indication of the amount of vanadium atoms in the anion: doublet of 1:1 intensity ratio indicating mono-substituted species, triplet 1:1:1 for the di-substituted and doublet 2:1 for the tri-substituted species [35]. In the calculated spectrum, the triply degenerate T symmetric IR active mode of the non-substituted anion splits into different A′ and A″ modes in the case of the mono-substituted species due to loss of symmetry. For the [PVW11O40]4− anion, the transition at 1103 cm−1 and the three transitions in the range 1061–1068 cm−1 (a broad band due to the splitting of the triply degenerate PO43− transition) are in good agreement with the 1103–1082 cm−1 doublet of the K salt of the anion, reported by Huang et al. [35]. This observation also validates the methodology used in this work. The other two cases reported by that group (di- and tri-substituted species) will be discussed in detail later on.
4.2 Boltzmann distribution among isomers
After geometry and frequency calculations, the Gaussian program estimates the Gibbs free energy as the sum of electronic energy, solvation free energy and thermal corrections for electronic, translational, vibrational and rotational levels for enthalpy and entropy. The interest in obtaining Gibbs free energy lies in the assumption that at some point in the synthesis process, the reactants are pushed to the minimum energy configuration associated to a thermodynamically stable state. This assumption is important when assuming the hypothesis, as formulated in the introduction that the Keggin anions undergo a dynamic equilibrium in solution, which can yield an equilibrium state between different isomers, even when the synthesis route uses lacunary Keggin species. For the hydrothermal synthesis route, where stoichiometric amounts of W and V are added and no lacunary structure is used or produced in situ before vanadium addition, the hypothesis of a driving force toward the equilibrium is even stronger.
For this purpose, Gibbs free energy values were used to calculate the Boltzmann distribution supposing a thermodynamic equilibrium between the different possible isomers:
| (1) |
| (2) |
Here again the degeneracy is defined as the number of different substitutions leading to identical geometric isomers (Table 1).
Table 4 shows the Gibbs free energy, the difference ΔG in free energy between each isomer and the most stable one, the degeneracy and the percentage of a given isomer of the series [PVxW12−xO40](3+x)− 0 ≤ x ≤ 4. Table 5 provides the data for the series [SiVxW12−xO40](4+x)− 0 ≤ x ≤ 2. From here on, structures will be labeled by their heteroatom and amount of V substituent (PV0 for [PW12O40]3−, SiV2 for [SiV2W10O40]6− and so on). All isomer configurations are available as the Supplementary material. Most stable isomers are highlighted in the tables.
Degeneracy, Gibbs free energy, difference ΔG and ratio of each isomer for the series [PVxW12−xO40](3+x)− 0 ≤ x ≤ 4.
| Label | Degeneracy | Gibbs free energy “G” (Hartree) | ΔG (kJ/mol) | Ratio |
| PV0 | 1 | −4167.409660 | – | 100.00% |
| PV1 | 12 | −4171.033354 | – | 100.00% |
| PV2-1 | 12 | −4174.648070 | 5.27 | 4.97% |
| PV2-2 | 12 | −4174.648334 | 4.57 | 9.44% |
| PV2-3 | 12 | −4174.650076 | 0.00 | 36.29% |
| PV2-4 | 24 | −4174.649176 | 2.36 | 45.84% |
| PV2-5 | 6 | −4174.648826 | 3.28 | 3.46% |
| PV3-1 | 4 | −4178.248199 | 12.17 | 0.05% |
| PV3-2 | 24 | −4178.250235 | 6.83 | 2.54% |
| PV3-3 | 24 | −4178.250549 | 6.00 | 3.54% |
| PV3-4 | 24 | −4178.251213 | 4.26 | 7.15% |
| PV3-5 | 24 | −4178.249866 | 7.80 | 1.72% |
| PV3-6 | 12 | −4178.250787 | 5.38 | 2.28% |
| PV3-7 | 4 | −4178.248888 | 10.37 | 0.10% |
| PV3-8 | 24 | −4178.252174 | 1.74 | 19.78% |
| PV3-9 | 12 | −4178.250651 | 5.74 | 0.24% |
| PV3-10 | 24 | −4178.250474 | 6.20 | 3.27% |
| PV3-11 | 12 | −4178.252836 | 0.00 | 19.94% |
| PV3-12 | 24 | −4178.252489 | 0.91 | 27.61% |
| PV3-13 | 8 | −4178.252723 | 0.30 | 11.79% |
| PV4-1 | 3 | −4181.841412 | 0.64 | 2.02% |
| PV4-2 | 24 | −4181.841570 | 0.22 | 18.45% |
| PV4-3 | 12 | −4181.838743 | 7.64 | 0.84% |
| PV4-4 | 12 | −4181.840840 | 2.14 | 4.97% |
| PV4-5 | 24 | −4181.840051 | 4.21 | 5.10% |
| PV4-6 | 24 | −4181.840735 | 2.41 | 9.10% |
| PV4-7 | 12 | −4181.838666 | 7.84 | 0.79% |
| PV4-8 | 12 | −4181.839336 | 6.09 | 1.39% |
| PV4-9 | 12 | −4181.838115 | 9.29 | 0.50% |
| PV4-10 | 24 | −4181.836417 | 13.75 | 0.24% |
| PV4-11 | 24 | −4181.839461 | 5.76 | 3.10% |
| PV4-12 | 24 | −4181.839199 | 6.45 | 2.48% |
| PV4-13 | 24 | −4181.839572 | 5.47 | 3.40% |
| PV4-14 | 24 | −4181.839066 | 6.79 | 2.22% |
| PV4-15 | 24 | −4181.839210 | 6.42 | 2.50% |
| PV4-16 | 24 | −4181.841071 | 1.53 | 12.10% |
| PV4-17 | 12 | −4181.837569 | 10.73 | 0.31% |
| PV4-18 | 6 | −4181.841654 | 0.00 | 4.95% |
| PV4-19 | 12 | −4181.839527 | 5.58 | 1.64% |
| PV4-20 | 12 | −4181.835532 | 16.07 | 0.06% |
| PV4-21 | 24 | −4181.837993 | 9.61 | 0.89% |
| PV4-22 | 6 | −4181.838319 | 8.76 | 0.29% |
| PV4-23 | 24 | −4181.839400 | 5.92 | 2.94% |
| PV4-24 | 24 | −4181.839155 | 6.56 | 2.39% |
| PV4-25 | 24 | −4181.839886 | 4.64 | 4.44% |
| PV4-26 | 24 | −4181.839881 | 4.66 | 4.42% |
| PV4-27 | 24 | −4181.840649 | 2.64 | 8.46% |
Degeneracy, Gibbs free energy, difference ΔG and fraction of each isomer in the series [SiVxW12−xO40](3+x)− 0 ≤ x ≤ 2.
| Label | Degeneracy | Gibbs free energy “G” (Hartree) | ΔG (kJ/mol) | Ratio |
| SiV0 | 1 | −4115.790187 | – | 100.00% |
| SiV1 | 12 | −4119.409442 | – | 100.00% |
| SiV2-1 | 12 | −4123.007288 | 10.43 | 1.67% |
| SiV2-2 | 12 | −4123.007311 | 10.37 | 1.70% |
| SiV2-3 | 12 | −4123.011262 | 0.00 | 48.13% |
| SiV2-4 | 24 | −4123.010444 | 2.15 | 48.16% |
| SiV2-5 | 6 | −4123.006254 | 13.15 | 0.35% |
Average free energy differences ΔG are rarely larger than 10 kJ/mol; they are much less in some cases. For isomers with approximately the same energy (accidental degeneracy), the essential degeneracy will govern the distribution, which means that the isomer of higher symmetry is the most abundant. On the other hand, isomers with large relative energy are unimportant to the distribution as the Boltzmann factor rules them out. This is quite evident from Tables 4 and 5.
It is worth noting that the calculated free energy range allows the existence of different species in equilibrium in the sample. The influence of the nature of the heteroatom is also apparent, and can be seen in the difference of abundance for XV2 for X = P, or Si (Fig. 3 and Fig. 4).
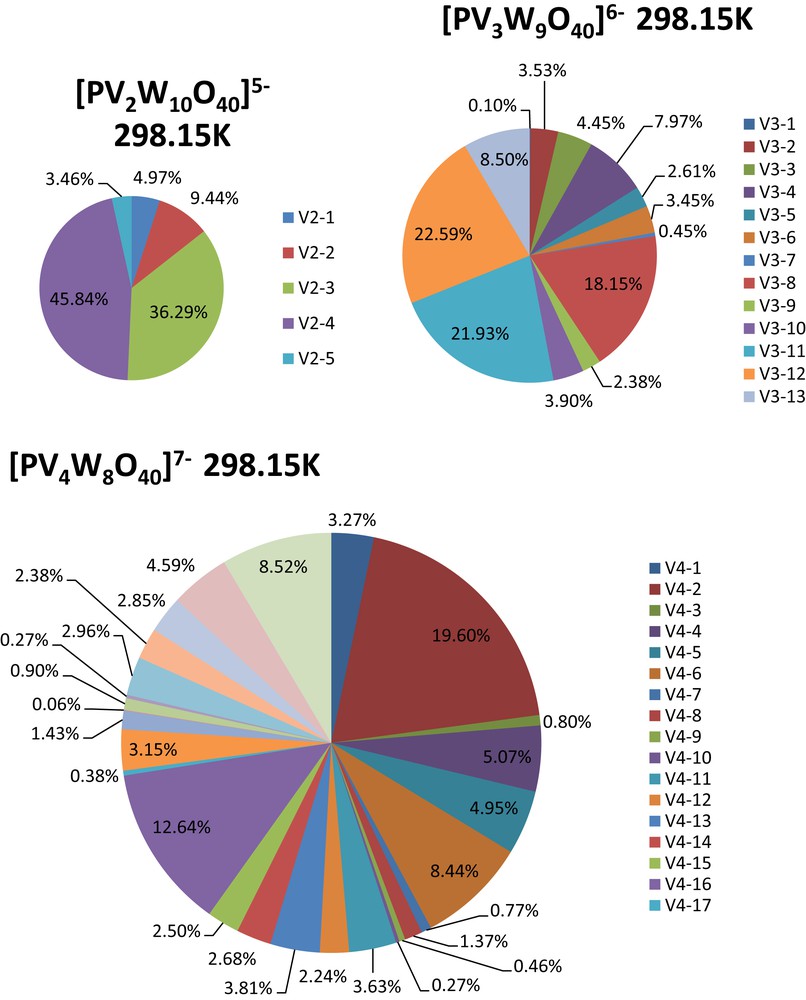
Boltzmann distribution of isomers calculated at 298.15 K. a) 5 isomer distribution for [PV2W10O40]5−. b) 13 isomer distribution for [PV3W9O40]6−. c) 27 isomer distribution for [PV4W8O40]7−.
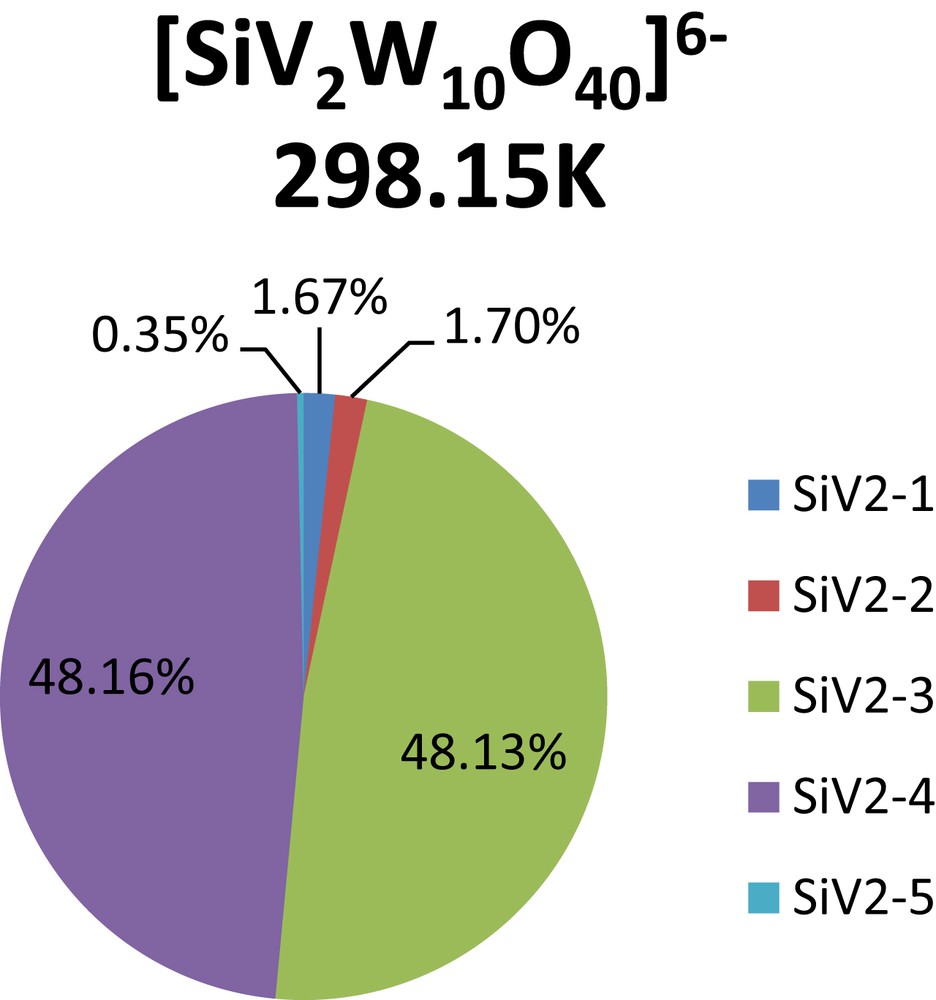
Boltzmann distribution of isomers calculated at 298.15 K. 5 isomer distribution for [SiV2W10O40]5−.
4.3 Coexistence of species with different degrees of substitution
The thermodynamic factor behind the experimentally suggested coexistence of species with different amounts of V substitution was investigated by the evaluation of hypothetical equilibrium reactions shown in Table 6.
Hypothetical reactions between species with different substitution degrees.
| n° | Reaction | ΔG (kJ/mol) |
| 1 | ½ PW12O403− + ½ PW10V2O405− → PW11VO404− | −20.17 |
| 2 | ⅔ PW12O403− + ⅓ PW9V3O406− → PW11VO404− | −38.64 |
| 3 | ¾ PW12O403− + ¼ PW8V4O407− → PW11VO404− | −57.19 |
| 4 | ½ PW11VO404− + ½ PW9V3O406− → PW10V2O405− | −17.62 |
| 5 | ⅓PW12O403− + ⅔PW9V3O406− → PW10V2O405− | −36.94 |
| 6 | ½ PW12O403− + ½ PW8V4O407− → PW10V2O405− | −74.03 |
| 7 | ⅔ PW11VO404− + ⅓ PW8V4O407− → PW10V2O405− | −35.91 |
| 8 | ½ PW10V2O405− + ½ PW8V4O407− → PW9V3O406− | −18.63 |
| 9 | ½ SiW12O404− + ½ SiW10V2O406− → SiW11VO405− | −23.60 |
For PV2, SiV2, PV3 and PV4, the calculated isomer proportion was used to obtain the general free energy as it is shown in Eq. 3.
| (3) |
Clearly, the homogeneous distribution of vanadium is thermodynamically favored for the nine reactions listed in Table 6. The obtained ΔG range is enough to assume the prevalence of the products. This result suggests that observed mixtures of species, if confirmed, are consequences of kinetically controlled processes rather than of thermodynamically controlled ones.
4.4 Isomer distribution and its influence on vibrational spectra
The presence of vanadium in [PVxW12−xO40](3+x) species leads to characteristic bands in the 1040–1150 cm−1 region of the IR spectrum, absent in the non-substituted species; Huang et al. suggested the existence of a relation between these band patterns and the number of vanadium atoms in the Keggin anion [35]. Theoretical IR spectra reproduce these extra bands, but show that isomers with the same amount of vanadium display substantially different band patterns in the mentioned region, suggesting that the spectra can be sensitive, not only to the number of substituent, but also to the isomer distribution (Fig. 5).
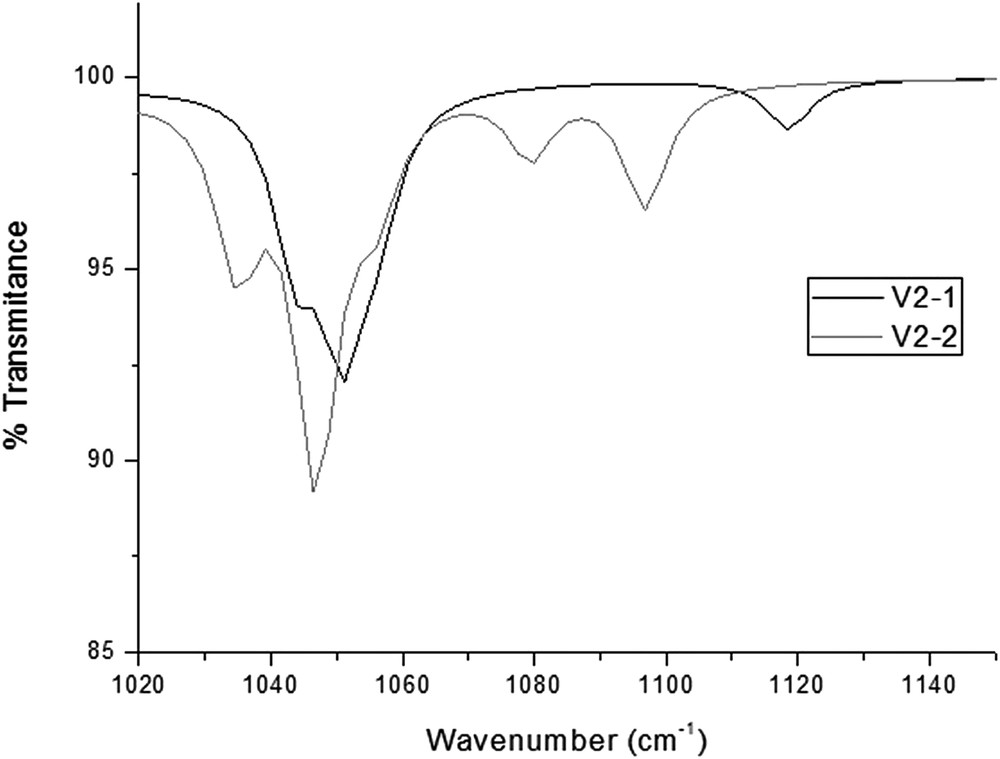
Different band patterns predicted in the 1040–1150 cm−1 region from 2 di-substituted isomers.
The data published by Huang et al. is worth comparing with experimental IR spectra of Keggin salts prepared in this work according to non-selective isomer routes. These authors used an in situ formed lacunary species in order to obtain specific α-1,2 and α-1,2,3 isomers for two and three V substituents, respectively [35]. Table 7 shows band wavenumbers for a series of Keggin anions IR spectra as reported in the literature. Characteristic bands used to corroborate the presence of vanadium are bold and underlined.
IR spectra for the series [PVnW12−nO40](3+n)− 0 ≤ n ≤ 3.
| Compound | Experimental frequencies (cm−1) |
| Na3[PW12O40]‧xH2Oa | 505; 522 (sh); 592; 805; 900; 922; 982; 995 (sh); (1081) |
| K3[PW12O40]‧xH2O | 526; 596; 808; 889; 984; 989 (sh); (1080); 1633; 3436 |
| K4[PVW11O40]b | 526; 601; 789; 885; 990; (1082; 1103)c; 1681 |
| K4[PVW11O40]‧xH2O | 516; 595; 783; 883; 982; (1062; 1078; 1099)d; 1171; 1622; 2337; 2770; 3413 |
| 1,2-K2H3[PV2W10O40]·2CH3OH‧7H2Ob | 509; 601; 792; 898; 966; (1062; 1079; 1100)e; 1637; 2925; 3481; 3741 |
| K5[PV2W10O40]‧xH2O | 501; 528; 596; 785; 876; 966; (1060; 1080; 1097)e; 1296; 1622; 3426 |
| 1,2,3-K6PV3W9O40b | 526; 625; 796; 871; 960; (1059; 1089)f; 1625 |
| K6[PV3W9O40]‧xH2O | 501; 596; 787; 879; 956; 985 (sh); (1053; 1074; 1101)g; 1620; 3390 |
Fig. 6 shows the experimental IR spectra collected for some of the salts prepared in this work. Vanadium substitution clearly results in the splitting of the phosphate band at 1080 cm−1. While PV1 displays two bands and a shoulder, samples with up to four vanadium atoms per Keggin ion present three bands with a similar shape. The data suggests a slight broadening of the pattern with increasing vanadium content so that we may assume that the shoulder in the first (PV1) spectrum comes from a weak separation of the three bands. None of the spectra could be attributed to a pure isomer; it is also worth noting that the same band patterns were obtained for samples synthesized according to different routes, suggesting that the isomer distribution might be independent of the in situ formation of the lacunary anion during the synthesis.
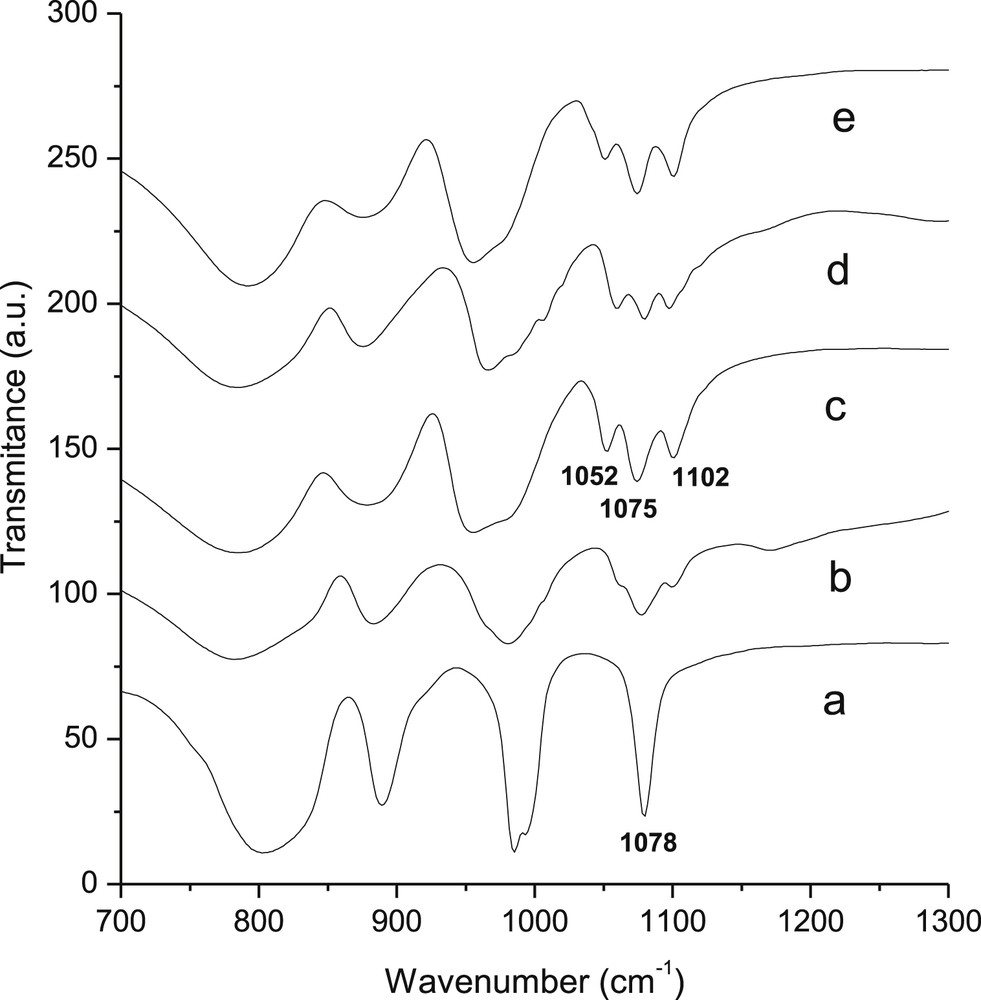
Infrared spectra of compounds prepared in this work: (a) K3PW12O40, (b) K4PW11V1O40, (c) K5PW10V2O40, (d) K6PW9V3O40 and (e) K7PW8V4O40.
Raman spectroscopic data were obtained, both experimentally and theoretically for both Si and P series. The theoretical spectra display characteristic extra bands in the 1040–1100 cm−1 region when vanadium is present in the anion, but these bands are not observed in the experimental spectra. The presence of V in the ions seems to produce nothing but larger bands in the experimental Raman spectra. The predicted extra bands, somehow, must be overlapping the main band or are subjected to displacement effects not included in the calculations. Fig. 7 shows the experimental and the theoretical spectra for the SiV0 and SiV1 species. The same considerations hold in the case of SiV2 and SiV3, as well as for all vanadium substituted species with P as the heteroatom.
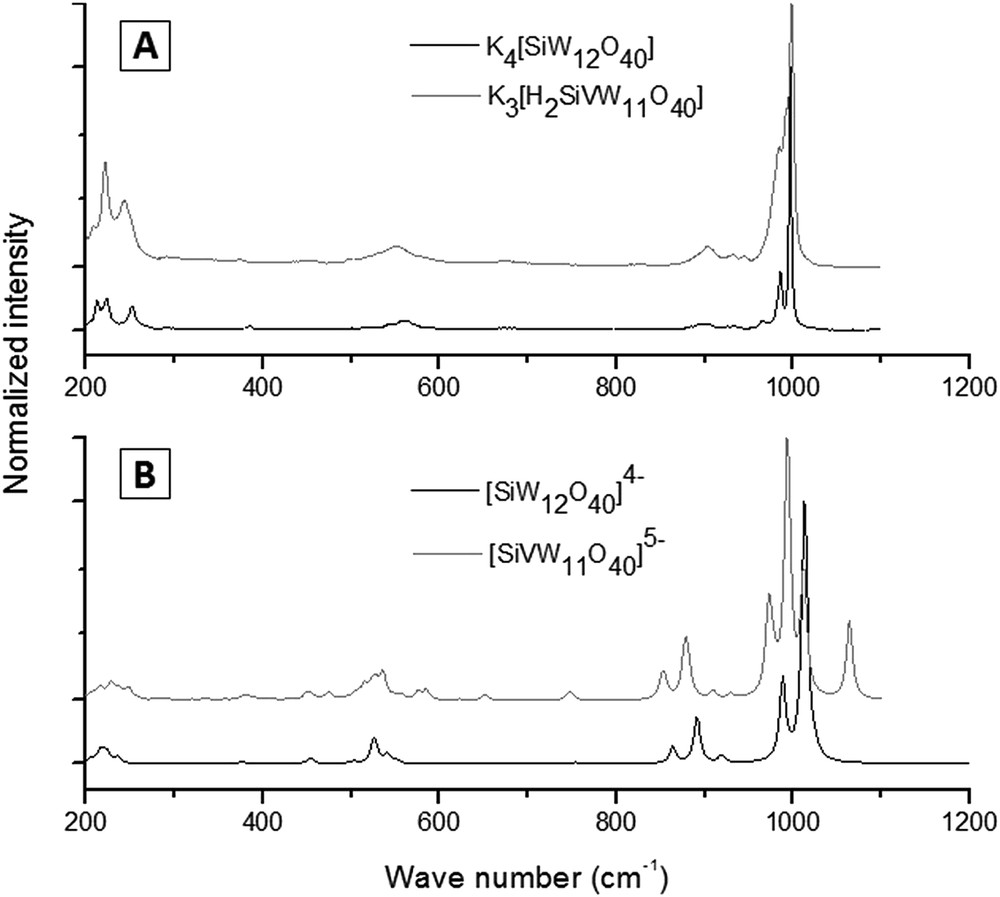
Raman spectra for V0 and V1 species. A: experimental Raman spectra for K4[SiW12O40] (black), and K3[H2SiVW11O40] (grey); B: theoretical spectra for the anions [SiW12O40]4− (black) and [SiVW12O40]5− (grey).
It can be seen from the calculations that the main peak in Raman spectra of V0 species comes from a breathing mode involving all the external oxygen atoms. When one vanadium is added to the structure, the VO bond stretching moves in the opposite phase with all WO stretching in the correspondent mode. The predicted extra mode is mainly a displacement of the lighter V atom and a VO stretching.
The theoretical Raman spectrum of the V1 species was also determined using the M062X functional to evaluate the dependence of the V extra bands on the calculation method. Despite a discrete shift of the band, the V displacement mode was equally predicted. Further investigation is thus necessary to rationalize the absence of this characteristic band in the experimental spectra.
5 Conclusions
Two series of Keggin tungstovanadates were satisfactorily synthesized and analyzed by infrared and Raman spectroscopy. DFT geometry optimization was performed and vibrational spectra were obtained for the 54 possible isomers of the series; all the calculated geometries correspond to a stable structure as none generates imaginary frequencies in the calculated vibrational spectra.
The theoretical calculations for geometry and infrared spectra are in good agreement with the experimental data, and the inclusion of solvent effects via PCM has improved the results. Calculated Raman spectra are in overall agreement but do not fully match the experimental data, insofar as specific bands due to V substitution are predicted but not experimentally observed.
Free Gibbs energy for all the studied series indicates that homogeneous distribution of vanadium is the most stable state. Among the isomers with a given number of V, a thermodynamic favorable distribution is proposed based on a Boltzmann distribution.
Calculated vibrational spectra could be useful to discuss the presence of specific isomers, but uncertainty on the position and intensity of the peaks still prevents definite conclusions; however, different isomer distributions are clearly predicted to display substantially different band patterns. The fact that similar spectra are observed for vanadium-substituted Keggin ions prepared from specific and non-specific isomer synthetic routes raises the issue of the influence of the synthetic route upon the isomer distribution.
Acknowledgements
We thank CNPq (Conselho Nacional de desenvolvimento Científico e Tecnológico, 303367/2014-8) and CAPES (Coordenação de Aperfeiçoamento de Pessoal de Nível Superior) for funding this research.
Appendix A Supplementary data
The following are the supplementary data related to this article: