

1 Introduction
SrTiO3 is one of the promising perovskite structured metal oxides that can be used as a photocatalyst for water splitting and photocatalytic degradation under UV light [1–6]. Scientists all over the world shifted to cost effective visible light radiation rather than UV light. One of the most effective methods to shift the absorption to the visible light region is SrTiO3 doping [7–9]. Undoped and doped SrTiO3 can be prepared by several methods such as the classical solid state method [10], co-precipitation method [11], Pechini method [12], solvothermal method [6] and the citric acid gel method [13].
The Pechini method is a wet-chemical method based on a polymeric precursor [14] where various ceramic powders can be synthesized by this method [15–18]. In the Pechini method, citric acid (α-hydroxyacid) is used to chelate the cations forming a polybasic acid. Ethylene glycol (polyhydroxy alcohol) reacts with these chelates, forming ester and water. Heating of the mixture leads to polyesterification and after the evolution of nitrous oxide and water, a rigid gel is obtained. The thermal decomposition of this rigid gel results in a chemically homogeneous powder containing the desired stoichiometry [19,20].
The citric acid gel method is an easy way of obtaining precursors without large quantities of organic solvents. This method is used to prepare Ba1−xSrxTiO3 [12]. In this method [12,21], metal cations react with carboxylate ligands to form metal carboxylate complexes. Then the metal carboxylate gel is formed by crosslinking metal carboxylate complexes into a three-dimensional structure. The final powder is obtained by the decomposition of the precursor gel at a moderate temperature. To obtain a clear gel with no precipitation, the most important factors that have to be considered are the pH value of the initial solution and the citric acid to metal ratio [22].
Dibutyl phthalate (DBP) is one of the phthalic acid diethers that are used as plasticizers to improve the mechanical properties of the plastic resin, in particular its flexibility. It may be released from the plastic products and leak into the environment. It can be identified in river water, ocean water, soil, lake sediment, and municipal solid waste. Some of the phthalic acid diethers could cause cancer. The United States Environmental Protection Agency and China National Environmental Monitoring Center have classified most phthalic acid diethers as priority pollutants and endocrine-disrupting compounds [23]. Recently, the removal of DBP has received increasing attention because of its toxicity and high bioaccumulation rate. One of the promising methods used for the degradation of the organic pollutants is heterogeneous photocatalysis.
To the best of our knowledge, the effect of the preparation method, Bi doping and Bi, Cu co-doping of SrTiO3, on its structural and microstructural properties and on the photocatalytic degradation of dibutyl phthalate has not been studied so far. The present work signifies the preparation of nanosized undoped, Bi-doped and Bi, Cu co-doped SrTiO3 by two sol–gel methods to optimize the structural and microstructural properties and the band gap for obtaining good photocatalytic degradation of dibutyl phthalate in visible light.
2 Experimental
2.1 Samples preparation
Nanocrystalline undoped, Bi-doped and Bi, Cu co-doped SrTiO3 samples were prepared by using two sol–gel methods (the citric acid gel method (C) and the Pechini method (P)).
2.2 The citric acid gel method
SrTiO3 (STC), Sr0.95Bi0.05TiO3 (BiC) and Sr0.975Bi0.025Ti0.975Cu0.025O3 (BiCuC) powder samples were synthesized by a complex route precursor according to Wang et al. [13]. Sr(NO3)2, tetra-n-butyl titanate Ti(n-OC4H9)4, Bi(NO3)3·5H2O, Cu(NO3)2·3H2O, ammonia solution (25–28 wt. % in H2O), citric acid, H2O2 (30 wt. % in H2O), 65% HNO3 were used as the starting materials. All chemicals were of reagent grade and used as received.
SrTiO3 nanopowder was prepared as follows: 5.6 ml Ti(n-OC4H9)4 was added to stirred deionized water. A white precipitate was observed. This precipitate was filtered and washed several times with deionized water. 6.28 g of citric acid was dissolved in distilled water. The precipitate was added to the citric acid solution with a molar ratio of CA:M=2:1 (CA = citric acid and M = Ti) with stirring. 1 ml of H2O2 was then added and the pH value of the solution was adjusted to six using ammonia solution. The prepared yellow solution of Ti(IV) was stirred and refluxed at 60 °C. This solution is called solution (I). 3.46 g Sr(NO3)2 was dissolved in distilled water; 6.28 g citric acid was added to Sr(NO3)2 solution in a molar ratio of CA:M=4:1 (M = Sr) and pH was adjusted to six using ammonia solution. This solution is called solution (II). Solution (I) was then mixed with solution (II) and the resulting mixture was refluxed at 60 °C for 2 h with continuous stirring. The precursor solution was heated at 90 °C in a water bath with stirring until a gel is formed. The obtained gel was charred up to 300 °C gradually then ground and calcined at 500 °C for 2 h and finally calcined at 800 °C for 3 h. BiC and BiCuC powder samples were prepared by the same method. In the preparation of BiC sample, 5.4 ml of Ti(n-OC4H9)4 and 6.08 g of citric acid were used in solution I. In solution II, 0.38 g of Bi(NO3)3·5H2O was dissolved in 10% HNO3, 3.18 g of Sr(NO3)2 was dissolved in distilled water, 6.08 g of citric acid, and solutions of Bi(NO3)3·5H2O and Sr(NO3)2 were used. In the case of the preparation of the BiCuC sample, 5.38 ml of Ti(n-OC4H9)4 and 6.01 g of citric acid were used in solution I, whereas in solution II, 6.01 g of citric acid, 3.31 g of Sr(NO3)2 dissolved in distilled water, 0.19 g of Bi(NO3)3·5H2O dissolved in 10% HNO3 and 0.1 g of Cu(NO3)2·3H2O dissolved in distilled water were used.
2.3 Pechini method
SrTiO3 (STP), Sr0.95Bi0.05TiO3 (BiP) and Sr0.975Bi0.025Ti0.975Cu0.025O3 (BiCuP) powder samples were prepared according to the method of Chang et al. [12]. Sr(NO3)2, tetra-n-butyl titanate Ti(n-OC4H9)4, Bi(NO3)3·5H2O, Cu(NO3)2·3H2O, citric acid, ethylene glycol, and 65% HNO3 were used as the starting materials. All chemicals were of reagent grade and were used as received.
In this method, SrTiO3 was prepared as follows: tetra butyl titanate was added, as per Table 1, to ethylene glycol (EG) with stirring and the solution was heated at 60 °C, and then, citric acid (CA) was added to the solution. The molar ratio of CA to total metal cations was 2:1 and the molar ratio of CA to EG was 1:2.5. When the solution became clear, Sr(NO3)2 was added. After about half an hour, the solution was heated at 80 °C until a gel was formed. The gel was charred up to 300 °C gradually then ground, calcined at 500 °C for 2 h then ground, finally, calcined at 800 °C for 9 h. BiP and CuBiP samples were prepared using the same method. Bi(NO3)3·5H2O was dissolved in 10% HNO3 in the preparation of the BiP sample. In the preparation of the CuBiP sample, Bi(NO3)3·5H2O was dissolved in 10% HNO3 and Cu(NO3)2·3H2O was used. In this method, only Bi(NO3)3·5H2O was dissolved in 10% HNO3 whereas citric acid, Sr(NO3)2 and Cu(NO3)2·3H2O were used as solids, without dissolving them in water before addition as mentioned in Ref. [12] of Chang et al. Table (1) presents the amounts of chemicals used in the Pechini method.
The amounts of chemicals used in the Pechini method.
| Chemicals | STP | BiP | CuBiP |
| Tetra butyl titanate | 5.6 ml | 5.4 ml | 5.38 ml |
| Ethylene glycol | 9 ml | 8.8 ml | 8.96 ml |
| Citric acid | 12.57 g | 12.16 g | 12.33 g |
| Sr(NO3)2 | 3.46 g | 3.18 g | 3.31 g |
| Bi(NO3)3·5H2O | – | 0.38 g | 0.19 g |
| Cu(NO3)2·3H2O | – | – | 0.1 g |
2.4 Characterization
For all the prepared samples from the two methods of preparation, the crystal structure was detected using X-ray diffraction (XRD). The XRD measurements were carried out using an Empyrean diffractometer equipped with Cu radiation CuKα (λ=1.54056 Å). The scanning range was 5–80° (2θ) with a step size of 0.2 (2θ). The lattice parameters were calculated using a program called unit cell [24]. The microstructures were observed by transmission electron microscopy (TEM, JEOl JEM2100). The band gap was determined from diffuse reflectance measurements (spectrophotometer, Jasco V-570).
2.5 Photocatalytic activity
A slurry mode batch reactor equipped with a cooling jacket was used for photocatalytic degradation experiments. All reaction components were mixed vigorously throughout the experiments. The light source used was a commercially available visible metal halide lamp (HQI-T 250/Daylight, OSRAM GmbH, Germany) with a luminous efficacy of 82 lm/W and luminous flux of irradiation 20,000 lm. 10 ml samples were withdrawn from the reaction suspension at given time intervals then separated from the photocatalysts by centrifugation.
2.6 Analysis
A total organic carbon (TOC) analyzer (Torch-Teledyne Tekmar) with 99.9% accuracy was used for the determination of DBP as TOC content. Also, chemical analysis of the prepared catalyst was performed by using an ICP-OES 5100 manufactured by Agilent.
3 Results and discussion
First, the chemical composition of the prepared samples was determined by ICP-MS to check the elemental composition of Sr, Ti, Cu and Bi. The results in Table 2 show that the experimental weight percentages of all elements match the expected weight percentages.
The composition determined by ICP-MS compared to the expected composition of the prepared samples.
| Samples | Expected (weight %) | Experimental (weight %) | ||||||
| Sr | Ti | Cu | Bi | Sr | Ti | Cu | Bi | |
| BiC | 43.9 | 25.3 | 0 | 5.5 | 43.95 | 25.40 | 0 | 5.61 |
| CuBiC | 45.7 | 25.0 | 0.85 | 2.8 | 45.82 | 25.07 | 0.87 | 2.87 |
| BiP | 43.9 | 25.3 | 0 | 5.5 | 44.01 | 25.38 | 0 | 5.54 |
| CuBiP | 45.7 | 25.0 | 0.85 | 2.8 | 45.79 | 24.91 | 0.87 | 2.88 |
To detect the crystal structure of the prepared samples and to understand the effect of doping on the structural properties of SrTiO3, X-ray diffraction (XRD) was performed. Fig. 1 shows XRD patterns of the samples prepared by the citric acid gel method. Fig. 1 shows that the undoped SrTiO3 sample (STC) has the perovskite-like phase structure (cubic phase, JCPDS 01-089-4934). For Bi-doped SrTiO3 sample (BiC), it is clear that this sample has a cubic phase structure (JCPDS 01-089-4934). XRD peak intensity for the BiC sample is higher than that of the STC sample. For the BiC sample, the XRD peaks are shifted slightly to lower θ values and the peak broadening (FWHM) of this sample is lower than that of the STC sample. The peak positions characteristic of the cubic perovskite-like phase were detected for Bi and Cu co-doped SrTiO3 sample (BiCuC) (JCPDS 01-089-4934) (Fig. 1). There is a slight shift of the peaks towards lower θ values as compared to those of the STC sample. The peaks intensity of this sample is higher than that of STC sample. Moreover, the peak broadening (FWHM) of this sample is smaller than that of the STC sample.
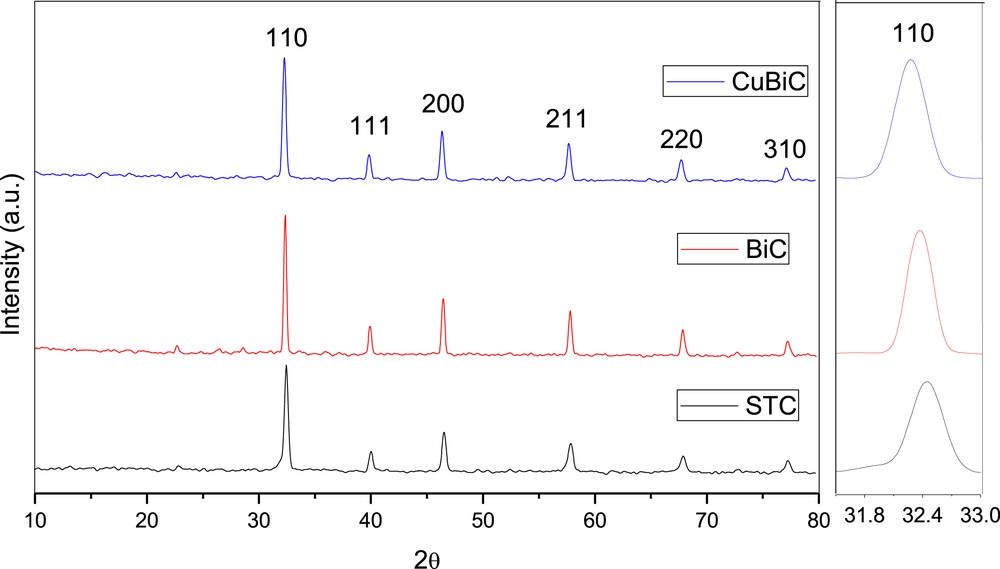
X-ray diffraction patterns of the samples prepared by the citric acid gel method and calcined at 800 °C/3 h. The right Fig. represents the 110 peak expansion.
The cubic lattice parameter and unit cell volume for all the prepared samples are calculated from the XRD patterns and presented in Table 3. The cubic lattice parameter and unit cell volume for the BiC sample are slightly higher than those of STC sample. This might be due to the fact that Bi3+ ions (ionic radius: 1.03 pm [25]) did not substitute the Sr2+ ions (ionic radius: 1.18 pm [25]) but it might substitute the Ti4+ ions (ionic radius: 0.605 pm [25]). For the BiCuC sample, these values are also higher than those of the STC sample. This might be due to the fact that Bi3+ ions (ionic radius: 1.03 pm) did not substitute the Sr2+ ions (ionic radius: 1.18 pm) but it might instead, substitute the Ti4+ ions (ionic radius: 0.605 pm). Also, the Cu2+ ions (ionic radius: 0.73 pm [25]) might substitute the Ti4+ ions (ionic radius: 0.605 pm). However, Yu et al. [26] found that for Cr-doped SrTiO3; the Cr3+ ions is incorporated into the Sr2+ sites, not into the Ti4+ sites in the SrTiO3 lattice.
The cubic lattice parameter and unit cell volume of the samples prepared by the citric acid gel and the Pechini methods.
| Sample | Cubic phase | |
| a (Å) | V (Å3) | |
| STC | 3.90272 | 59.4434 |
| BiC | 3.90824 | 59.6958 |
| CuBiC | 3.91416 | 59.9674 |
| STP | 3.90835 | 59.7007 |
| BiP | 3.90902 | 59.7314 |
| CuBiP | 3.91055 | 59.8018 |
The crystal structure of all the samples prepared by the Pechini method (P) was detected by XRD. Fig. 2 shows the XRD patterns of the STP sample calcined at 800 °C for 3 h. A mixture of two tetragonal phases was detected, one tetragonal phase for SrTiO2.6 (JCPDS No. 98-006-9776) and another tetragonal phase for Sr2TiO4 (JCPDS No. 98-002-0293). Fig. 3 shows that the STP sample calcined at 800 °C for 9 h has a mixture of three phases. The predominant phase is the cubic phase of SrTiO3 (JCPDS No. 01-089-4934). The remaining phases are the tetragonal phase of Sr2TiO4 (JCPDS No. 98-002-0293) and the tetragonal phase of Sr3Ti2O7 (JCPDS No. 01-076-0740).

X-ray diffraction pattern of the STP sample prepared by the Pechini method and calcined at 800 °C/3 h, obtained at room temperature.
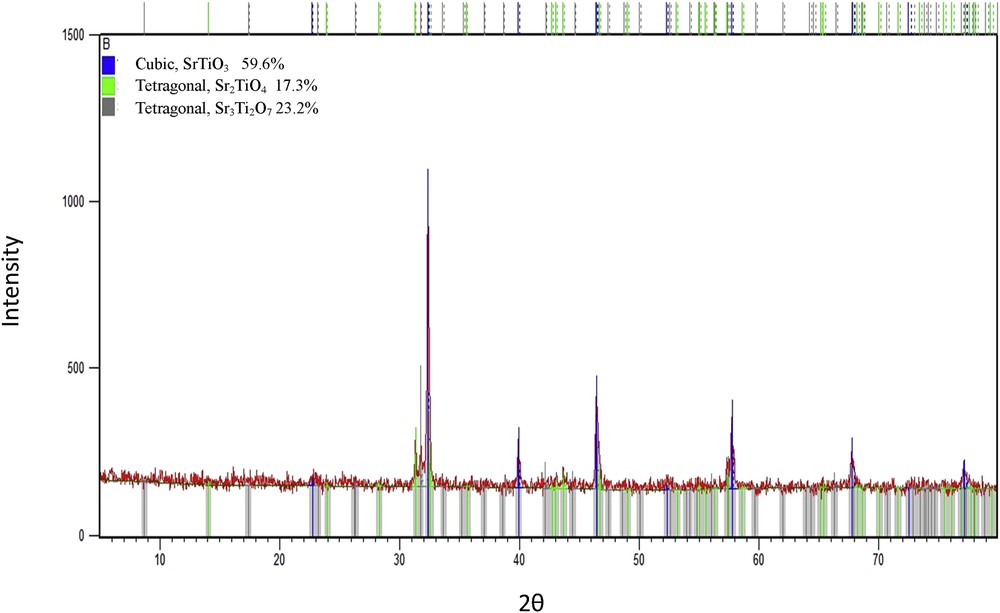
X-ray diffraction pattern of STP sample prepared by the Pechini method and calcined at 800 °C/9 h, obtained at room temperature.
Fig. 4 shows the XRD patterns of STP, BiP and BiC samples that were calcined at 800 °C for 9 h. In regards to BiP and BiC samples, the XRD patterns can be indexed to cubic phase characteristic of SrTiO3 (JCPDS No. 01-089-4934). The intensity of BiP sample peaks is higher than that of STP sample, whereas the intensity of the BiCuP sample is smaller than that of the STP sample. The full width at half maximum intensity (FWHM) of the BiP sample is smaller than that of the STP sample. The FWHM of the BiCuP sample and STP sample is nearly equal. Table 3 presents the calculated cubic lattice parameter and unit cell volume for STP, BiP, and CuBiP samples. It is clear that both doping and co-doping of SrTiO3 slightly increased both the cubic lattice parameter and unit cell volume, although it was expected that for the BiP sample, both the cubic lattice parameter and unit cell volume would decrease because the ionic radius of Bi3+ ions is smaller than that of Sr2+ ions. Increasing the lattice parameter and unit cell volume might be due to the fact that Bi3+ ions might be incorporated into Ti4+ sites in the SrTiO3 lattice. In regards of BiCuP sample, both Bi3+ ions and Cu2+ ions might be incorporated into Ti4+ sites in the SrTiO3 lattice.
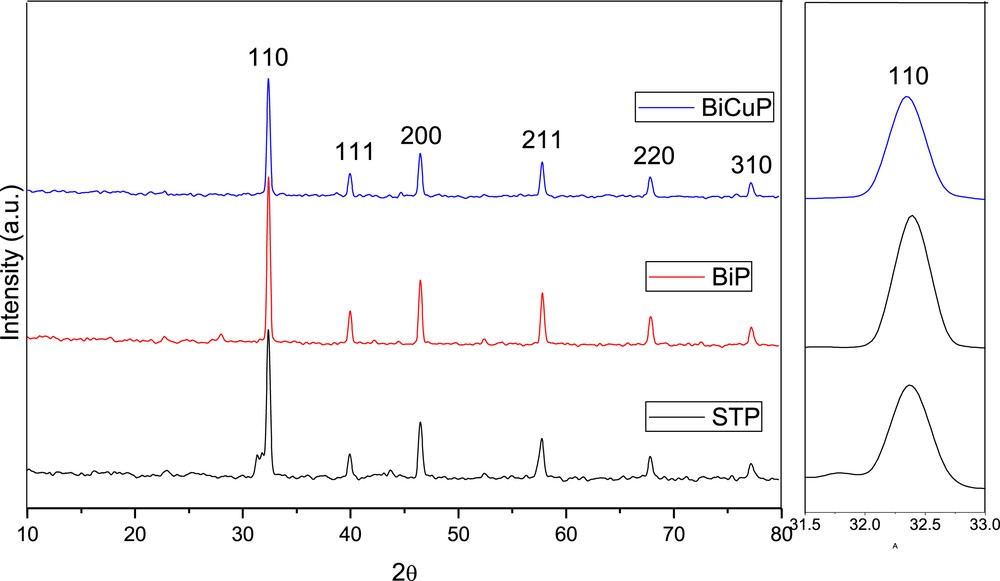
X-ray diffraction patterns of the samples prepared by the Pechini method and calcined at 800 °C/9 h. The right Fig. represents the 110 peak expansion.
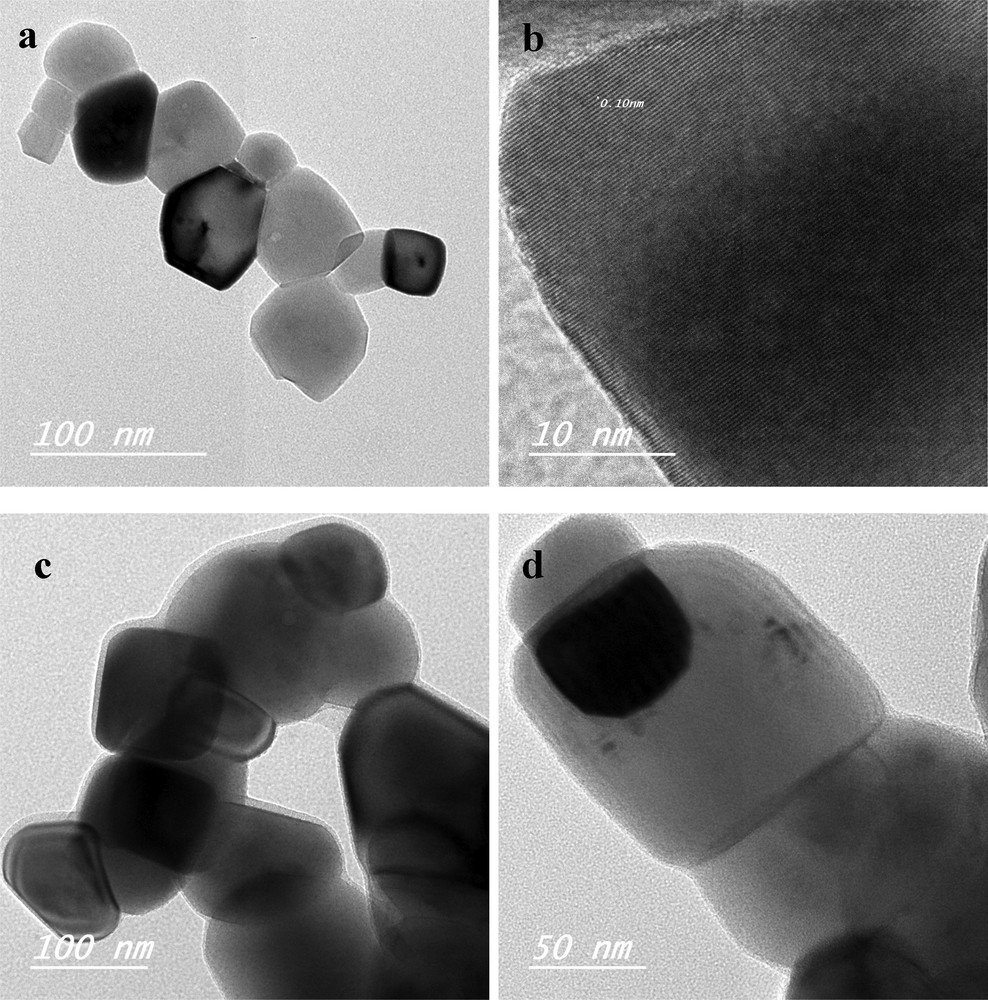
BiC, BiCuC, BiP and BiCuP sample morphologies were investigated using TEM. It is clear from Fig. 5a that BiC particles have a regular shape with a size between 10 and 23 nm. Higher magnification shows fringe spacings of about 0.11 nm, which could correspond to the 110 crystal plane of SrTiO3 (Fig. 5b). Fig. 5c and d show that BiCuC particles have an irregular shape with a size between 32 and 150 nm and there is agglomeration. The increase in particle size with respect to the BiC particles could be attributed to the Cu-doping.

TEM images of a) the BiC sample, b) BiC sample with higher magnification, c) and d) BiCuC samples prepared by the citric acid gel method.
Fig. 6a shows that the BiP particles have an irregular shape with a size between 25 and 58 nm, and that the particles are agglomerated. Fringe spacings of about 0.10 nm, which could be identified with the 110 crystal plane of SrTiO3 were detected (Fig. 6b). Larger particles (with a size between 68 and 153 nm) with much agglomeration were observed for the BiCuP sample (Fig. 6c and d). Also, the Cu-doping of SrTiO3 increased the particle size.
TEM images of a) the BiP sample, b) BiP sample with higher magnification, c) and d) BiCuP samples prepared by the Pechini method.
For the determination of the band gap for all the prepared samples, diffuse reflectance spectra were obtained using a UV–Vis spectrophotometer and then transformed to the absorption spectra according to the Kubelka–Munk relationship. Fig. 7a and b show the absorption spectra of the citric acid gel method samples and Pechini method samples. The inset shows the plots of F(R∞)E1/2 versus photo energy for the estimation of the band gap energy of the prepared photocatalysts. From Fig. 7a, it is apparent that the undoped SrTiO3 sample (STC) shows an absorption edge at 392 nm (band gap = 3.16 eV). Doping SrTiO3 with 5 mol% of Bi decreased the absorption edge to 525 nm (band gap = 2.36 eV). Moreover, with the co-doping of SrTiO3 with 2.5 mol% Bi and 2.5 mol% Cu (BiCuC sample), both the absorption edge and band gap decreased to 696 nm and 1.78 eV, respectively.
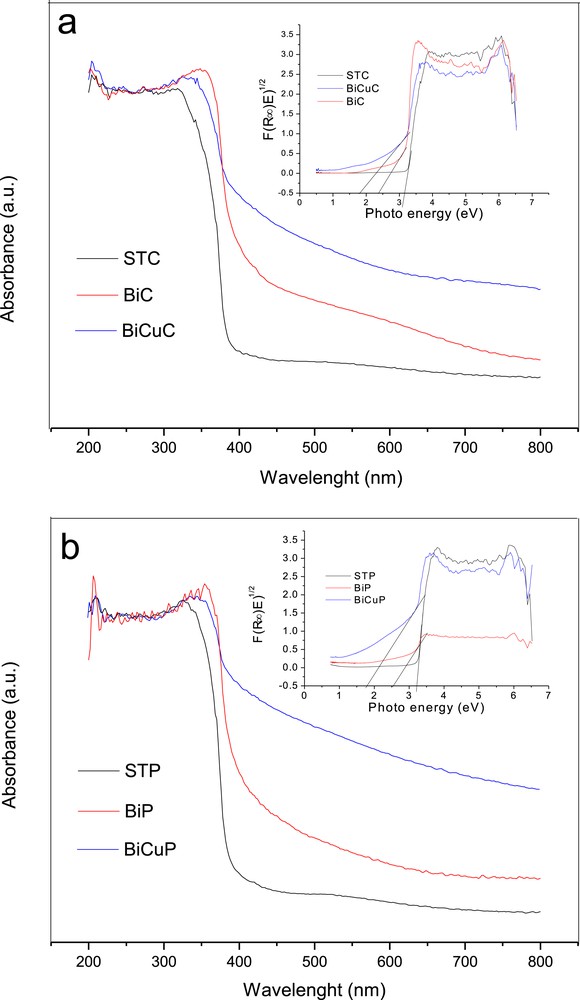
The band gap of samples prepared by a) the citric acid gel method and b) the Pechini method. The inset shows the plots of F(R∞)E1/2 vs photo energy for the estimation of the band gap energy of the prepared photocatalysts.
In respect of the samples prepared by the Pechini method (Fig. 7b), the absorption edge is located at about 385 nm (band gap = 3.22 eV) for the STP sample, at about 472 nm (band gap = 2.6 eV) for the BiP sample and at about 820 nm (band gap = 1.78 eV) for BiCuP.
It is clear that for samples obtained from both preparation methods, Bi doping and Bi, Cu co-doping of SrTiO3 increased the visible light absorption effectively. The red shift of the absorption edge might be due to the reduction in the band gap value that might be attributed to new energy states introduced by Bi3+ ions and also Cu2+ ions between the valence and conduction bands (Fig. 8).
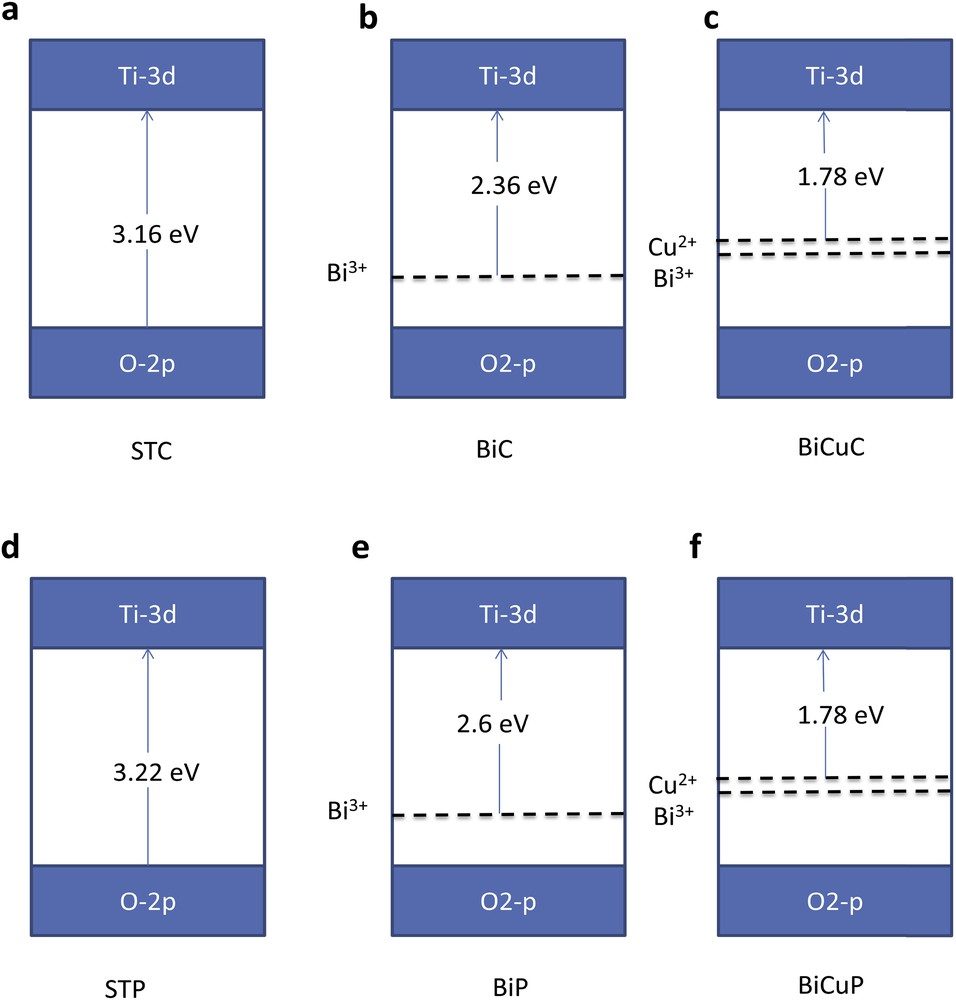
Schematic illustration of the calculated band gap and new energy levels introduced by the dopants for a) STC, b) BiC, C) BiCuC, d) STP, e) BiP and f) BiCuP samples.
The SrTi1−xFe[x/2]Cr[x/2]O3 system was studied by Jeong et al. [1]. It was indicated from the DRS that the band gap was reduced by the co-doping of SrTiO3 with Fe and Cr. Moreover, the partially filled Fe/Cr 3d band is located below the conduction band. The electrons in Fe 3d and Cr 3d new bands are excited to the conduction band when phonons with a wavelength larger than 420 nm were used for illumination.
From both preparation methods, it was found that the perovskite-like phase structure (cubic phase) was obtained at 800 °C with a shorter calcination time (3 h) than that of samples prepared by the Pechini method (9 h). The cubic lattice parameter for the samples prepared by the citric acid method is slightly higher than that of the samples prepared by the Pechini method. The particle size of the samples prepared by the citric acid method is smaller than that obtained by the Pechini method. There is no noticeable difference in the band gap value of the samples prepared by either method.
3.1 TOC removal of DBP under visible light
The photocatalytic activities of BiC, BiCuC, BiP and BiCuP were examined by studying the TOC removal of DBP at an initial concentration of 10 mg/L DBP, pH 8 and a catalyst dose of 1.00 g/L. The results in Fig. 9, obtained under visible light illumination show a higher TOC removal for Cu doped samples (BiCuP and BiCuC) compared with the undoped ones (BiC and BiP). This can be attributed to a lower band gap energy of BiCuC and BiCuP (1.78 eV for each) compared with band gap energy of BiC and BiP (2.6 eV and 2.36 eV, respectively).
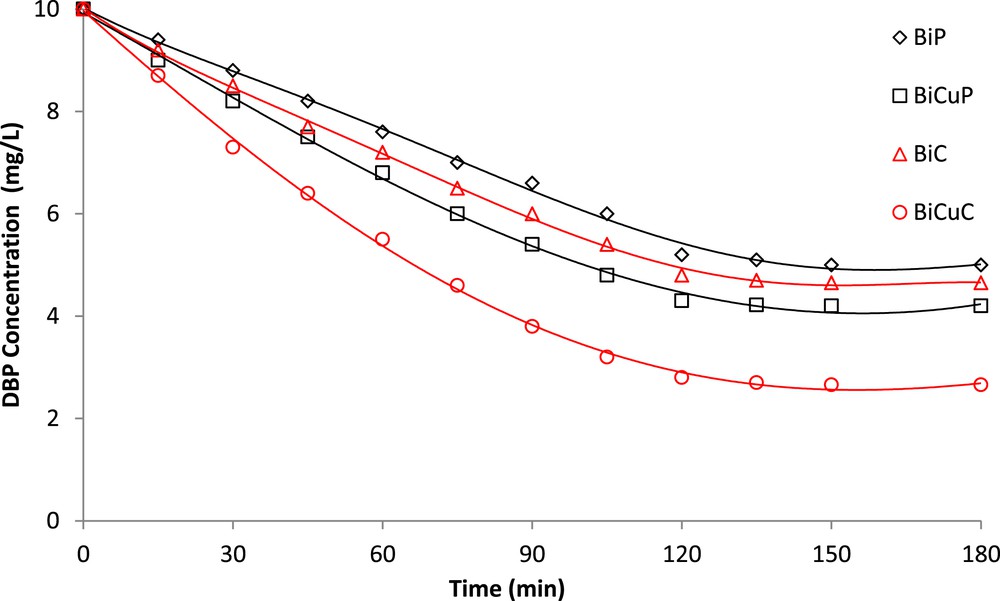
TOC removal of DBP for Bi doped and Bi, Cu co-doped SrTiO3 as a function of time under visible light.
The Bi, Cu co-doped SrTiO3 sample (BiCuC) prepared by the citric acid gel method shows higher TOC removal of DBP than that of Bi, Cu co-doped SrTiO3 samples prepared by the Pechini method (BiCuP). This may be attributed to the smaller particle size of the BiCuC sample compared to that of BiCuP sample, which leads to a higher surface area that causes an increase in the adsorption rate during photocatalytic experiments.
Cu, Bi co-doped samples showed a higher TOC removal than the solely Bi doped samples, both of which in turn showed a TOC removal higher than that of the naked STC samples. This can be attributed to the introduction of new Bi and Cu levels that can be used as intermediate stages between the conduction and valence bands of STC as mentioned previously. Accordingly, narrower band gaps than those of naked STC are obtained, which increase the absorption in the visible light region [27]. Subsequently, departed electrons and migrated holes can react with adsorbed oxygen and hydrogen peroxide, respectively, on the surface of the catalyst, forming O2and OH, which are responsible for the removal of DBP [28].
Finally, the order of photocatalyst activity according to the TOC removal of DBP is in the following sequence: BiCuC > BiCuP > BiC > BiP.
TOC removal for DBP followed pseudo-first order kinetics according to Eq. 1, as shown in Fig. 10, which indicates a linear relationship between Ln Ct/C0 versus time:
| (1) |
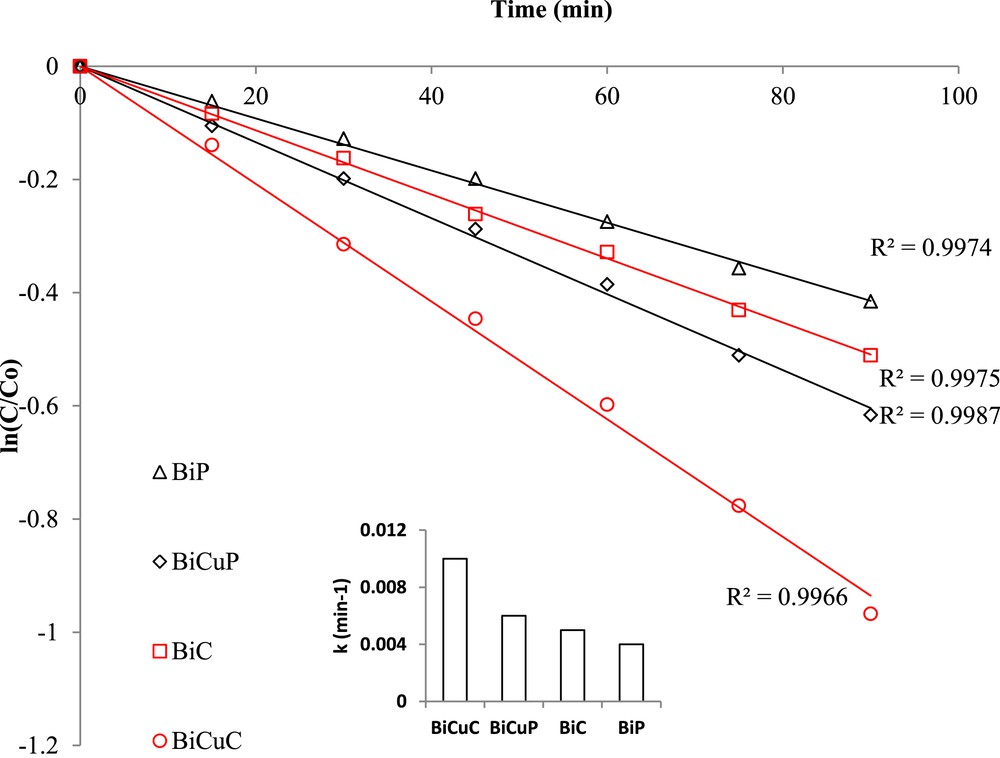
Pseudo-first order kinetics for the TOC removal of DBP for Bi doped and Bi, Cu co-doped SrTiO3.
4 Conclusion
Nano-sized undoped, Bi doped and Bi, Cu co-doped SrTiO3 samples were prepared by two sol–gel methods (the citric acid gel and the Pechini methods). From the XRD measurements, the perovskite-like phase structure was detected after calcinations at 800 °C. The time required for obtaining this phase was shorter for samples prepared by the citric acid gel method than that of samples prepared by the Pechini method. The photocatalytic activity results demonstrate that the photocatalytic degradation of nano-sized Bi, Cu co-doped SrTiO3 samples is higher than that of Bi doped SrTiO3 samples, regardless of the preparation method. The improved photocatalytic activities of these samples might be due to the small band gap of these samples. Bi, Cu co-doped SrTiO3 samples prepared by the citric acid gel method were found to have the best photocatalytic activity for the TOC removal of dibutyl phthalate. Therefore, from the ongoing research, it can be concluded that Bi, Cu co-doped SrTiO3 prepared by the citric acid method is a promising photocatalyst material for environmental applications.