

1 Introduction
Nowadays, environmentally friendly energy sources are very important because fossil fuel resources are dwindling rapidly and the environment is being polluted by increased industrial emissions. From this point of view, the hydrogen economy has a good chance for expansion and, in the future, can replace traditional fossil fuel energy. Hydrogen is a natural, renewable energy source, which is widely available in the world in the form of many commonly occurring chemicals (including biomass, biogas, natural gas or hydrocarbons). On an industrial scale, hydrogen is currently produced by the methane steam reforming method (SMR) [1–6], but methanol is also widely considered by researchers as a hydrogen resource [7–11]. The advantages of using methanol instead of methane are its availability, relatively low toxicity and ease of storage, transport and usage [12]. The production of hydrogen generally requires chemical reactions carried out at an elevated temperature and suitable catalysts, depending on the source of hydrogen [13]. Traditionally, in thermocatalytic decomposition reactions, transition metals from group VIII of the periodic table of elements are used as catalysts (e.g., Ni, Fe, and Co) [14–18]. Ni-based catalysts exhibit extremely high catalytic activity in methanol decomposition and promote the production of carbon nanostructures (mainly carbon nanotubes) [19]. This can be considered a disadvantage (because of the gradual “poisoning” of catalysts) or as an advantage (because of the production of CNTs as a by-product, which can be used in other reactions, such as composite fabrication) [2,20,21,47].
At present, in the majority of industrial processes, the catalysts are used in the form of a powder. However, solid-state catalysts are also well known [22–24] and have the same advantages in relation to powder catalysts: they do not require a carrier, it is possible to give them all kinds of shapes (e.g., a honeycomb structure), they are not subjected to erosion during the reaction and there is also no alignment problem in this case. One of the Ni-based, solid-state catalysts is Ni3Al [33], which belongs to multifunctional materials, combining properties of both the constructional and functional materials. They are resistant to oxidation and corrosion, have a relatively low density and a relatively high melting point, and are relatively easy to form [25–30]. According to the literature, Ni3Al intermetallic thin foils exhibit catalytic properties in hydrocarbon decomposition reactions [31–37]. Based on the literature, the relatively high temperature of maximal hydrocarbon conversion is the main disadvantage of this material.
In the case of powder catalysts, the size of the catalytic particles or support particles is a very important factor determining the catalytic activity [20,21,38,40]. It is expected that the smaller particles of powder catalysts increase the surface of the metal and thereby activity should increase [39]. Chen et al. found that the support particle size has significant influences on the physicochemical properties and catalytic activity of the resulting Ni/A12O3 catalyst, but little influence on the selectivity of p-nitrophenol hydrogenation. Additionally, at a comparable amount of Ni loading, the catalytic activity of Ni/A12O3, prepared with alumina support of smaller particle size, was lower [40]. Matsumura et al. proved that the small nickel particles are disadvantageous in the methanol decomposition reaction. It was found that catalytic activity does not simply relate to the Ni surface area of the sample, but it depends on the amounts of carbon monoxide and hydrogen strongly adsorbed on the catalyst's surface [21]. They believed that catalytic activity in methanol decomposition depended on the Ni particles' size and, for particle dimensions from 60 to 100 nm, the catalysts were most effective [21]. Takenaka et al. found that the type of support had an influence on the size of supported Ni and because of this on their catalytic properties [20]. Moreover, the method of preparing the catalyst is important and significantly affects their catalytic properties [20,36–38]. So far, the impact of grain diameter on their catalytic properties in solid-state catalysts has been not tested.
In the solid state, grain boundaries represent rapid diffusion paths in the materials [41,42], so it was expected that the smaller the grain, the bigger the catalytic activity. In this work, Ni3Al thin foils with different average grain diameters were used in catalytic tests in the methanol decomposition reaction. The catalysts were prepared by a new method [43], as compared to the methods developed by other researchers [25–28,33,44,45]. In this paper, the explanation of the grain diameter effect on the catalytic properties of Ni3Al thin foils in thermocatalytic methanol decomposition has been attempted.
2 Experimental
The Ni3Al intermetallic alloys with a composition of 77.54Ni-22.1Al-0.26Zr-0.1B (at %) was induction-melted from pure elements in high purity argon and then cast into a shell mold. The as-cast ingot was cut into sheets using a fraction saw. The thin foils of Ni3Al were obtained by cold rolling at room temperature to 95% of thickness reduction without intermediate annealing. The cold deformed alloy was then subjected to recrystallization annealing at different temperatures and times in an argon atmosphere to obtain desirable average grain diameters: for about 30 μm, it was 5.5 h at 1100 °C; for about 5 μm, it was 1 h at 900 °C. Additional information about the fabrication process has been described previously [43]. Before the catalytic tests, the Ni3Al foil was mechanically polished (up to the thickness of approximately 50 μm) and degreased in acetone.
Methanol decomposition assays were carried out in the fixed-bed reactor with high-purity Ar as a carrier gas. The flow rate of the pure methanol feed was 0.006 dm3/h and the flow rate of the carrier gas was three dm3/h. The methanol was put into the reactor system at a constant rate using an infusion pump. The feed rate of the inert gas was controlled by an electronic flow controller purchased from BetaErg provided with two drivers: a low-bandwidth (0.0015–0.3 ml/min) and high-bandwidth (0.3–12 dm3/min). At first, methanol changes to gas at 100 °C in the low-temperature reactor, and next, in the high-temperature reactor, the proper decomposition reaction occurs.
The intermetallic phase was tested in a temperature range of 100–600 °C, where the temperature was increased by 100 °C and was maintained constant for 1 h. Ni3Al with for the 5 μm grain diameter, the tested temperature range was extended to 700 °C. Around the temperature of maximal methanol conversion, the measuring points were concentrated: in the temperature range 450 °C–650 °C, the temperature increased by 50 °C and was held constant for 1 h. Temperature control in the reactors was done using electronic controllers connected with thermocouples. In the temperature of maximal methanol conversion, isothermal catalytic tests were conducted for 17 h. The analysis of the gaseous products of reactions was performed on-line by using a gas chromatograph Clarus 500 coupled with a mass spectrometer Clarus 560S purchased from Perkin Elmer.
The surface morphology of thin foils before reactions were observed using a field-emission scanning electron microscope FE-SEM (FEI, Quanta 3DFEG) equipped with an electron backscatter diffraction (EBSD) and EDS detector. The solid products of the reactions were also analysed by using a Quanta 3DFEG.
The specific surface area of the obtained nanostructures was measured by the Brunauer–Emmett–Teller method (SBET) using a Micromeritics Accelerated Surface Area and Porosimetry System (ASAP 2020, Micromeritics) at 77 K with Kr as the adsorption gas, in the range of relative pressures from 0.08 to 0.45. All the samples were outgassed in a vacuum for 2 h at 200 °C before the analysis. The mass of solid products formed during the methanol decomposition reactions was determined by a Radwag analytical laboratory balance AS 60/C/2 with an accuracy of 0.01 mg.
The phase structure of the surfaces of the intermetallic catalysts and the solid products was examined by X-ray diffraction using a Rigaku Ultima IV diffractometer with Co Kα radiation (λ=1.78897 Å) and operating parameters of 40 mA and 40 kV with a scanning speed of 1°/min with step by 0.02°. The structure and quality of obtained solid products were determined by Raman spectroscopy using a Renishaw inVia Raman Microscope with 633 nm excitation at low laser power (10%) and with 50× objective lens.
3 Results and discussion
The EBSD analysis was done to determine the average grain diameter of Ni3Al and describe the surface conditions. Fig. 1 shows the EBSD inverse pole figure (IPF) orientation maps for Ni3Al thin foils before the methanol decomposition reactions. The average grain diameter was 30 μm and 5 μm in Fig. 1a) and Fig. 1b), respectively. The high angle grain boundaries (HAGBs) were 63% and 94% for 30 μm and 5 μm Ni3Al grain diameters, respectively. It is assumed that HAGBs over 60% indicates a complete recrystallization of the material. The domination of one color on the orientation maps (Fig. 1a) pointed to an occurrence of texture in the tested material. Additionally, in Fig. 1a, one can see the low-angle boundaries inside the observed grains, but their contribution is negligible.
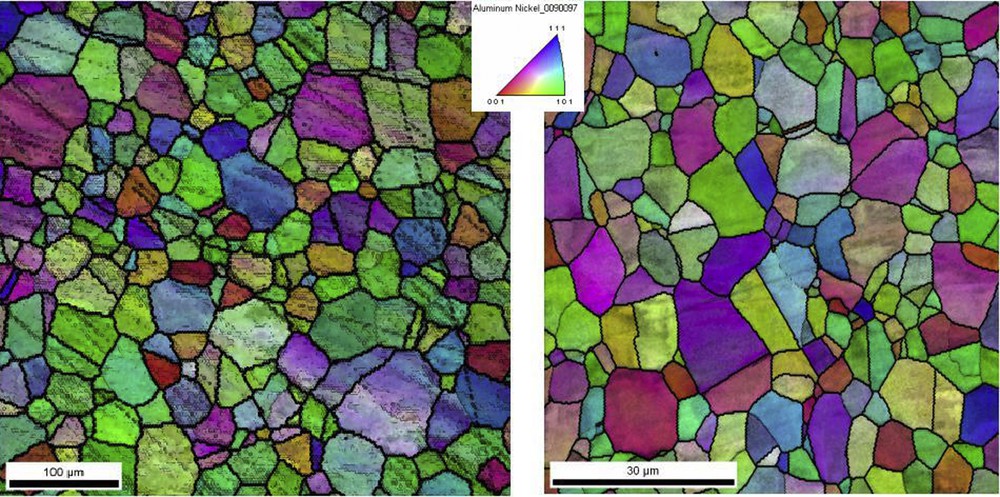
EBSD orientation maps for Ni3Al thin foils before the methanol decomposition reactions.
The catalytic activity of tested Ni3Al thin foils and reference materials was analyzed. Fig. 2 shows the degree of methanol conversion as a function of reaction temperature for two Ni3Al grain diameters and quartz (as a reference material). Methanol decomposition on quartz starts at about 100 °C reaching 30% of methanol conversion, and next, gently increases, reaching its maximum of 58% at 500 °C. Methanol decomposition on the 30 μm intermetallic average grain diameter starts at about 300 °C and grows rapidly, achieving its maximum of about 94% at 500 °C [37]. In contrast, the Ni3Al thin foils with a smaller average grain diameter (5 μm) show less catalytic activity over the range of the tested temperature. The main trend is similar, but the methanol conversion slowly increases in the range of 300–500 °C and then grows violently, achieving a maximum of about 97% at 550 °C. Subsequently, methanol conversion rapidly decreases. These results indicate that Ni3Al with a greater grain diameter shows higher catalytic activity than Ni3Al with 5 μm grains, especially in a temperature range of about 400–500 °C.
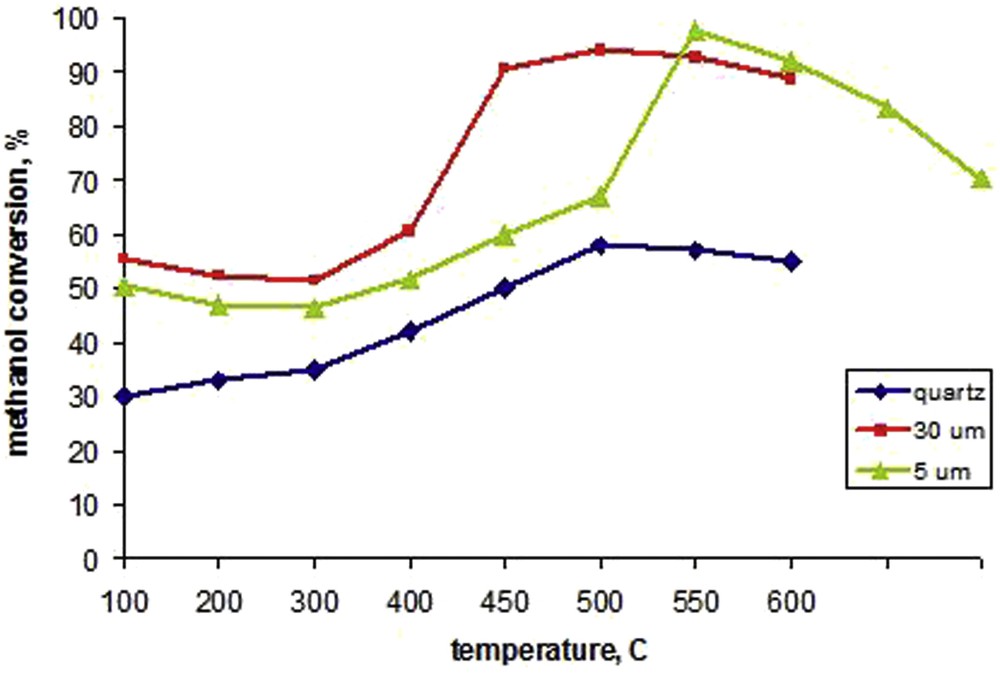
The methanol conversion over quartz and Ni3Al with varied grain diameters (30 μm and 5 μm) in function of a temperature reaction.
To examine the catalytic properties of the tested intermetallic phase in detail, the analysis of the catalytic stability of Ni3Al thin foils in methanol decomposition was conducted for 17 h. Fig. 3 shows methanol conversion over two average grain diameters of Ni3Al at the temperature of maximal methanol conversion (500 °C and 550 °C for 30 μm and 5 μm, respectively) as a function of process duration. When the catalytic test started, the methanol conversion was above 95% over both grain size intermetallic foils. Next, the methanol conversion gradually decreased with time for both tested Ni3Al grain diameters, but for smaller grains, the decline in methanol conversion was much more sharp. The methanol conversion over Ni3Al with a 5 μm average grain diameter was about 75% after 17 h of reaction time. In comparison, methanol conversion over intermetallic foil with a 30 μm average grain diameter was about 93% after the same experiment duration. This indicated that Ni3Al foil with both grain diameters was active in methanol decomposition, but more active and stable catalytic properties are present in thin foil with a greater average grain diameter (30 μm).
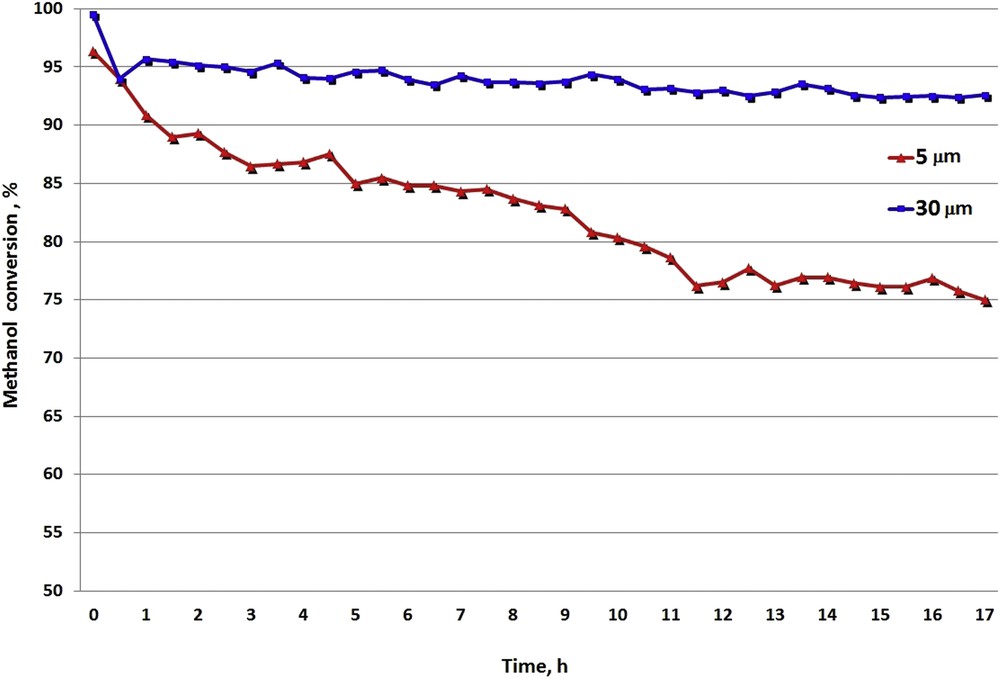
The Ni3Al stability tests in the methanol decomposition reaction at the temperature of maximal methanol conversion conducted over catalyst with two investigated grain diameters.
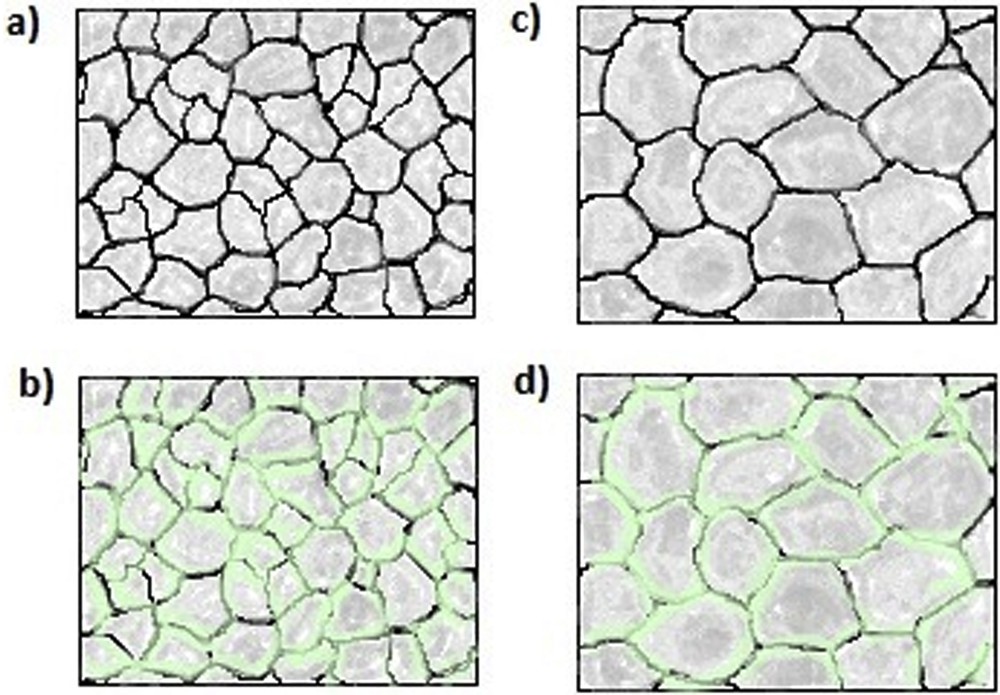
The morphology of the deposit formed during activity and stability tests on the intermetallic phase with varied grain diameters (5 μm and 30 μm) was different. Fig. 4 presents the surface morphology of Ni3Al catalysts after the methanol decomposition reaction in catalytic activity tests (described as “jump”) and in an isothermal stability test (described as “17 h”). It can be noticed that the deposit has a similar structure, independent of the kind of test. One can see that nanostructures formed during the catalytic activity test on Ni3Al thin foil with smaller grain size (Fig. 4a) were thinner and more uniform than those on the foil with a 30 μm grain diameter (Fig. 4c). What is more, analogical dependence can be noticed for deposit observed on the catalyst surface with both grain diameters after catalytic stability tests (Fig. 4b and d). In every experiment conducted on Ni3Al with a 5 μm grain diameter, the diameters of the observed nanostructures were distinctly thinner than that on Ni3Al with a greater grain diameter. Similar to other tests [37], on the top of nanostructures observed after every catalytic activity and stability tests on the surface of Ni3Al with both tested catalysts grain diameters, the Ni particles were noticed.
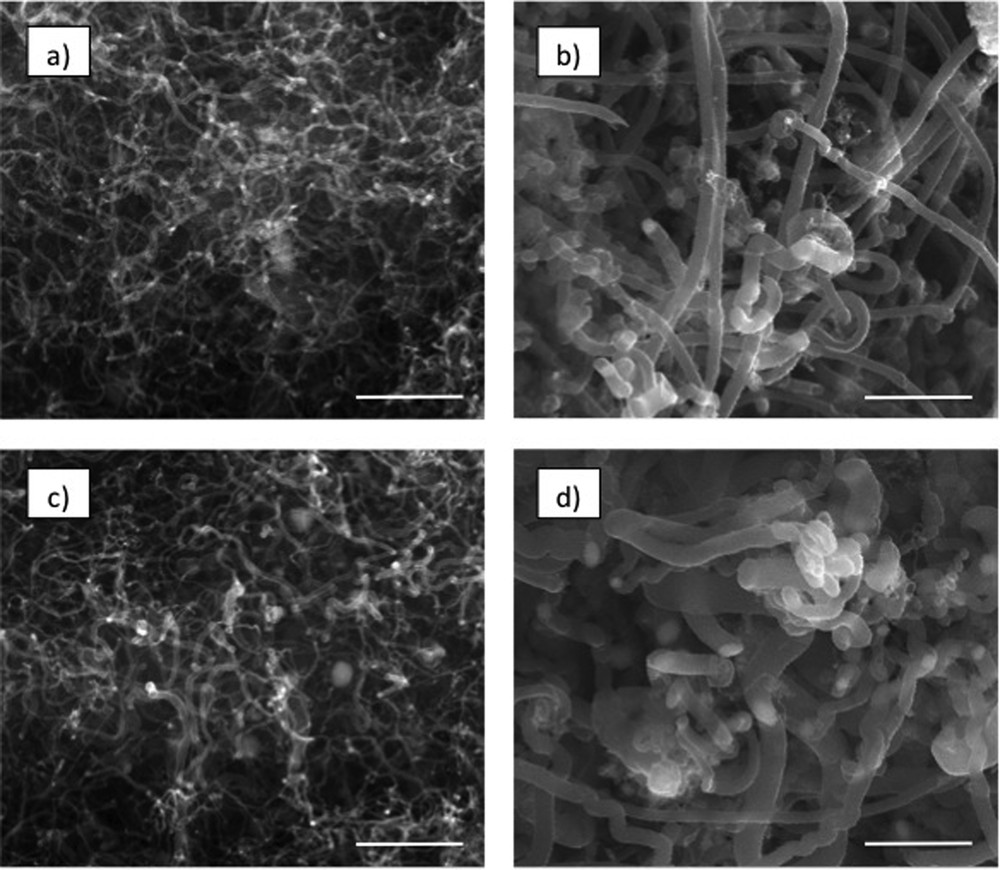
The morphology of the deposit obtained on the intermetallic phase with a varied grain diameter after activity (5 μm – (a) and 30 μm – (c)) and stability (5 μm – (b) and 30 μm – (d)) tests. The bar is equivalent to 1 μm.
To make the analysis of the deposit formed on the Ni3Al thin foils more detailed, the measurements of its specific surface area were done. Both the BET and the mass change of samples after catalytic activity (“jump”) and stability (“17 h”) tests are given in Table 1. The mass of deposit after methanol decomposition in the catalytic activity test (“jump”) in both grain diameters are similar per gram of the catalyst, but specific surface areas are significantly higher for the 5 μm than for the 30 μm grain diameter of Ni3Al. Furthermore, after stability tests (“17 h”), the sample mass change for the 5 μm catalyst grain diameter was more than three times higher than for the 30 μm Ni3Al grain diameter. What is more, the specific surface area for the deposit formed on 5 μm Ni3Al grain size during the stability test was substantially higher than that on Ni3Al with a 30 μm average grain diameter. These results are in accordance with SEM observation (Fig. 4), which indicated that the nanostructures formed on intermetallic thin foil with 30 μm grain size are more thick.
Mass and specific surface area (SBET) of the resulted carbon deposit obtained on the Ni3Al surface during catalytic activity (a) and stability (b) tests for different grain diameters of the tested catalyst.
| Grain diameter | Δmjump [mg/gcat]a | BETjump Kr [m2/gdep.]a | Δm17h [mg/gcat]b | BET17h Kr [m2/gdep]b |
| 30 μm | 8.3 ± 0.4 | 69.7 ± 0.7 | 18.8 ± 0.3 | 105.8 ± 0.5 |
| 5 μm | 9.5 ± 0.4 | 96.3 ± 0.8 | 70.4 ± 0.3 | 121.3 ± 0.6 |
a Activity tests.
b Stability tests.
XRD analysis was used to determine changes in the surface phase composition of the investigated Ni3Al catalyst before and after methanol decomposition experiments (Fig. 5). Strong Bragg peaks, attributed to cubic Ni3Al intermetallic phases, were observed in the XRD patterns of all of the tested samples (JCPDS card, No. 01-074-7054, the cell constant a = 3.564 Å). Before the reaction, the Ni3Al thin foil with a 30 μm grain diameter gave more expressive diffraction peaks than 5 μm grain size, which is connected with grain size: peaks broadening with grain refinement. The appearance of cubic carbon (JCPDS card, No. 00-060-0053) and hexagonal graphite (JCPDS card, No. 00-013-0148) on the surface of Ni3Al foils after methanol decompositions in catalytic activity and stability tests are indicated in the acquired XRD patterns. The presence of nickel (JCPDS card, No. 04-015-2543) on the Ni3Al surface after catalytic tests conducted over 30 μm grain size thin foil has been demonstrated. However, the presence of this phase on the catalyst surface with a smaller grain size has not been confirmed, which may be due to the higher fragmentation of Ni particles present at the Ni3Al surface.
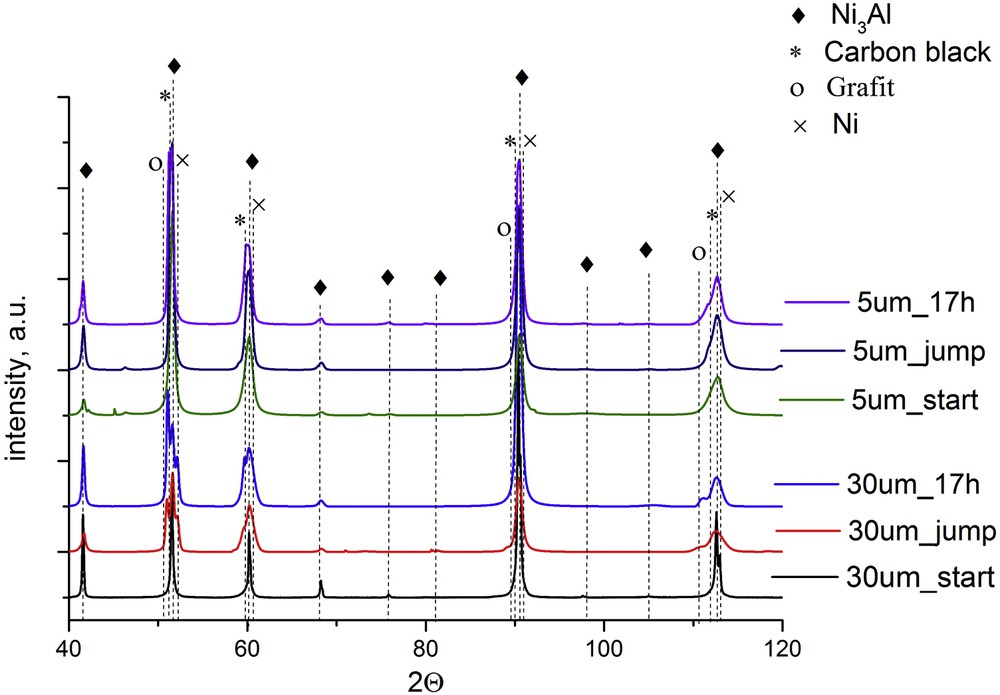
The XRD spectra of the surface of the investigated Ni3Al thin foil before and after catalytic activity (described as “jump”) and stability (described as “17 h”) tests in the methanol decomposition reaction.
Moreover, in the diffraction pattern of the Ni3Al sample with both grain diameters, after catalytic activity and stability tests, the broadening of the peaks was noticed. As it is commonly known, the broadening of the peaks may be due to grain refinement and/or surface amorphization. In our research, this effect is probably due to the appearance of various forms of carbon formed during methanol decomposition and, possibly, due to increasing roughness of the intermetallic surface caused by the extraction of Ni nanoparticles.
The deposit formed during catalytic tests was analyzed by Raman spectroscopy (Fig. 6). The radial breathing mode (RBM) peaks, localized below 300 cm−1 and providing about presence of single walled carbon nanotubes (SWCNTs) were not noticed, which indicated that SWCNTs were not present in the carbon deposit. The presence of two characteristic peaks with a maximum of about 1327 (D-band) and 1585 cm−1 (G-band) on the Raman spectrum for every experiment condition confirmed that the deposit consisted of multiwalled carbon nanotubes (MWCNTs) [46]. The D-band is a defect-derived peak and the G-band is from the in-plane vibration of graphite. The presence of a highly intensive D-band in the Raman spectrum indicated that disordered and amorphous carbon was prevalent in the analyzed carbon deposit. Moreover, the presence of the broadened G-band suggested that well crystallized MWCNTs were in the carbon deposit. Additionally, in every experiment, the peak D′ was observed (localized in the range of wavelength 2620-2632 cm−1), which shows that the quality and purity of obtained MWCNTs was very high.
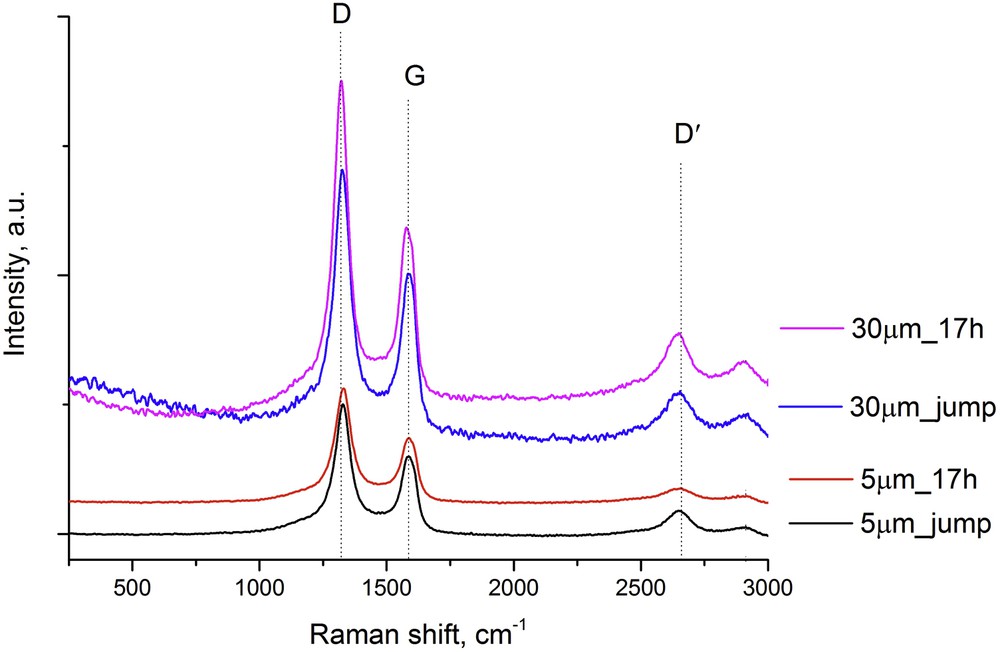
The Raman spectra of the carbon deposit formed on the Ni3Al surface during catalytic activity and stability tests.
The main products of the methanol decomposition reaction over Ni3Al foils are the hydrogen, carbon monoxide and solid carbon deposits. The by-products are carbon dioxide, methane and water. Methanol decomposition may be described by the following equation:
| CH3OH → CO+2H2 | (1) |
| CO + H2O → CO2 + H2 | (2) |
| 2CO → C + CO2 | (3) |
| CO + H2 → CH4 + H2O | (4) |
The type of by-products suggests that the water-gas shift reaction (2), Boudouard reaction (3) and methanation (4) occur in the performed catalytic test.
It is worth noting that some of the by-products, especially water, can oxidize the Ni3Al catalyst surface and in effect gradually poison them. Based on the results presented previously [48], H2O as a by-product of methanol decomposition can be consumed in the reaction, leading to the formation of metallic Ni (5) and then in the subsequent reaction of the production of aluminum hydroxide (6):
| 2Ni3Al + 3H2O → 6Ni + Al2O3 + H2 | (5) |
| Al2O3 + 3H2O → 2Al(OH)3 | (6) |
On the other hand, the appearing Ni nanoparticles also can be oxidized by water according to the following reaction (7), and then it can take part in the subsequent reaction of spinel formation (8):
| Ni + H2O → NiO + H2 | (7) |
| NiO + Al2O3 → NiAl2O4 | (8) |
Notwithstanding, the Al2O3 formation is energetically privileged and for that preferentially produced on the catalyst surface. According to Kim et al. and Moussa et al., the oxidization of Ni3Al preferentially occurs through grain boundaries [21,40]. In Fig. 7, the mechanism of the tested intermetallic catalyst oxidation process affected by the grain diameter and its influence on the methanol decomposition reaction was proposed. At the beginning of catalytic stability test over Ni3Al thin foil the methanol conversion reached on intermetallic foil with both grain diameter was approximately the same, because the active surface of catalyst was approximately the same (grey area on the Fig. 7a and 7c). Next, after about the first half hour of reaction time, the oxidation of the catalyst surface by the by-products of methanol decomposition takes place and occurs mainly through grain boundaries. However, for the catalyst with smaller grain diameters, the share of grain boundaries in the whole available catalyst surface was much higher than that for Ni3Al with a greater grain diameter. More surface oxides (bright green areas in Fig. 7b and d) were formed on Ni3Al with 5 μm grain size, which significantly decreased the active parts of the catalyst with smaller grains (compare grey areas in Fig. 7b and d).
The mechanism of the oxidized of Ni3Al surface occurring simultaneously during the methanol decomposition reaction for the grain diameter of the catalyst was 5 μm (a, b) and 30 μm (c, d). The gray areas represent the active parts of Ni3Al and bright green areas are the oxidized surfaces of the catalysts.
4 Conclusions
In summary, it was found that the Ni3Al intermetallic phase demonstrated good catalytic properties and catalytic stability in methanol decomposition, especially over catalysts with an average grain diameter of about 30 μm. The major findings can be listed as follows:
- 1) The catalytic activity of Ni3Al thin foils with a 30 μm grain diameter starts above 300 °C, and reaches the maximum of methanol conversion (94%) at 500 °C. The catalytic activity of Ni3Al thin foils with a 5 μm average grain diameter also starts above 300 °C, but in contrast, the methanol conversion increases slowly and achieves its maximum (97%) just at 550 °C.
- 2) The catalytic stability tests showed that the Ni3Al intermetallic catalyst with a greater grain diameter was more stable in the temperature of maximum methanol conversion. The methanol conversion decreases with reaction time and after 17 h of catalytic stability tests was 75% and 93% for 5 mm and 30 mm average catalyst grain diameters, respectively.
- 3) Based on the Raman spectroscopy and scanning electron microscopy measurements, it was identified that after every catalytic activity and stability test (regardless of the kind of test) the surface of Ni3Al thin foil was covered by a carbon deposit built of well crystallized, curved MWCNTs and amorphous carbon, probably in the form of nanofibers. There are no SWCNTs in the carbon deposit. At the ends of the carbon nanostructures, obtained in every catalytic activity and stability tests, the Ni nanoparticles were formed. Additionally, XRD analysis indicated the presence of carbon black, graphite and nickel phases in the obtained carbon deposit.
- 4) It was found that the nanostructures formed on the catalyst with a 5 μm average grain diameter was thinner and more uniform than on the Ni3Al surface with a 30 μm grain diameter, which was compatible with BET measurements. Moreover, the Ni3Al catalyst with a 5 μm grain diameter during the stability test was covered by a much greater mass of deposit (more than three times) than intermetallic foil with a greater grain size.
- 5) It was determined that the catalyst with a greater average grain diameter was more active and stable. It was found that the change in catalytic activity and stability of Ni3Al depending on the catalyst grain diameter was due to the different available parts of the catalyst surface during the methanol decomposition reaction. Catalyst surface oxidation occurred simultaneously with methanol decomposition and preferably took place on the grain boundaries, a phenomenon which is connected with the faster deactivation of catalyst with a smaller grain size.
The significant impact of the average grain diameter of solid-state catalysts on their catalytic properties makes it possible to design Ni3Al thin foils with higher catalytic activity.
Acknowledgements
The research was financed by the National Science Centre (decision number: DEC-2012/07/N/ST8/03069).
Scanning Electron Microscope has been purchased with the financial support from the Innovative Economy Programme (POIG.02.01.00-14-071/08).
The authors acknowledge PhD Paweł Jóźwik for research materials and fruitful discussion. The authors acknowledge PhD Małgorzata Norek for the execution of part of the BET measurements.