

1 Introduction
Thiosemicarbazone compounds, an important class of N,S-donor ligands, have been studied for their structural diversity [1,2] and chemical properties [2]. Thiosemicarbazones can bind to a metal center in various coordination modes in their anionic as well as neutral forms [3–6]. Their complexes with transition metals have a large range of biological applications as antibacterial [3], antitumor [4] and anticancer [5] agents. The less investigated copper(I) and silver(I) complexes can also form mono-, di- and poly-nuclear compounds with interesting structural features [7–10]. Here thiosemicarbazones usually act as monodentate ligands bonding through the sulfur atoms [7,8], but in the literature there are also sporadic reports on copper(I) [9] and silver(I) [10] complexes with chelating N,S thiosemicarbazones.
In continuation of our research of transition metal complexes with thiosemicarbazone ligands [11–13], in this paper we report the synthesis, spectroscopic characterization, crystal structure, thermal studies and antibacterial activities of a new mononuclear silver(I) thiosemicarbazone complex [Ag(catsc)(PPh3)2]NO3 (Scheme 1).
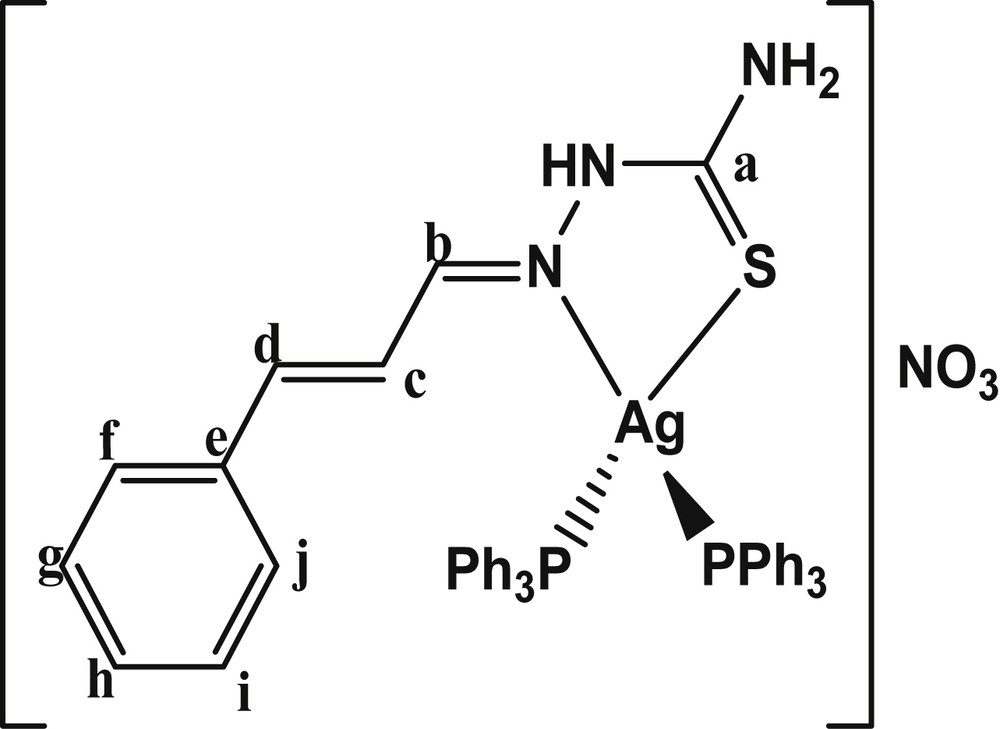
The chemical structure of [Ag(catsc)(PPh3)2]NO3.
2 Experimental
2.1 Materials and methods
AgNO3, PPh3, cinnamaldehyde, thiosemicarbazide, ethanol and acetonitrile were purchased from Merck and used as received. The thiosemicarbazone ligand catsc was prepared in high yield following a literature procedure [14]. Infrared spectra were recorded using a KBr disk on an FTIR (Perkin–Elmer) spectrometer. Elemental analyses were carried out using a Heraeus CHN-O-Rapid analyzer. 1H, 13C and 31P NMR spectra were measured on a Bruker DRX-400 AVANCE spectrometer at 400 MHz. All chemical shifts were reported in δ units downfield from TMS. The TG was performed on a PerkinElmer TGA/DTA lab system 1 (Technology by SII) in an argon atmosphere, using the heating rate 20 °C/min and the temperature span 30–750 °C. UV–vis spectra were recorded by a PerkinElmer Spectrometer Lambda 25.
2.2 Preparation of [Ag(catsc)(PPh3)2]NO3
The ligand catsc (0.021, 1 mmol) was added to an acetonitrilic suspension of AgNO3 (0.017 g, 0.1 mmol) and PPh3(0.052 g, 0.2 mmol) (molar ratio, 1:2) and stirred for 0.5 h until a yellow clear solution was obtained. The solution was left at −4 °C for several days and then slowly evaporates at room temperature. The white polygon crystals were filtered and washed twice with acetonitrile, and dried at room temperature. Anal. Calcd for C46H41AgN4O3P2S: C, 61.41; H, 4.59; N, 6.23; S, 3.56%. Found: C, 61.47; H, 4.65; N, 6.31; S, 3.52%. FTIR data (KBr, cm−1): υ (NH) 3143 (NH2 group), 3251–3409, υ (CH aromatic) 3017, υ (CH imine) 2979, υ (CN imine) 1562, {ν(CC) + ν(CN) + ν(PCPh)} 993, 1056, 1148, 1182, υ (CS) 814. 1H NMR (DMSO-d6, δ ppm): 11.7 (s, 1H, NH), 8.6 (s, 1H, CbH = N), 8.0–8.1 (d, 1H, ChH); 7.8 (s, 2H, NH2); 7.2–7.6 (32H, PPh3 + Cc,dH); 7.0–7.1 (d, 2H, Cf,jH); 6.8 (dd, 2H, Cg,iH). 13C NMR (DMSO-d6, δ ppm): 175.7 (CaS), 147.5 (Cb = N), 124.8–140.7 (Cc–j + PPh3). 31P NMR (DMSO-d6, δ ppm): 7.6. UV–vis (λmax, nm): 272, 372.
2.3 X-ray crystallography
A single crystal of [Ag(catsc)(PPh3)2]NO3 of size 0.09 mm × 0.07 mm × 0.06 mm was selected for an X-ray diffraction study. Crystallographic measurements were done at 293 K with a four circle CCD diffractometer Gemini of Oxford diffraction, Ltd., with mirrors-collimated Cu Kα radiation (λ = 1.54184 Å). Although the quality of the single crystals was low (as indicated by the Rint factor in Table 2 for merging symmetry equivalent reflections) the crystal structure could be nevertheless easily solved by charge flipping with program SUPERFLIP [15] and refined with the Jana2006 program package [16] by the full-matrix least-squares technique on F2. The molecular structure plots were prepared by using Diamond 4 [17]. Hydrogen atoms were mostly discernible in difference Fourier maps and could be refined to reasonable geometry. According to the common practice, hydrogen atoms attached to carbons were kept in ideal positions during the refinement. The isotropic atomic displacement parameters of hydrogen atoms were set to 1.2 Ueq of their hydrogen atoms. Crystallographic data and details of the data collection and structure solution and refinements are listed in Table 1.
Selected bond distances (A) and angles of [Ag(catsc)(PPh3)2]NO3.
| Ag1 N8 | 2.480(6) | N5 C33 | 1.288(7) | N4 C80 | 1.320(8) |
| Ag2 N5 | 2.468(5) | Ag2 P6 | 2.4951(16) | N2 N8 | 1.370(7) |
| Ag1 S1 | 2.6124(16) | N8 C69 | 1.287(7) | N2 C80 | 1.337(8) |
| Ag1 P1 | 2.4354(15) | N7 C18 | 1.349(8) | S1 C80 | 1.702(6) |
| Ag1 P2 | 2.4996(16) | Ag2 P5 | 2.4406(15) | S2 C18 | 1.706(6) |
| Ag2 S2 | 2.6085(15) | N6 C18 | 1.329(8) | N5 N7 | 1.384(7) |
| N8 Ag1 S1 | 71.87(5) | N8 Ag1 P1 | 118.17(5) | N8 Ag1 P2 | 96.72(5) |
| N5 Ag1 S2 | 72.80(5) | N5 Ag1 P5 | 119.98(5) | N5 Ag1 P6 | 96.57(5) |
| S1 Ag1 P1 | 120.18(5) | N6 C18 N7 | 116.0(5) | N8 N2 C80 | 121.4(5) |
| S1 Ag1 P2 | 111.45(5) | N5 C33 C44 | 120.8(5) | O1 N1 O4 | 121.5(5) |
| P1 Ag1 P2 | 123.91(5) | N8 C69 C39 | 122.1(5) | O2 N3 O3 | 121.3(5) |
| N8 Ag1 P1 | 118.17(5) | S1 C80 N2 | 123.0(5) | N7 N5 C33 | 114.5(5) |
| N8 Ag1 P2 | 96.72(5) | S1 C80 N4 | 121.2(5) | N5 N7 C18 | 121.9(5) |
| N8 Ag1 S1 | 71.87 | N2 C80 N4 | 115.7(5) | N2 N8 C69 | 115.4(5) |
| S2 Ag2 P5 | 114.64(5) | Ag1 S1 C80 | 95.8(2) | S2 C18 N6 | 121.4(5) |
| S2 Ag2 P6 | 116.67(5) | Ag2 S2 C18 | 98.4(2) | S2 C18 N7 | 122.5(5) |
| P5 Ag2 P6 | 123.52(5) |
Crystallographic and refinement data for [Ag(catsc)(PPh3)2]NO3.
| Empirical formula | C46H41AgN4O3P2S |
| Formula weight | 899.75 |
| Crystal system | Orthorhombic |
| Space group | P212121 |
| a/Å | 12.2631(4) |
| b/Å | 23.3682(6) |
| c/Å | 28.6672(9) |
| V/Å3 | 8215.1(4) |
| Z | 2 |
| μ/mm−1 | 5.52 |
| T/K | 293 |
| Crystal size/mm | 0.09 × 0.07 × 0.06 |
| Tmin | 0.881 |
| Tmax | 1 |
| Measured reflections | 47,513 |
| Independent reflections | 14,424 |
| Reflections with I > 3σ(I) | 10,972 |
| R[F2 > 3σ(F2)] | 0.043 |
| wR(F2) | 0.053 |
| S, Rint | 1.52, 0.084 |
| Parameters | 1045 |
| Δρmax,mineÅ−3 | 0.32, −0.28 |
2.4 Antibacterial activity
The antibacterial activity of the catsc ligand and its silver(I) complex [Ag(catsc)(PPh3)2]NO3 were investigated against two standard strains of gram-positive (Staphylococcus aureus ATCC-25923 and Enterococcus faecalis ATCC-29212) and gram-negative (Escherichia coli ATCC 25922 and Pseudomonas aeruginosa ATCC-27853) bacteria by the pure plate method. The tests were performed by using the methodology described in the guidelines of the ‘Comité de l'antibiogramme’ de la ‘Société francaise de microbiologie’ (CA-SFM, www.sfm.asso.fr) [18]. A solution of catsc and its complex were prepared at 20 mg/mL in DMSO under sterile conditions. After dilution, 10 petri plates with 10, 20, 30, 40, 50, 60, 70, 80, 90 and 100 μg/mL concentration of catsc and its complex were prepared. About 2 × 10⁴ bacteria suspended in sterile distilled water were inoculated on the different petri plates. After incubation for 24 h at 37 °C, the minimum inhibitory concentration (MICs μg/mL) was determined.
3 Results and discussion
3.1 Synthesis and characterization
Thiosemicarbazone ligand catsc was prepared in high yield using a standard method [14]. The ligand catsc was added to an acetonitrilic suspension of AgNO3 and PPh3 (molar ratio, 1:2) and was stirred for 0.5 h to obtain the silver(I) complex {[Ag(catsc)(PPh3)2]NO3}. Suitable crystals of [Ag(catsc)(PPh3)2]NO3 were prepared by slow evaporation of solvent at 273 K, and characterized by elemental analysis (CHNS), FTIR, UV–vis, 1H, 13C and 31P NMR spectroscopy, thermogravimetric analysis and single-crystal X-ray diffraction. Elemental analysis revealed that the ratio of Ag, catsc and PPh3 in [Ag(catsc)(PPh3)2]NO3 is 1:1:2. The stability of the complex in solution at room temperature is low, but the complex is stable as a solid for several months. The solubility of the complex depends on the solvent used. Thus, the complex is only slightly soluble in common organic solvents such as C2H5OH, CHCl3, CH3CN, but it is well soluble in coordinated solvents such as DMF and DMSO.
3.2 FTIR spectroscopy
The FTIR spectrum of [Ag(catsc)(PPh3)2]NO3 showed three bands in the range of 3251 and 3409 cm−1 (due to –NH2) and 3143 cm−1 (due to –NH). Appearance of the characteristic bands of ν(CS) and ν(CN) vibrational modes at 814 and 1562 cm−1 respectively, indicates the presence of the catsc ligand. Shifting of ν(CS) and ν(CN) bands to lower energy in the complex compared to the free ligand (850 and 1624 cm−1, respectively) confirmed that the catsc ligand was coordinated to silver(I) by S,N-donor atoms. The ν(P-Cph) bands were found at 1056 cm−1, indicating coordination of PPh3 via the P atom to the silver(I) ion [19]. The ν(CH aromatic) and ν(CH iminic) stretching frequency of catsc and PPh3 appeared at 3017 and 2979 cm−1, respectively. Finally, the ν(NO) asymmetric stretching mode of the nitrate anion appeared at 1390 cm−1 [20].
3.3 1H, 13C and 31P NMR spectroscopy
1H, 13C and 31P NMR spectra were recorded using DMSO-d6 (Fig. 1). The 1H NMR spectrum exhibited a singlet signal of the NNHC at about 11.7 ppm, which indicated that the coordination of the catsc ligand to the silver(I) ion is in its neutral form, via N,S-donor atoms [10,19]. Another singlet signal at 8.6 ppm revealed the presence of the iminic hydrogen (CHN). The protons of the PPh3 and –NH2 groups and of the ethylenic hydrogen (Cc,dH) appeared in the range of 7.1–7.6 and 8–8.1 ppm (m, 34H). The signals of Ci,gH and Cj,fH protons appeared at 6.8 (dd, 2H, J1 = 16 Hz, J2 = 9.6 Hz) and 7–7.1 (d, 2H, J = 16 Hz), respectively. A doublet signal at 7.8 ppm (J = 9.6 Hz) was related to the ChH proton. The 13C NMR spectrum showed two signals at 175.7 and 147.5 ppm for carbon atoms of CaS and Cb = N, respectively [21], while the Cc–j carbons and the carbons of two PPh3 appeared at 124.8–140.7 and 136.1 ppm. The aromatic carbons of catsc and PPh3 appeared at 124.8–133.8 ppm. The presence of only one signal in the 31P NMR spectrum of the complex at 7.6 ppm confirmed that the chemical environment of two P atoms is similar and the geometry around the silver(I) ion must be tetrahedral, not square-planar [10,19].
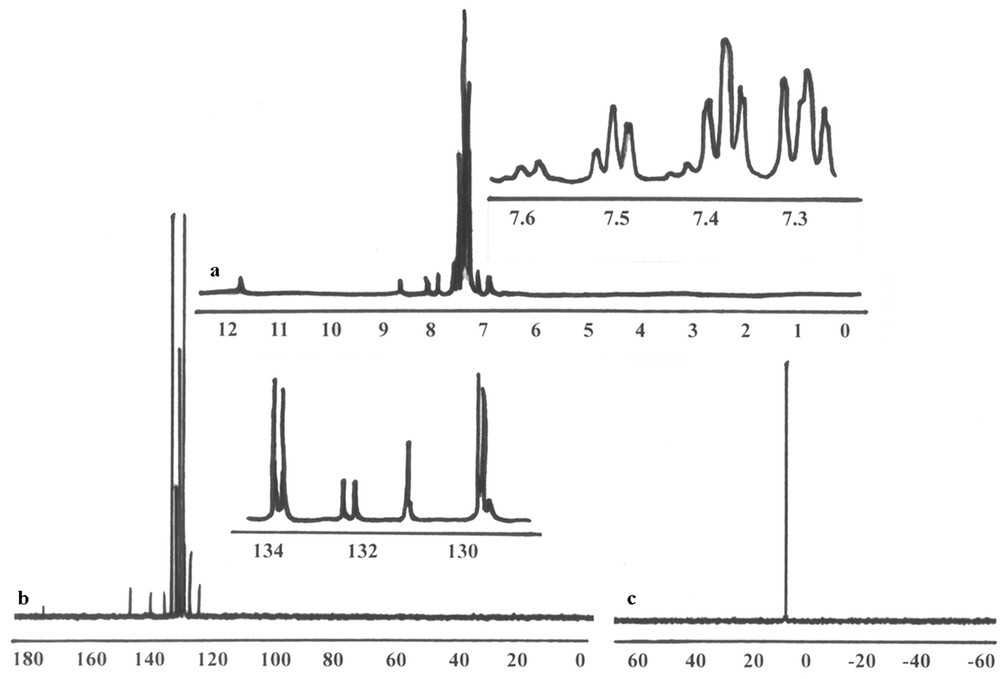
a) 1H, b) 13C and c) 31P NMR spectrum of [Ag(catsc)(PPh3)2]NO3.
3.4 UV–vis spectroscopy
The UV–vis spectra were obtained in DMSO solution. The catsc ligand showed two bands corresponding to n → π* (367 nm) and π → π* (342 nm) transitions, related to azomethine and thioamide functions. In the UV–vis spectrum of [Ag(catsc)(PPh3)2]NO3, n → π* and π → π* transitions exhibited the red (372 nm) and blue (272 nm) shifts, respectively, as a result of coordination.
3.5 Crystal structure
The complex [Ag(catsc)(PPh3)2]NO3 crystallized in an orthorhombic crystal system with space group P212121. Its molecular structure is shown in Fig. 2; selected bond distances and angles are presented in Table 2. The complex is formed by two symmetry-independent cationic molecules and two nitrate counter anions. The silver(I) ion is coordinated to two different P atoms from two PPh3 molecules and two S and N atoms of the thiosemicarbazone ligand catsc in its neutral form. The AgN, AgS and AgP bond distances lie in ranges 2.468(5)–2.480(6), 2.608(5)–2.612(6) and 2.435(4)–2.499(8) Å, respectively. All of these bonds are similar to those in already reported mononuclear silver(I) thiosemicarbazone complexes [10]. The bond angles around the silver(I) ions are in the range of ca. 71.87(8)–123.91(7)°, corresponding to strongly distorted tetrahedral geometry similar to that found for copper(I) thiosemicarbazone complexes [22,23]. The distortion of the tetrahedral geometry is caused by the bulky PPh3 ligands and by the pressure angle of the chelating ligand arising from the fact that the S1 atom and hydrazinic nitrogen N8 are in the Z position with respect to the C8N2 bond in the complex [22,23]. Normally, catsc is ready to be coordinated to the silver(I) ion through S and hydrazinic nitrogen atoms with the formation of a five-membered metallocycle [22]. The coordination of catsc to the silver(I) ion as a bidentate ligand causes the change of the configuration from E in the free ligand to Z in the complex. The SC bond distances lie in the range 1.702(5)–1.706(6) Å and are also close to those observed in similar complexes [19,20]. Also, the coordination of the catsc ligand to silver(I) by N and S atoms causes decreasing of the CS double bond distance in the complex as compared to the free ligand. In addition, there are several intermolecular hydrogen bonds in the complex between oxygen atoms of nitrate anions and hydrogen atoms of the NH2 group or H-hydrazinic atoms of the catsc ligand (Table 3, Fig. 3).
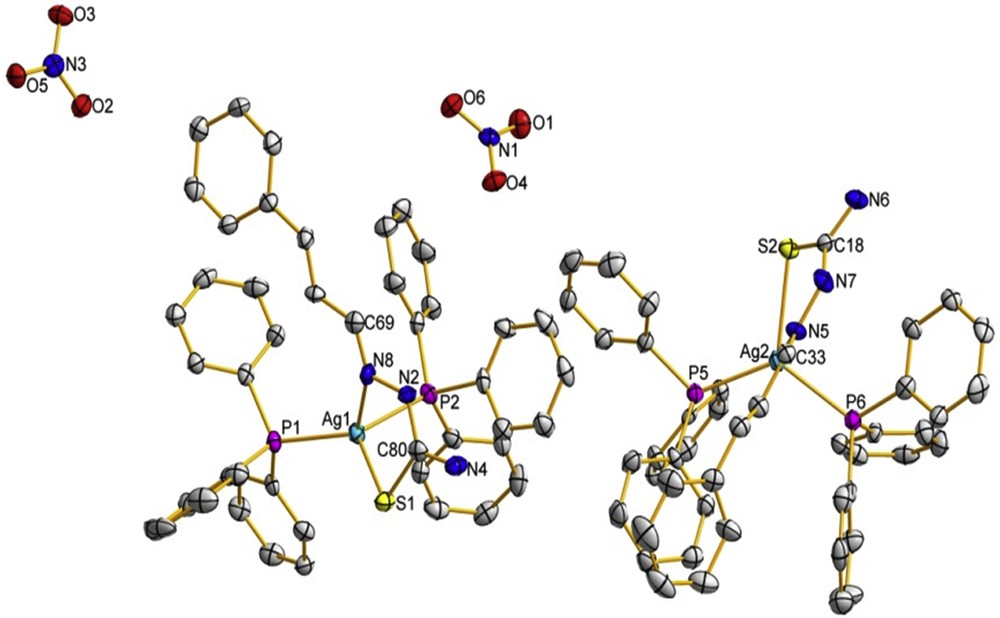
The asymmetric unit containing the two crystallography independent [Ag(catsc)(PPh3)2] cations and NO3 counter anions with the thermal ellipsoids drawn at the 40% probability. The H atoms are omitted for clarity.
Selected parameters of the hydrogen bonds involving the nitrate ions.
| Hydrogen bonding | D–H (Ǻ) | H⋯A (Ǻ) | D⋯A (Ǻ) | D–H⋯A (°) |
| N7 H1n7 O6 | 0.73(7) | 2.07(7) | 2.777(7) | 164(8) |
| N2 H1n2 O5 | 0.88(5) | 1.97(5) | 2.790(7) | 155(5) |
| N4 H1n4 O6 | 0.94(7) | 2.00(7) | 2.891(7) | 159(6) |
| N4 H2n4 O3 | 0.73(7) | 2.37(7) | 3.024(7) | 149(7) |
| N6 H1n6 O4 | 0.83(7) | 2.11(7) | 2.916(7) | 165(7) |
| N6 H2n6 O5 | 0.94(7) | 2.02(7) | 2.904(7) | 157(6) |
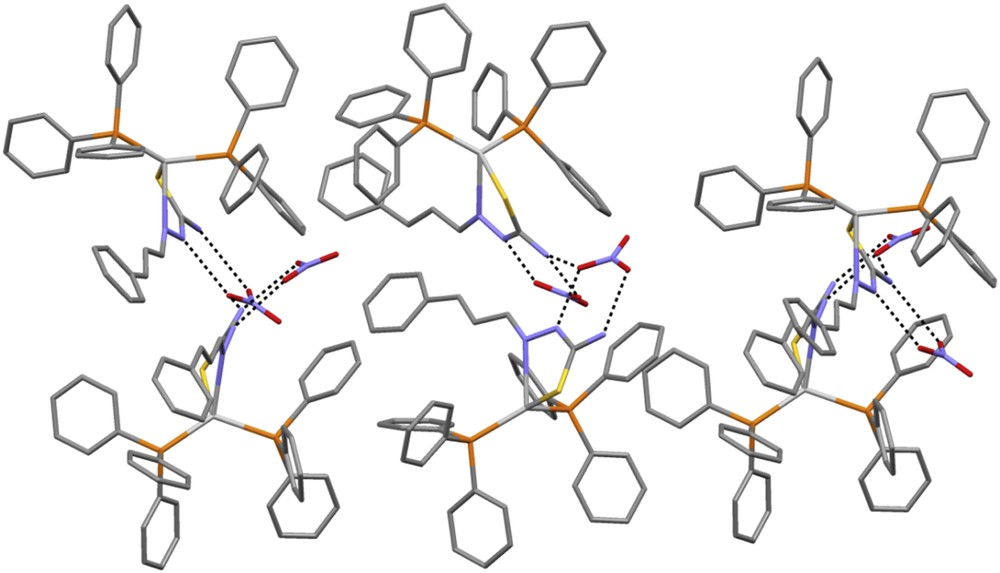
The hydrogen bonds between cationic complexes and nitrate anion.
3.6 Thermal gravimetry
To examine the thermal stability of [Ag(catsc)(PPh3)2]NO3, thermal gravimetry (TG) was carried out between 30 and 730 °C under argon flow (Fig. 4). The compound [Ag(catsc)(PPh3)2]NO3 is stable up to about 200 °C. Decomposition in two stages occurs between 200 and 430 °C with a mass loss of 85%. At the first stage (200–230 °C), the complex shows a mass loss of about 28% due to the partial decomposition, while in the second stage (230–430 °C), the complex loses 57% of the mass, leaving Ag as the final product.
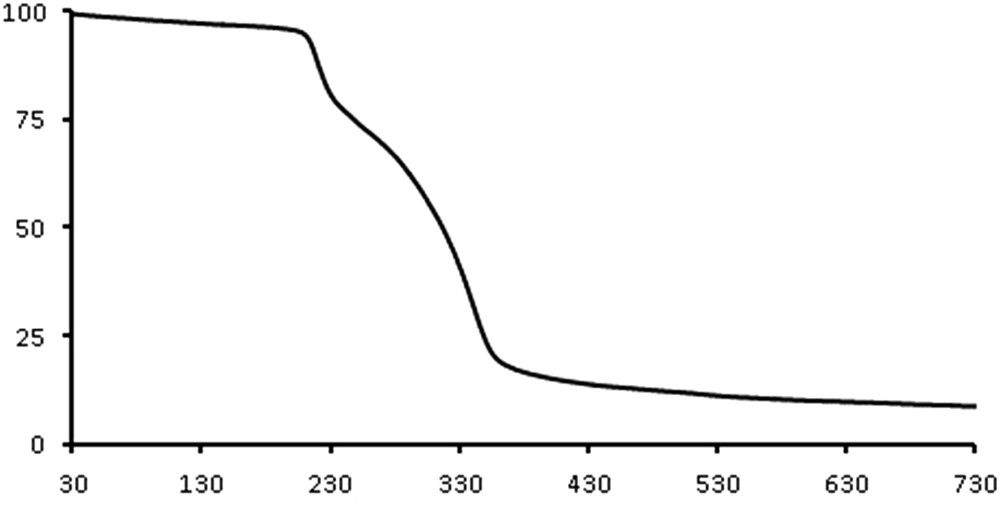
The TG curve of [Ag(catsc)(PPh3)2]NO3.
3.7 Antibacterial effects
The minimum inhibitory concentrations (MICs) of the catsc ligand and its silver(I) complex against two standard strains of gram-positive (S. aureus ATCC-25923 and E. faecalis ATCC-29212) and gram-negative (E. coli ATCC 25922 and P. aeruginosa ATCC-27853) bacteria are shown in Fig. 5 and presented in Table 4. The results showed that at 500 μg/mL catsc has no antibacterial activity against any of the tested bacteria [23]. The complex is inactive against P. aeruginosa at the 500 μg/mL concentration, but it is active against S. aureus, E. faecalis and E. coli, with better activity against S. aureus than against E. faecalis. The considerably higher antibacterial activity of the complex compared with the free ligand, especially towards gram-positive bacteria, has been also observed for the similar copper(I) thiosemicarbazone complex [23]. The differences of MICs found for the ligand and for the complex are due to its ability to penetrate cells walls, which is structure dependent [24].
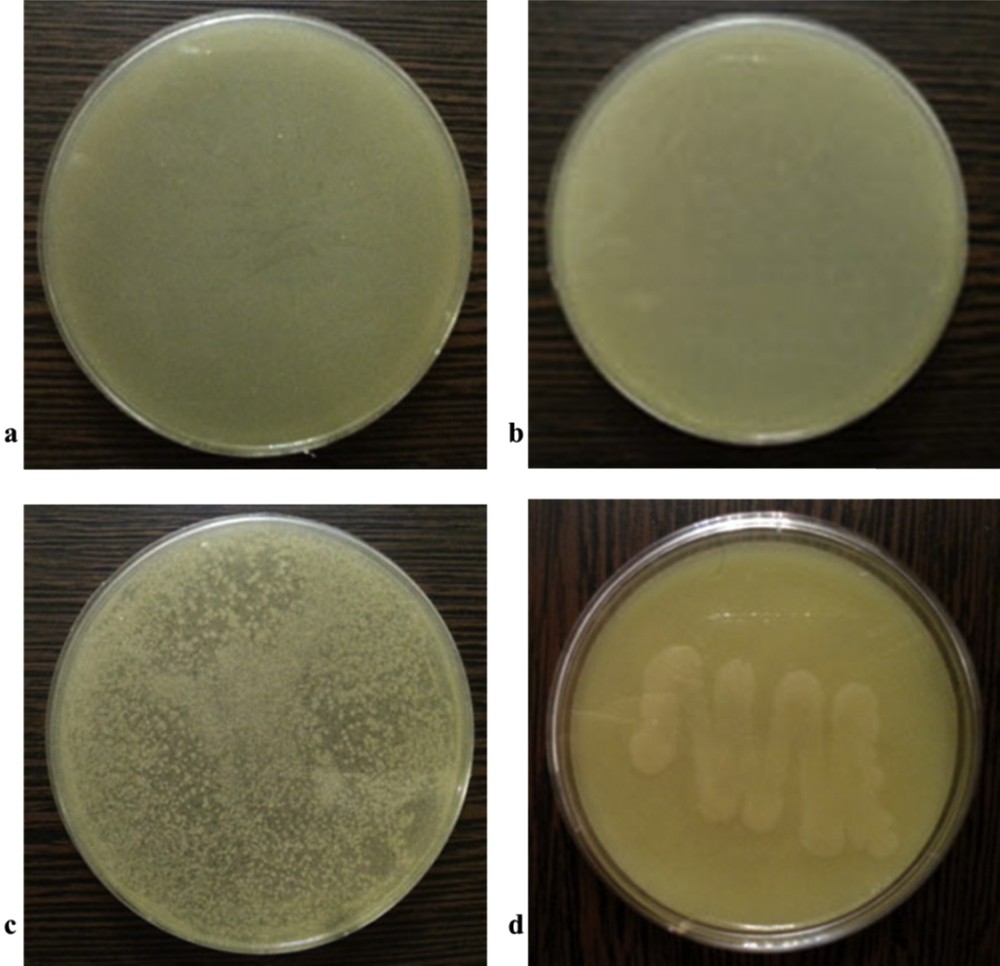
The antibacterial screening of the complex with the 50 μg/mL concentration against (a) S. aureus, (b) E. faecalis, (c) E. coli and (d) P. aeruginosa.
The MIC of catsc and [Ag(catsc)(PPh3)2]NO3.
| Species of bacteria | MIC of complex (μg/mL) | MIC of catsc ligand (μg/mL) |
| E. faecalis (ATCC29212) | 60 | >500 |
| S. aureus (ATCC25923) | <1 | >500 |
| E. coli (ATCC25922) | <1 | >500 |
| P. aeruginosa (ATCC2753) | >500 | >500 |
4 Conclusions
A new mononuclear silver(I) thiosemicarbazone complex [Ag(catsc)(PPh3)2]NO3 has been synthesized and characterized. Single crystal structure determination shows that the central silver(I) ion coordinate with two P atoms from two PPh3 molecules, and with S and N atoms of the catsc ligand. The silver(I) ion adopts a distorted tetrahedral geometry. The antibacterial activity of [Ag(catsc)(PPh3)2]NO3 is enhanced with respect to the free ligand.
Acknowledgements
We are grateful to the Payame Noor University and Golestan University for financial support of this work. Structure analysis was supported by the project 15-12653S of the Czech Science Foundation using instruments of the ASTRA lab established within the Operation program Prague Competitiveness – project CZ.2.16/3.1.00/2451.
Supplementary data
Crystallographic data (excluding structure factors) for the structure reported in this paper have been deposited with the Cambridge Crystallographic Center, CCDC No. 1501507. Copies of the data can be obtained free of charge at http://www.ccdc.cam.ac.uk.