

1 Introduction
Oil reserves, which are the primary sources of raw materials for synthesis of most valuable commodity products, are constantly depleting. One of the most promising, very abundant and renewable raw materials that meets the latest environmental requirements for chemical raw materials is ethanol obtained from biomass. A wide range of intermediates, large-scale end products, such as bulk and fine chemicals, including ethylene, hydrogen, ethyl acetate, acetaldehyde, acetic acid, carbon monoxide, aromatic hydrocarbons, and other compounds, can in principle be synthesized from ethanol [1–19].
The reaction network for catalytic transformation of ethanol includes parallel formation of ethylene and acetaldehyde via dehydration or dehydrogenation, respectively (Scheme 1). When the main desired product is ethylene, the suitable catalyst possibilities are typically acidic catalysts, such as, for example, zeolites and other solid acids. A comprehensive review on the production of ethylene from ethanol via dehydration was recently presented by Zhang et al. [6]. If the aim is to produce acetaldehyde or ethyl acetate from ethanol, catalysts containing Cu, Cr or Zn are promising [1,11]. It should be noted that ethyl acetate is formed from acetaldehyde and ethanol in a consecutive route.
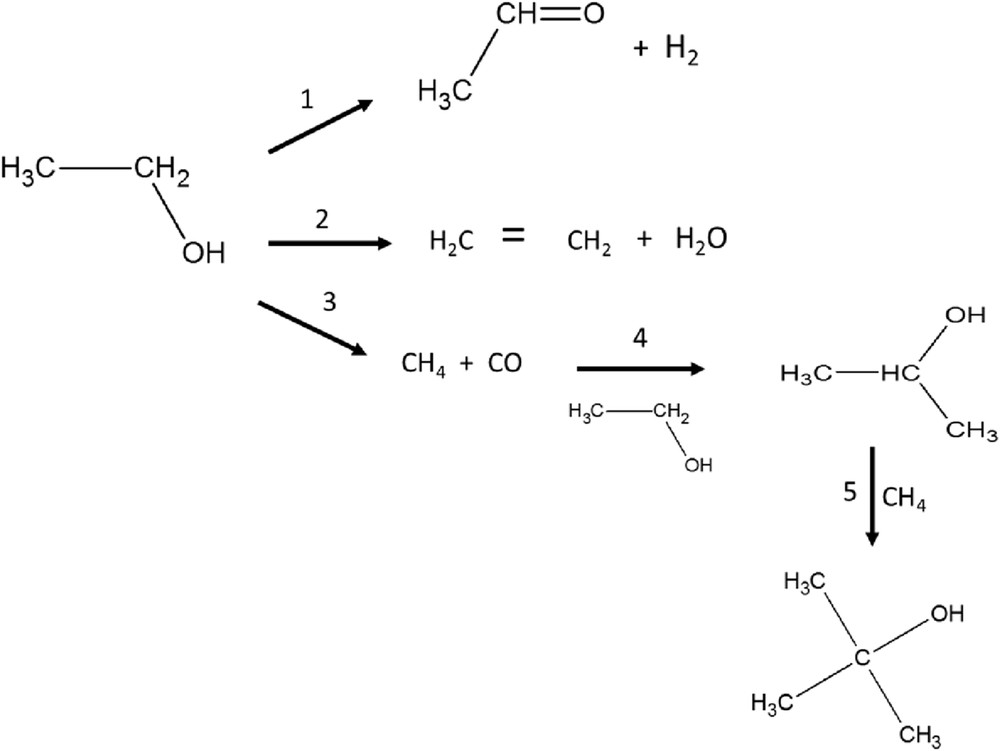
Transformation of ethanol by using the CuOCr2O3Al2O3 catalyst.
Ethanol dehydrogenation has been studied on several copper-supported catalysts, such as CuO/ZnO/Al2O3 [1], Cu/ZnO [7], and Cu/Cr2O3 [8]. Extensive research from ethanol dehydrogenation has already been performed in 1951 by Church et al. [10]. In their work, the best catalyst was CoCuCr supported on asbestos with 95% conversion of ethanol and 88% yield of acetaldehyde at 275–300 °C. The catalyst was also able to maintain its activity after periodic reactivation. The deposition of copper on a suitable support enhances its lifetime and activity due to a higher metal dispersion. In addition, if a supported copper catalyst is promoted with oxides of zinc, cerium, thorium and zirconium, a stable activity in a fixed bed reactor catalyst could be achieved [10].
In addition, the Cu/ZrO2 catalyst was very active and selective towards formation of ethyl acetate at 270 °C at atmospheric pressure [14]. It was also concluded that Lewis acidic Cu+ sites promote the formation of ethyl acetate from acetaldehyde. Typically, in the literature, reduced Cu-based catalysts have been used in ethanol dehydrogenation [1,8,11,13]. Monometallic Cu/Al2O3 catalysts applied in alcohol dehydrogenation at 295 °C suffered from rapid deactivation [20]. If chromium was added to this catalyst, it retained its activity for a longer time compared to the monometallic counterparts. It was also stated that sintering of Cu can be avoided by addition of chromium.
Ethanol dehydrogenation with industrial size pellets containing copper has been carried out previously in a few studies [1,12,13]. The main product was acetaldehyde (81 wt % of the products) obtained using 96.5 wt % Cu-3.5% Cr-containing supported silica catalyst beads of the size between 0.32–1.1 cm at 250 °C at atmospheric pressure [13]. Application of 2–3 mm carbon balls containing Cu and Al2O3 with the ratio of 6/1 promoted the formation of ethyl acetate [12]. Ethyl acetate was also the main product obtained with industrial size CuO/ZnO/Al2O3 and CuO/Cr2O3 catalysts at 200 °C at atmospheric pressure with 64% and 53% conversion at 9.5 h time-on-stream, when these catalysts were pre-reduced [1].
In this work, Cu-containing catalysts prepared by using the solution combustion method were tested for ethanol dehydrogenation. This method facilitates preparation of quite small particles typically in water solutions [21]. The idea is then to use an oxidizer, for example, metal nitrate together with fuel, such as glycine, urea or hydrazine and heat the solution at a higher temperature until it starts to burn [21]. The benefits of using the solution combustion method instead of conventional catalyst preparation methods are, for example, short synthesis time and possible inhibition of the growth of metal particles due to gas formation [22]. To the best of our knowledge, the solution combustion method has been used for preparation of CuO particles in very few publications [23–28].
The aim in this work was to prepare bimetallic oxide CuOCr2O3 or CuOZnO particles supported on industrial size alumina beads with the diameter of 3 mm. For comparison, the same type of catalysts was prepared by using the incipient wetness method together with monometallic CuO/Al2O3, ZnO/Al2O3 and Cr2O3/Al2O3 catalysts. Special emphasis was placed on advanced analytical methods for both gas and liquid phase products. Typically, in ethanol dehydrogenation, only condensable products have been analyzed [1,9,26,27] or in combination with online GC also, analysis of ethylene and diethyl ether was performed [7,8,14]. Surprisingly, to the best of our knowledge, analysis of hydrogen in the products formed during ethanol hydrogenation has been addressed only in one publication [10]. In this work, the analytical work was extended to account also for hydrogen and other gaseous products including CH4, CO and CO2, giving a more complete picture of the reaction network and related catalyst properties with their reactivity. Furthermore, catalyst stability as a function of time-on-stream was investigated, which is often overlooked because there are only few reports showing time-on-stream behavior in ethanol [1,10,13–15] and butanol [20] dehydrogenation. In several cases, the catalysts suffered substantial deactivation [1,10], whereas Cu/ZrO2 [14] and recalcined CuCr/Al2O3 [20] were rather stable.
The catalysts were characterized by using various physico-chemical methods, specific surface area was measured by using nitrogen adsorption, acidity by using pyridine adsorption desorption, ζ potential measurements were carried out in order to determine the surface properties in aqueous suspensions and scanning electron microscopy-energy dispersive X-ray analysis was performed to study the morphology and metal oxide distribution. The catalyst properties were correlated with their preparation method in order to understand a possible industrial relevance of the solution combustion method in catalyst preparation and the use of these catalysts in ethanol dehydrogenation in continuous operation with industrial size catalyst beads. It should also be pointed out that while the results might thus be affected by mass transfer limitations, on the other hand, they have also practical importance.
2 Experimental section
2.1 Catalyst preparation
The catalysts were denoted with Roman numbers I: 1 wt % CuO/Al2O3, II: 1 wt % ZnO/Al2O3, III: 1 wt % Cr2O3/Al2O3, IV: 3 wt % CuO/Al2O3, V: 3 wt % CuO + 2 wt % ZnO/Al2O3, VI: 3 wt % CuO+2 wt % Cr2O3/Al2O3 were prepared by impregnating a carrier (γ-Al2O3, specific surface area of 190 m2/g, diameter of 3.2 mm) in aqueous solutions of (Cu(NO3)2·6 Н2О (technical standard Т4163-68, Belarussia, Minsk), Cr(NO3)3·9 Н2О (technical standard 4471-78) and Zn(NO3)2·6 H2О) (Russia).
The solution combustion method was also used for preparation of such catalysts as VII: CuО-ZnО/γ-Al2O3 (sc) and VIII: CuОCr2О3/γ-Al2O3(sc) in aqueous solutions containing Cu(NO3)2·6 Н2О (Т4163-68, Belarussia), Cr(NO3)3·9 Н2О (4471-78), Zn(NO3)2·6 H2О) (Russia) and 0.5 wt % glycine as a fuel. The same alumina support, as mentioned above, was used. In both methods, the catalysts were thermally treated in three stages: 1) at room temperature for 10–12 h, 2) at 200 °C for 1–1.5 h and 3) at 500 °C for 2 h. In this preparation method, 200 °C has been selected, since the autoignition temperature for copper and chromium nitrates has been reported to be close to 170 °C with glycine [29] and for copper nitrate-glycine to be 190 °C [22].
For the catalysts, which were not reduced prior to ethanol dehydrogenation, the following notation was used: ex-MxOy for catalysts containing one metal oxide and ex-MixMjyOz for multicomponent catalysts.
2.2 Catalyst characterization
2.2.1 Temperature-programmed reduction
Temperature-programmed reduction was carried out using a USGA-101 set-up, consisting of a gas preparation system with a tubular reactor furnace and a thermal conductivity detector. Hydrogen regeneration was carried out by passing the gas mixture (5 vol % H2 and 95 vol % Ar) through the reactor at a flow rate of 30 ml/min. The temperature was increased at a linear heating rate of 10 °C/min. The change in hydrogen concentration was monitored using a thermal conductivity detector.
2.2.2 Scanning electron microscopy
Morphology of the catalysts was investigated with electron microscopy (Guanta 200i 3D (FEI Company, USA)). In addition, some selected samples were investigated with a Zeiss Leo 1530 Gemini for EDX analysis.
2.2.3 Zeta potential measurements
The ζ potential measurements were performed with a Zetasizer Nano ZS (Malvern Instruments) using light scattering technique. A potentiometric method (MPT-2) was applied for pH determination. The sample concentration was varied from 2 to 4 mg/ml in de-ionized water. NaOH and HCl were used as titrants.
2.2.4 FTIR pyridine adsorption-desorption
The powdered catalyst was used for quantification of Brønsted and Lewis acid sites, respectively when applying pyridine (>99.5%) as a probe molecule in its adsorption and desorption by using FTIR (Ati Mattson FTIR). The desorption was performed at 150 °C, 250 °C and 350 °C in order to determine also amounts of weak, medium and strong acid sites. The quantification of Brønsted and Lewis acid sites was based on intensities of peaks at 1590 and 1450 cm−1, respectively and the extinction factors determined by Emeis [30].
2.2.5 CO2 TPD
CO2 TPD was performed by using a Micromeritics AutoChem 2910 according to the following procedure: the catalyst (250 mg) was dried in a helium flow, heated at the rate of 30 °C/min to 300 °C for 10 min and subsequently cooled to room temperature. Thereafter, CO2 (AGA, 99.99%) was adsorbed for 60 min, followed by flushing the catalyst for 30 min with helium. TPD was carried out with heating from 25 °C at the rate of 20 °C/min to 900 °C and recording the desorbed CO2 (m = 44) with a mass spectrometer (Balzers Instrument).
2.2.6 Nitrogen adsorption
The specific surface areas and pore volumes of the catalysts were determined by nitrogen adsorption using a Sorptometer M (Katakon, Russia).
2.2.7 XPS measurements
XPS measurements were performed with a PerkinElmer PHI 5400 spectrometer with a Mg Kα X-ray source operating at 14 kV and 200 W was used in the XPS-analysis of the samples. The pass energy of the analyzer was 17.9 eV and the energy step was 0.1 eV. Peak fitting was performed with the program XPS Peak 4.1. The background was corrected with the Shirley function. The binding energy calibration was based on the Al 2p peak at 74.5 eV.
2.2.8 XRD measurements
The X-ray diffraction measurements were performed with a Philips X'Pert Pro diffractometer using Cu K, 0.04 rad Soller slits, a Ni filter, and a PiXel 1D detector. The samples were gently ground to powder and a plastic sample holder was used to avoid interfering peaks from the sample holder. Each measurement scanned the two range of 30–110° with a step size of 0.03° and 60 s integration time per step. The phases were identified using the HighScore program and the Crystallography Open Database [31]. The particle sizes were determined by using the Maud Rietveld refinement program [32].
2.3 Catalyst activity tests
2.3.1 Reactor setup
Catalyst activity tests in ethanol transformation were carried out with an automated flow catalytic unit (PKU-2). The setup includes the gas flow controller, a liquid pump, a reactor, an evaporator, a switch, a separator and a control unit (Fig. 1).
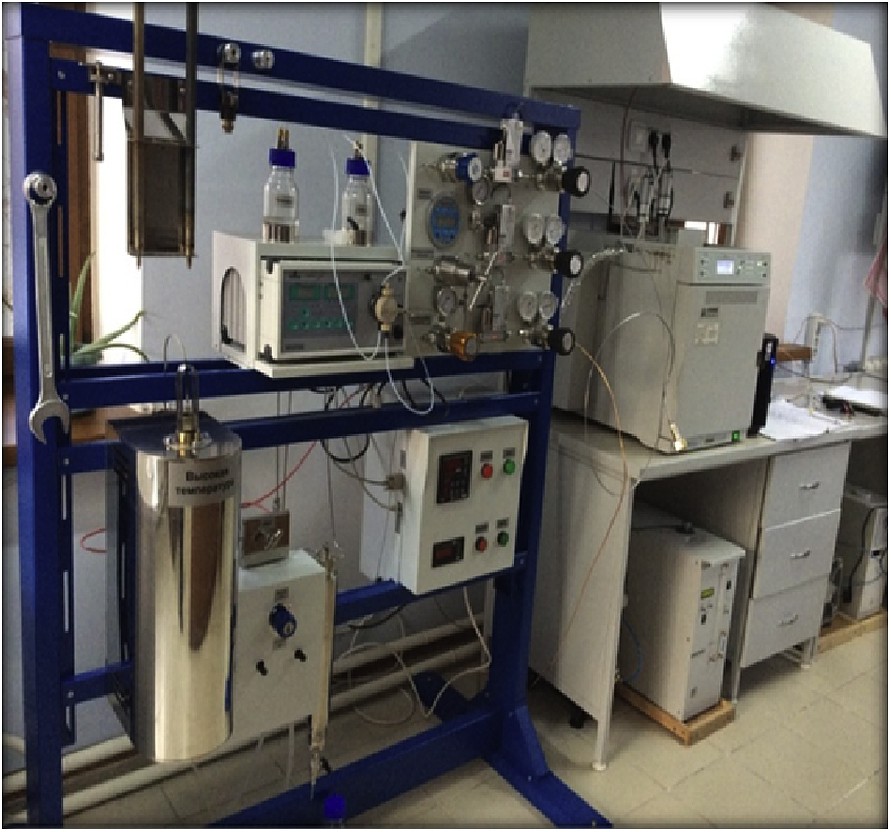
An automated reactor system.
The reactor made of stainless steel was placed vertically. The stream from the evaporator was fed upwards and passed through the container and the reactor tube (length – 335 mm, diameter – 12.5 mm) containing the catalyst. The gases from the outlet of the reactor passed to a separator, wherein a part of the flow was routed through the metering valve and a heated line into the chromatograph for analysis. The catalytic tests were performed with WHSV in the range of 0.5–1.5 h−1 and a temperature interval of 150–350 °C. The flow rate of ethanol was 2 ml/h and the experiments were carried out without an inert gas. The reactor was first filled with a layer of fine quartz followed by a 2 ml layer of the catalyst and a thin layer of quartz.
2.4 Analysis of the reaction mixture
The reaction products were identified with “GC-1000 chromosome” using an external calibration method and a thermal conductivity detector, facilitating the analysis of CO and CO2. The separation of components was carried out in two columns (length – 2 m, internal diameter – 3 mm) filled with NaX zeolite and Porapak-T, using helium and argon as carrier gases, respectively. The analysis of the liquid phase was carried out every 30 min and for gases at the reaction temperature, every 15 min. The liquid phase was analyzed using a capillary column (25 m × 0.32 mm) filled with an adsorbent, XSEP, facilitating the analysis of alcohols and aromatic hydrocarbons (methanol, ethanol, acetaldehyde, propanol, ethyl acetate, benzene, isobutanol, toluene, ethylbenzene, xylenes and hexanol). The column temperature was varied between 100 and 230 °C (ramping rate 10 °C/min), detector and injector temperatures were 300 °C and 200 °C, respectively. The following gas flow rates were used: argon – 10 ml/min, hydrogen – 20 ml/min and air – 400 ml/min.
For analyzing C1C5 hydrocarbons, a packed column (2 m × 3 mm) with a carbon adsorbent was used. The temperature was increased from 50 to 240 °C (ramping rate – 20 °C/min) and injector and detector temperatures were 200 °C and 250 °C, respectively. The gas flow rates were as mentioned above for C1–C5 hydrocarbons analyses. For analysis of hydrogen and oxygen, a packed column (1 m × 2 mm) containing an adsorbent CaA was used. The temperature was increased from 50 to 240 °C (ramping rate – 20 °C/min). The injector and detector temperatures were 200 °C and 250 °C, respectively. The following gas flow rates were used: argon – 20 ml/min, hydrogen – 20 ml/min, air – 200 ml/min.
The molar fractions of carbonaceous products were analyzed by normalizing their amounts. The selectivity of different carbon containing products was calculated taking into account the carbon balance, which is similar to the work of Santacesaria et al. [1]. This means that, for example, in calculations of selectivity to CO, the stoichiometry (e.g., 2 mol of CO per 1 mol of ethanol) was taken into account.
3 Results
3.1 Catalyst characterization results
3.1.1 Specific surface areas of the catalysts
Specific surface areas of the investigated catalysts are listed in Table 1. Specific surface areas are in most cases only slightly lower than the values reported for the γ-Al2O3 support, being 200 m2/gcat. It is noteworthy that the catalysts prepared by using the solution combustion method exhibited 5–8% lower specific surface areas than the ones prepared by using the incipient wetness method.
Specific surface areas and pore volumes of the catalysts. Note: sc is solution combustion.
| Catalyst name | Catalyst | Specific surface area (m2/gcat) | Pore volume (ml/gcat) |
| I | 1 wt % CuO/γ-Al2O3 | 176 | 0.075 |
| II | 1 wt % ZnO/γ-Al2O3 | 211 | 0.090 |
| III | 1 wt % Cr2O3/γ-Al2O3 | 191 | 0.082 |
| IV | 3 wt % CuO/γ-Al2O3 | 175 | 0.075 |
| V | 3 wt % CuO+2 wt % ZnO/γ-Al2O3 | 173 | 0.074 |
| VI | 3 wt % CuO+2 wt % Cr2O3/γ-Al2O3 | 177 | 0.076 |
| VII | 3 wt % CuO+2 wt % ZnO/γ-Al2O3 (sc) | 159 | 0.068 |
| VIII | 3 wt % CuO+2 wt % Cr2O3/γ-Al2O3(sc) | 168 | 0.072 |
3.1.2 Morphology of the catalysts and metal oxide particle sizes
SEM images of catalyst beads showed that the largest catalyst particles on the surface are of irregular shape and are about 20 μm in diameter (Fig. S1). Most of the particles on the catalyst bead were, however, much smaller. The grain boundaries on the surface of the catalyst VIII prepared by using solution combustion looked more smooth compared to the case for catalyst VI prepared by using the incipient wetness method indicating some surface modifications during catalyst VIII preparation, which was a result of exposure to high temperatures.
Particle sizes with ex-MixMjyOz catalysts (VI and VIII) were mainly in the range of 2–8 nm, although smaller particles can also be seen in the micrographs (Fig. 4). TEM images revealed that there were also quite large ex-MixMjyOz particles present in catalyst VIII indicating that the combustion temperature was high enough to enable sintering of the metal oxide particles. In addition, it has also been stated in Ref. [22] that the morphology and the surface metal concentration of the catalyst prepared by using the solution combustion method depend on the fuel to oxidizer molar ratio. It has been reported that if there is an excess of glycine the combustion temperature increases, which can in turn increase the metal particle size [22]. In addition, this ratio affects the amount of gas evolved, which is decisive for determining the porosity of the material.
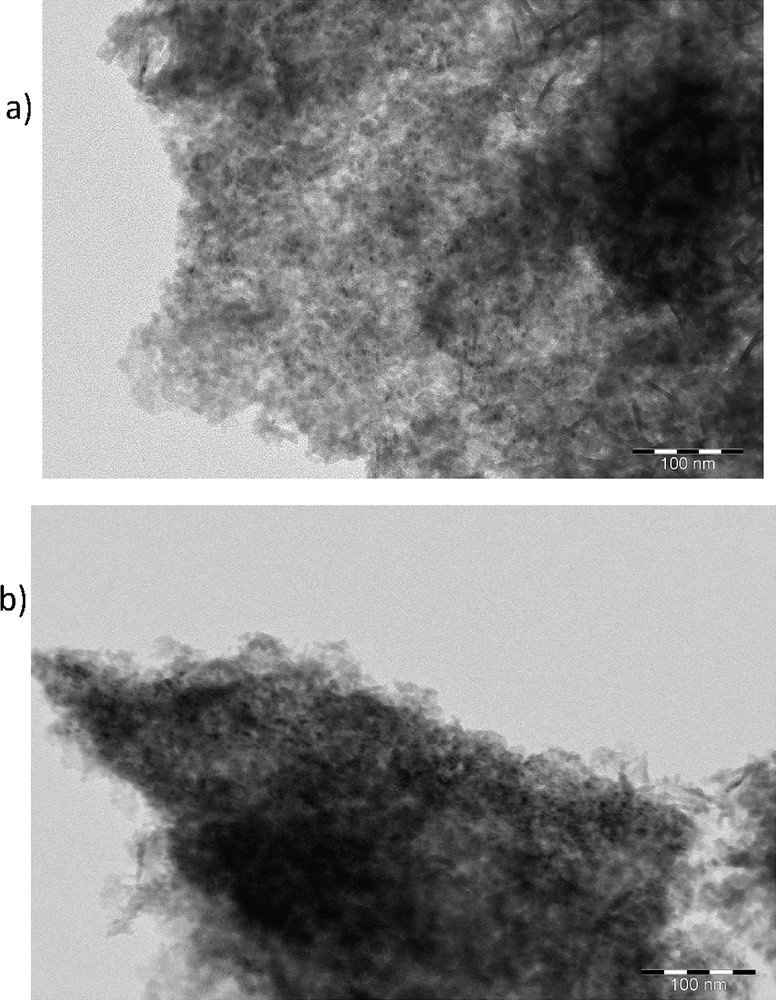
TEM image of (a) VI: CuOCr2O3/Al2O3 and VIII: CuOCr2O3/Al2O3 (sc).
3.1.3 SEM-EDXA analysis of the catalysts
SEM-EDXA analysis from the outer surface of the catalyst beads showed that the amounts of Cu and Cr for catalyst VIII were 6.6 wt % and 2.2 wt %, respectively whereas for catalyst VI, these were both close to 2.5 wt % and 1.5 wt %, respectively. These values show clearly that some enrichment of Cu and Cr has occurred when the catalyst was prepared by using the solution combustion method, whereas close to the nominal loading was found for the catalyst prepared by using the incipient wetness method. When the cross-section surface of the bead was investigated, the surface mapping analysis showed that the amounts of Cu and Cr were close to each other, while they were not fully homogeneously spread across the surface (Fig. 2a–d). The amounts of Cu and Cr were determined in the cross-section surface of the bead (Fig. 3), showing that both copper and chromium were present in larger amounts in the catalyst prepared with glycine than in that without it. Furthermore, the Cu: Cr ratio was 1.7 for the catalyst prepared with glycine, while this ratio was only 1.0 for the catalyst prepared without glycine. The depth profiles of these ex-MixMjyOz were, however, quite constant. These results indicate that some surface enrichment of copper oxide has occurred with the solution combustion method, most probably due to high temperatures.
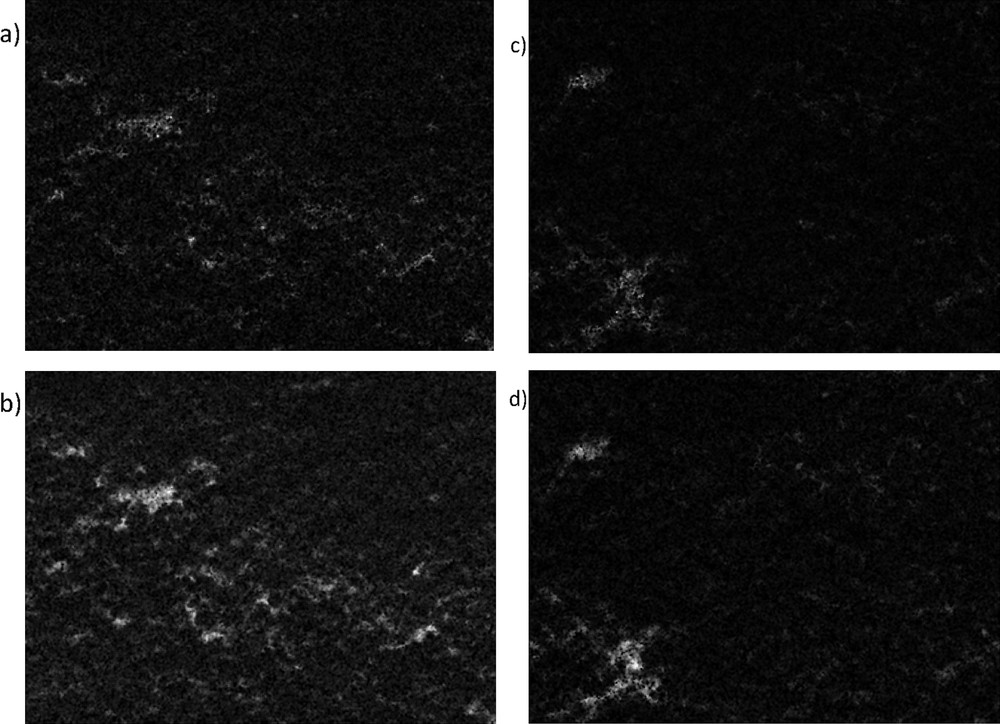
SEM-EDXA images of the mapping of (a) Cr and (b) Cu from VIII: CuOCr2O3Al2O3 (sc) catalyst and of (c) Cr and (d) Cu from VI: CuOCr2O3Al2O3. Note: the brighter colour is, the higher is the ex-MixMjyOz content.
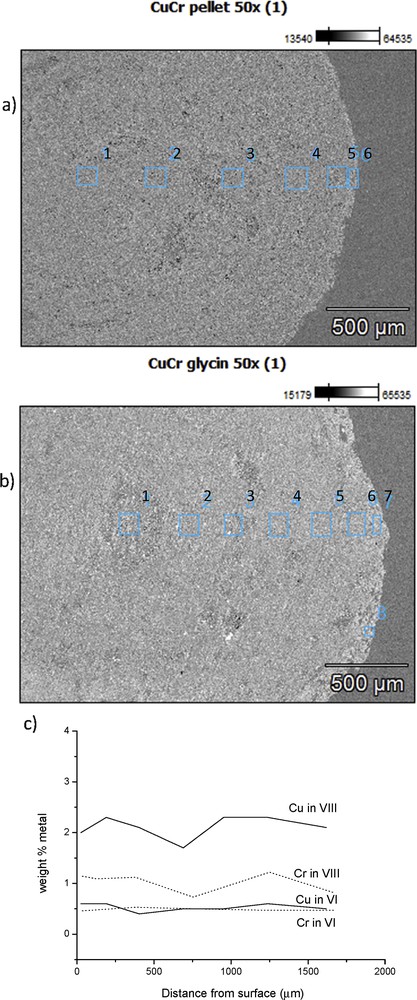
(a) SEM images of the cross-section of a) VIII: CuOCr2O3/Al2O3 (sc), (b) VI: CuOCr2O3/Al2O3 and (c) ex-MixMjyOz content from different distances from the surface for chromium (dotted line) and copper (solid line) for VIII: CuOCr2O3/Al2O3 (sc) and VI: CuOCr2O3/Al2O3 catalysts.
3.1.4 XRD results of the catalysts
The formation of copper chromite, which was also confirmed by using XRD, is explained by the fact that during solution combustion the temperature increased to 500 °C, since the CuCr/Al2O3 catalyst with glycine had the molar ratio of fuel to oxidant (F/O) equal to 0.97 according to the valency calculation.
Fibrous structures of the support material are visible in TEM images. XRD results, discussed below, point out on the formation of the η-alumina phase. The fibrils are composed of gelatinous boehmite or pseudoboehmite, which is the precursor for -Al2O3, obtained by thermal dehydroxylation of boehmite [33,34]. The formation of η-Al2O3 from boehmite starts above 520 °C [35]. XRD results showed also the presence of η-alumina (see below), which is expected due to the high calcination temperatures used in this study.
The X-ray diffraction patterns for all samples together with the Rietveld fits are shown in Fig. 5 and Table 2. The major phase in all samples was face centered cubic η-Al2O3, which is in line with the results visible in TEM images showing fibrous structures of boehmite and synthesis of η-alumina via thermal decomposition of poorly crystalline boehmite [36]. XRD data revealed that η-alumina was found on the outer layer of the catalyst balls. The lattice parameter a was close to 0.798 nm, which is in accordance with the literature [37]. Furthermore, the crystal size of η-Al2O3 was close to 10 nm corresponding to the values reported in the literature [37] except for ex-MixMjyOz catalysts, in which the crystal sizes were slightly smaller. In addition to the η-Al2O3 phase, another Al2O3 phase, namely M-η-Al2O3 was found. This phase exhibited greater lattice parameter values, about 0.81 nm, compared to that of η-Al2O3, which is most probably due to the partial substitution of some Al by Cr, Cu and Zn in the outer surface of the catalyst grains. The substituted crystals had smaller crystalline sizes between 2.4–4.4 nm than the neat η-Al2O3 crystals. These crystals are also clearly visible in TEM images. Large copper chromite crystals were present in catalysts VII and VIII according to XRD, which is in line with a high hydrogen consumption found in TPR for this catalyst (Fig. 6 and Table 3). As already mentioned, copper chromite is catalytically active in ethanol dehydrogenantion [1]. The absence of any other ex-MixOy crystal, such as CuO, ZnO or Cr2O3 in the catalysts indicates that if present they are highly dispersed being below the detection limit of XRD. On the other hand, the presence of copper and chromium oxides was also confirmed by using XPS (Fig. 7).
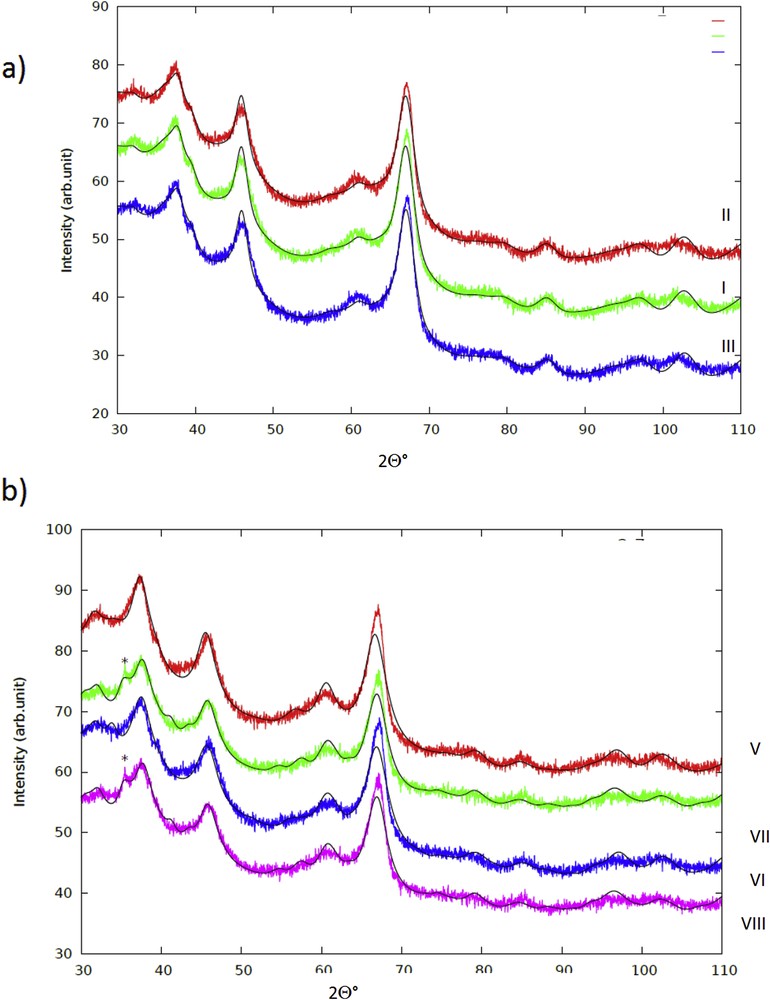
XRD of (a) I: CuO/Al2O3, II: ZnO/Al2O3 and III: Cr2O3/Al2O3 and (b) V: CuOZnO/Al2O3, VI: CuOZnO/Al2O3, VII: CuOZnO/Al2O3 (sc), and VIII: CuOCr2O3/Al2O3 (sc). The peak indicating CuCr2O4 in the glycine samples is marked with an asterisk.
Crystallite phases and their sizes determined by XRD. Note: I: one wt % CuO/γ-Al2O3, II: one wt % ZnO/γ-Al2O3, III:1 wt % Cr2O3/γ-Al2O3, IV: three wt % CuO/γ-Al2O3, V: three wt % CuO+2 wt % ZnO/γ-Al2O3, VI: three wt % CuO+2 wt % Cr2O3/γ-Al2O3, VII: three wt % CuO+2 wt % ZnO/γ-Al2O3 (sc), and VIII: three wt % CuO+2 wt % Cr2O3/γ-Al2O3(sc).
| Phase | I | II | III | V | VI | VII | VIII | |
| η-Al2O3 | a (nm) | 0.7899 | 0.7893 | 0.7899 | 0.79106 | 0.78959 | 0.7909 | 0.7901 |
| d (nm) | 9.72 | 9.59 | 9.51 | 7.30 | 7.97 | 9.40 | 7.40 | |
| M-η Al2O3 | a (nm) | 0.8075 | 0.8049 | 0.8075 | 0.8094 | 0.8086 | 0.8090 | 0.8116 |
| d (nm) | 2.57 | 2.63 | 2.75 | 2.90 | 2.39 | 4.38 | 2.48 | |
| CuCr2O4 | a (nm) | – | – | – | – | – | – | 0.840 |
| d (nm) | – | – | – | – | – | – | 54.02 | |
| Goodness of fit | ||||||||
| Rwp | 4.45877 | 4.49755 | 4.46000 | 3.77454 | 3.98883 | 3.68461 | 3.10905 | |
| Rexp | 2.55027 | 2.59546 | 2.59933 | 2.21187 | 2.21797 | 2.68949 | 2.16731 | |
| Goodness of fit | 1.74835 | 1.73285 | 1.71583 | 1.70649 | 1.79842 | 1.37000 | 1.43452 |
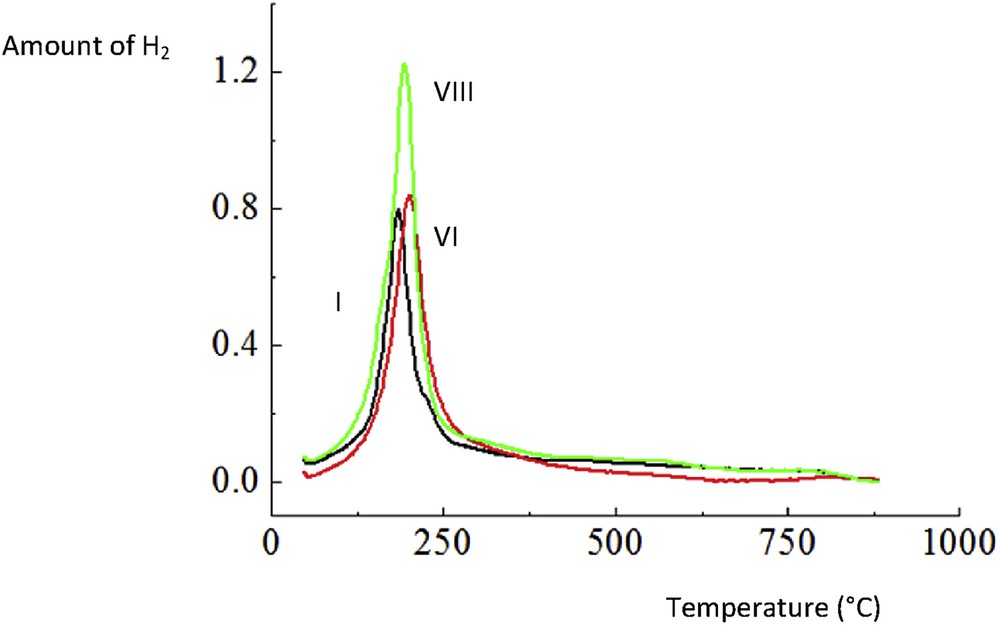
Hydrogen TPR of I. CuO/Al2O3, VI. CuOCr2O3/Al2O3 and VIII. CuOCr2O3/Al2O3 (sc).
Results from the temperature-programmed reduction and the determination of acidities by using pyridine adsorption desorption and pH at pzc for different catalysts. Notation is the same as in Table 2.
| Catalysts | Тmax | The amount of adsorbed hydrogen | Desorption temperature | pzc | ||
| °С | mol/g cat. | 423 K | 523 K | 723 K | ||
| μmol/g-Lewis acid sites | ||||||
| I | n.m. | n.m. | 58 | 19 | 0 | 8.4 |
| II | n.m. | n.m. | 78 | 20 | 2 | 10.2 |
| III | 184 | 237 | 98 | 36 | 7 | 9.1 |
| IV | n.m. | n.m. | 82 | 79 | 0 | 9.5 |
| V | n.m. | n.m. | 84 | 74 | 0 | 9.6 |
| VI | 200 | 340 | 171 | 120 | 0 | 9.8 |
| VII | n.m. | n.m. | 86 | 90 | 0 | 9.8 |
| VIII | 195 | 373 | 156 | 129 | 0 | 9.9 |
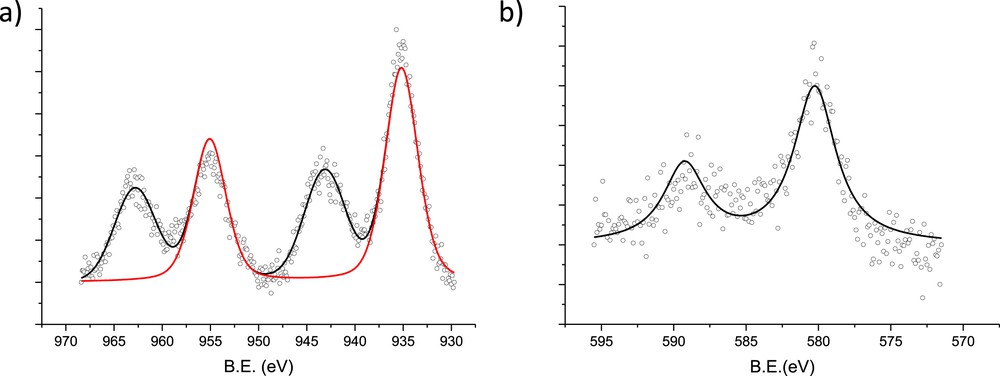
XPS spectra of (a) Cu 2p and (b) Cr 2p for the CuOCr2O3/Al2O3 (sc) catalyst VIII.
3.1.5 XPS results of selected catalysts
XPS results show the Cu 2p spectrum with a Cu 2p3/2 peak at approximately 935 eV (red line) and two satellites (Fig. 7). Based on the literature [9,38], the copper present in the sample is most likely Cu2+ located in tetrahedral sites of CuCr2O4. The XPS spectra for Cr 2p are displayed in Fig. 2. The Cr 2p peak is located at a higher binding energy than those reported in literature [9] for similar catalysts. The chromium peak at approximately 580 eV could be Cr6+, as reported in literature [39,40]. The presence of Cr3+ cannot be completely ruled out; however, a fairly noisy character of XPS for Cr2p prevents a reliable assessment of its contribution.
3.1.6 Hydrogen TPR results
Hydrogen TPR results show that the amount of consumed hydrogen for catalyst VIII was 1.6 fold that of catalyst VI (Table 3, Fig. 6). In addition, it was also about 10% higher than that for the same catalyst prepared in the absence of glycine. Analogous to this work, it has been observed by Santacesaria et al. [1] that the copper chromite spinel catalyst was more reducible than, for example, a mixed oxide CuOZnOAl2O3 catalyst. For catalyst IV, the maximum for hydrogen consumption was obtained at ca. 185 °C, reflecting reduction of copper oxide to metallic copper [41]. Modification of the CuO/γ-Al2O3 catalyst with chromia leads to a slight increase in the peak intensity with Tmax = 205 °C. For catalyst VIII, the maximum consumption of hydrogen was achieved at 195 °C. Utilization of the Al2O3 support was reported to facilitate better dispersion of copper chromite [42].
3.1.7 Acidity and pzc of the catalysts
Acidity was determined by gas phase adsorption-desorption of pyridine. In addition, the pzc of different catalysts, related to the electroneutrality on the catalyst surface at certain pH in water solutions was determined. The surface is positively charged if pH is lower than pzc and negatively charged when the pH is higher than pzc [43]. This characterization is important, for example, in the preparation of industrial size catalysts and in catalyst shaping [44]. Moreover, a certain correlation was observed between acidity and pzc [45], which will be explored in this work.
The relative amounts of acid sites were determined by using pyridine adsorption-desorption revealing that the most acidic was catalyst VI followed by catalyst VIII (Table 3). This result is interesting since the pzc of Cr2O3 is rather low. It has, however, been reported that Cr3+ increases Lewis acidity. [46,47] Cu loading increased the amount of Lewis acid sites as well pzc values, as will be explained below.
ζ potential curves as a function of pH were measured for Al2O3 as well as for all ex-MixOy-supported catalysts (Table 3, Fig. 8a). For alumina, the pzc was close to 8.2, which corresponds to the literature value of 8.8 [48]. The point zero charge for catalyst I supported on alumina was only slightly higher than that of alumina, even if the pzc of CuO per se is rather high, being 9.4 [49]. On the other hand, the pzc for catalyst II with low loading of ZnO was quite high, when comparing it to the pzc value for ZnO nanoparticles per se equal to 9.3 [50]. The value of pzc for catalyst III was also high in comparison with pzc for Cr2O3 7.0–7.9 mV [51,52]. Thus, it can be concluded that pzc values cannot be directly correlated to the mass fraction of added ex-MixOy.
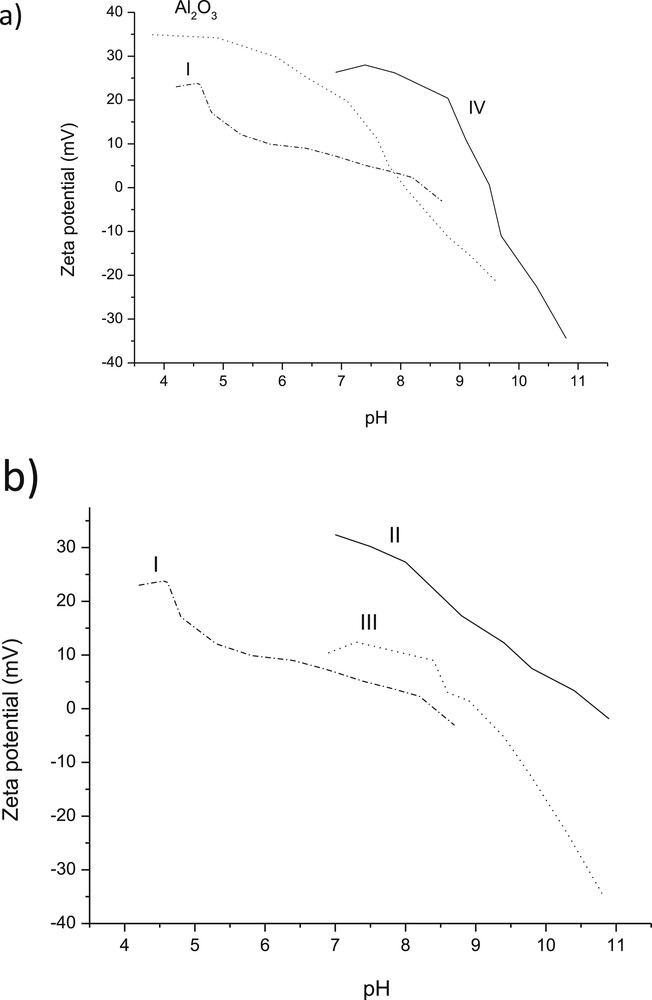
Ζ potential as a function of pH for (a) Al2O3, I: 1 wt % CuO/Al2O3 and IV: 1 wt % CuO/Al2O3 and (b) for Al2O3, I: 1 wt % CuO/Al2O3, II: 1 wt % ZnO/Al2O3 and III: 1 wt % Cr2O3/Al2O3.
The effect of the ex-MixMjyOz loading on pzc is visible for CuO/Al2O3, for which both 1 wt % and 3 wt % loading were used. The corresponding pzc values are 8.4 and 9.5, respectively indicating that even a small addition of CuO increased substantially the pzc value of catalyst IV.
For multicomponent ex-MixMjyOz catalysts, prepared in the absence or presence of glycine, namely V and 3 wt % VI (Fig. 9), the pzc values were in the range of 9.6–9.9. The pzc values for catalyst VI was quite close to that of catalyst IV. It was also interesting to observe that ζ potential curves as a function of pH were slightly shifted towards higher pH when glycine was present during catalyst preparation.
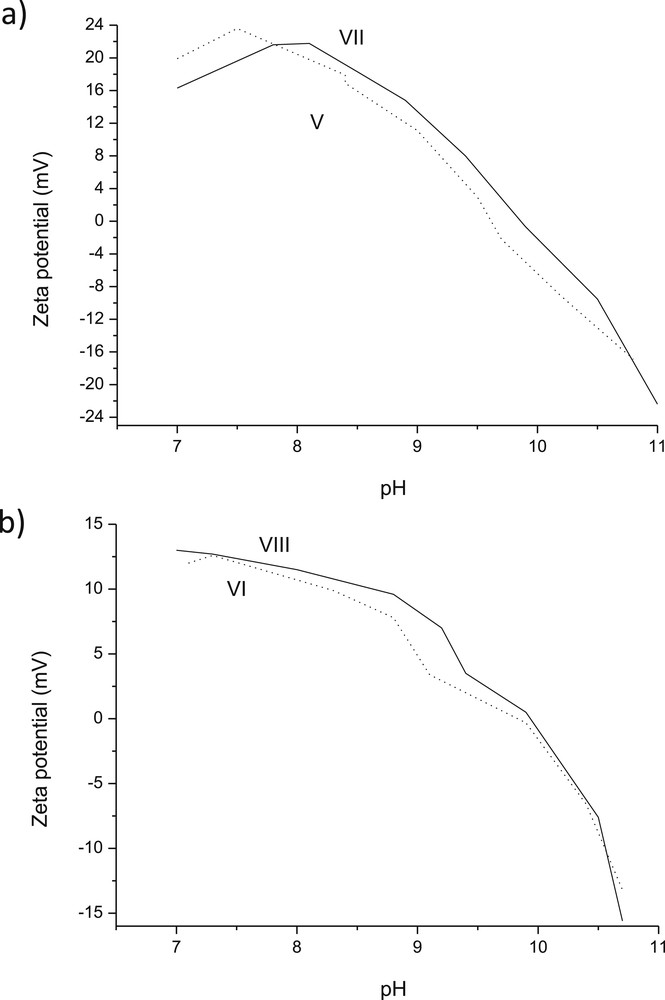
Ζ potential as a function of pH for (a) V: 3 wt % CuO 2 wt % ZnO/Al2O3 and VII: 3 wt % CuO-2 wt % ZnO/Al2O3 (sc) (b) VI: 3 wt % CuO-2 wt % Cr2O3/Al2O3 and VIII: 3 wt % CuO-2 wt % Cr2O3/Al2O3 (sc).
The pH for pzc of all catalysts was also plotted against the amount of Lewis acid sites (Fig. 10). This graph shows that, with a higher acidity, the pzc values are higher, which is in line with the suggestion [45] that pzc reflects the acidity of oxide materials in aqueous environments.
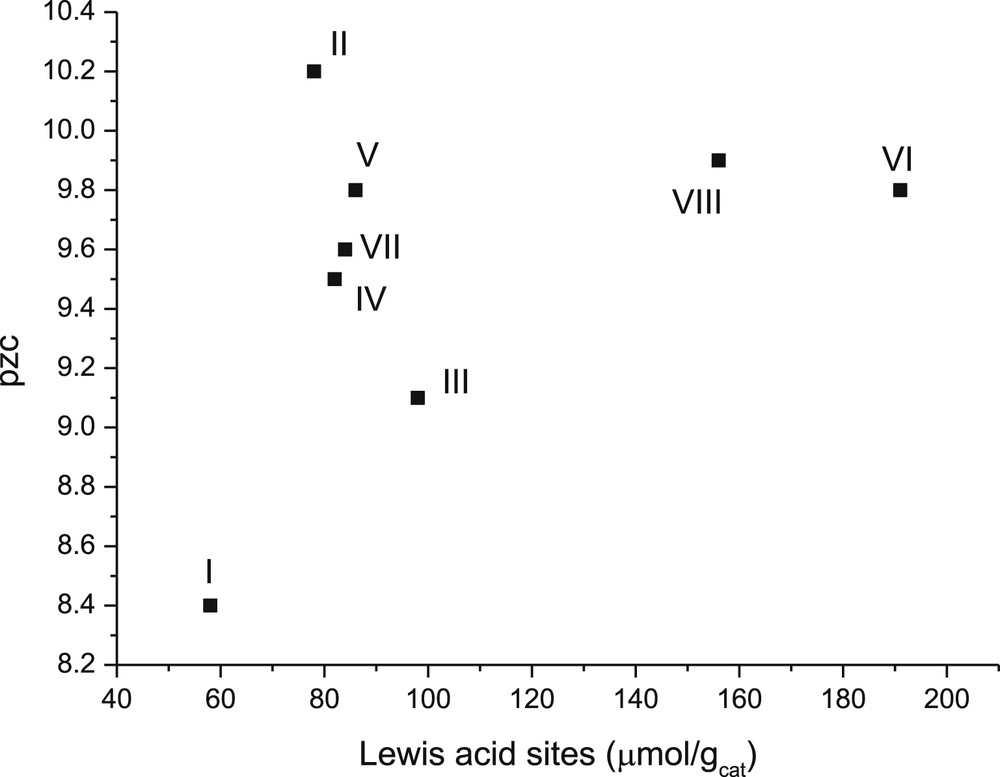
Point zero charge versus concentration of Lewis acid sites in the studied catalysts. Notation: I: 1 wt % CuO/γ-Al2O3, II: 1 wt % ZnO/γ-Al2O3, III:1 wt % Cr2O3/γ-Al2O3, IV: 3 wt % CuO/γ-Al2O3, V: 3 wt % CuO+2 wt % ZnO/γ-Al2O3, VI: 3 wt % CuO+2 wt % Cr2O3/γ-Al2O3, VII: 3 wt % CuO-2 wt % ZnO/γ-Al2O3 (sc), and VIII: 3 wt % CuO+2 wt % Cr2O3/γ-Al2O3(sc).
In addition, Lewis acidity changed only slightly when pzc for the catalysts decreased in the following order: II > V > VII > VI > III. This result indicates that the catalyst containing Zn exhibited a higher pzc value.
3.1.8 CO2 TPD results of selected catalysts
The relative amounts of basic sites determined by CO2 TPD for VII and VIII catalysts show that the former catalysts exhibited 10% higher basicity compared to that of VIII (Fig. 11). It can also be noted that most of the basic sites are weak and medium strong, according to ref. [53]. The results showed that catalyst VII exhibited 10% more basic sites than VIII, which is in accordance to the literature confirming the basicity of zinc oxide [26]. In addition, the former catalyst has more weak basic sites, compared to the latter.
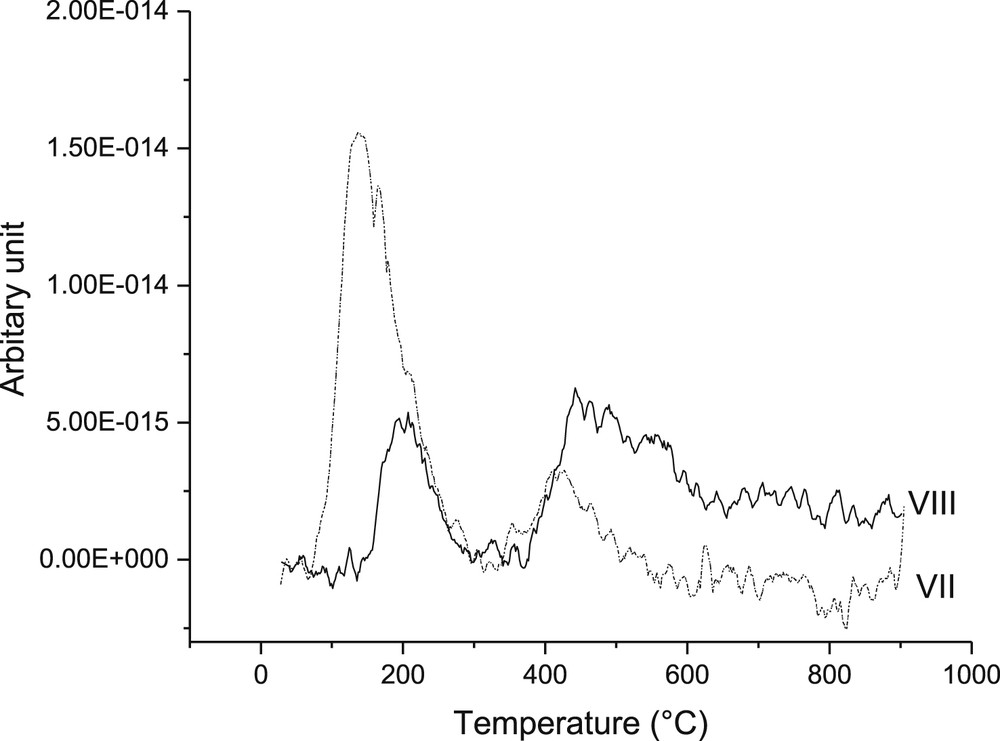
CO2 TPD of VII and VIII catalysts showing weak, medium and strong basic sites.
3.2 Catalytic results
3.2.1 Effect of WHSV on ethanol dehydrogenation
In the preliminary experiments, ethanol conversion was investigated with different WHSV levels at 300 °C using the multicomponent catalyst VIII. The results revealed that the highest conversion was obtained with a WHSV of 1 h−1, which was used for further studies.
3.2.2 Ethanol conversion and catalyst stability in ethanol dehydrogenation with different catalysts
Ethanol conversion obtained for ex-MixOy catalysts containing 1 wt % of metal increased in the following order: II < I < III (Table 4). As expected, it was observed that with increasing copper loading higher conversion was achieved. It has been previously stated in the literature that ZnO is highly basic and prone to catalyst deactivation,[15] thus giving a low conversion. In addition, due to a relatively high reaction temperature (300 °C), ex-MixOy catalysts can be sintered. TPR results for catalyst III can be related to a lower conversion level compared to catalysts VI and VIII, as discussed below.
Ethanol conversion and product distribution at steady state after 15 h time-on-stream in its transformation at 300 °C and with WHSV = 1 h−1. Notation is the same as in Table 2.
| Catalyst | Conversion (%) | C2H4 | Acetaldehyde | CH4 | CO | CO2 | Isobutanol | H2 | H2O | Other products | Loss |
| I | 25 | 24 | 32 | 0.8 | 5.2 | 2 | 0 | 36 | 0 | Traces | 0 |
| II | 10 | 40 | 10 | 1.4 | 10 | 4.7 | 0 | 30 | 0.9 | Traces | 3 |
| III | 44 | 34 | 4.5 | Traces | 6.6 | 0.5 | 0 | 12 | 2.4 | 13% isopropanol, 27% C4 gaseous products | Traces |
| IV | 56 | 44 | 14 | 0.1 | 6 | 3 | 3 | 17 | 0.40 | 2% C3 and 10% C4 gaseous products, 2% liquid productsa | <1 |
| V | 75 | 0.5 | 20 | 0.3 | 2.7 | 0.7 | 5.3 | 66 | 0.5 | Traces | 4 |
| VI | 67 | 0.9 | 22 | 0.2 | 5 | 16 | 7 | 37 | 0.9 | 2% C4 gaseous products, 8% liquid productsa | 1 |
| VII | 78 | 0.9 | 25 | 0.2 | 4 | 1.2 | 2.5 | 61 | 0.8 | Traces | 5 |
| VIII | 55 | 0.3 | 50 | 0.1 | 5.5 | 3.8 | 8 | 32 | 0 | Traces | 0.3 |
For the multicomponent catalysts, a highest conversion was achieved with VII followed by V. The catalyst VII exhibited the highest Lewis acidity. On the other hand, the Lewis acidity of V was rather low, thus the conversion levels cannot be directly correlated only with Lewis acidity. The multicomponent catalyst VII exhibited conversions higher than VIII. Interestingly also, conversion for catalyst VIII was rather low, even if it showed a high hydrogen uptake in TPR (Table 3). This catalyst according to XRD contained also large CuCr2O4 particles, which apparently are not catalytically very active. The ex-MixMjyOz particle sizes visible in TEM showed also that slightly smaller particles were present in the catalyst prepared by using the incipient wetness method.
Longer catalyst stability tests were performed for four catalysts, I, III, VI and VIII, which were able to retain their initial activity during the whole duration of the experiments, lasting 15 h (Fig. 12). This result is very promising, since, for example, rapid catalyst deactivation occurred for CuOZnOAl2O3 in ethanol dehydrogenation at 200 °C at 20 bar nitrogen [1]. On the other hand, Cu/ZrO2 showed a stable performance during 4 h time-on-stream in ethanol dehydrogenation at 270′C at 1 bar [14]. According to the literature, the main reason to use multicomponent Cu-catalysts is to increase the stability of the catalyst against sintering [20]. The current results are also showing relatively low conversion levels for catalyst I although it was stable with time-on-stream between 1 and 15 h. Initial catalyst deactivation (not depicted in the picture) is in line with the previous work [20], in which intensive catalyst deactivation using Cu/Al2O3 is clearly visible in butanol dehydrogenation at 290 °C, whereas only slight deactivation occurred in the multicomponent catalyst [20].
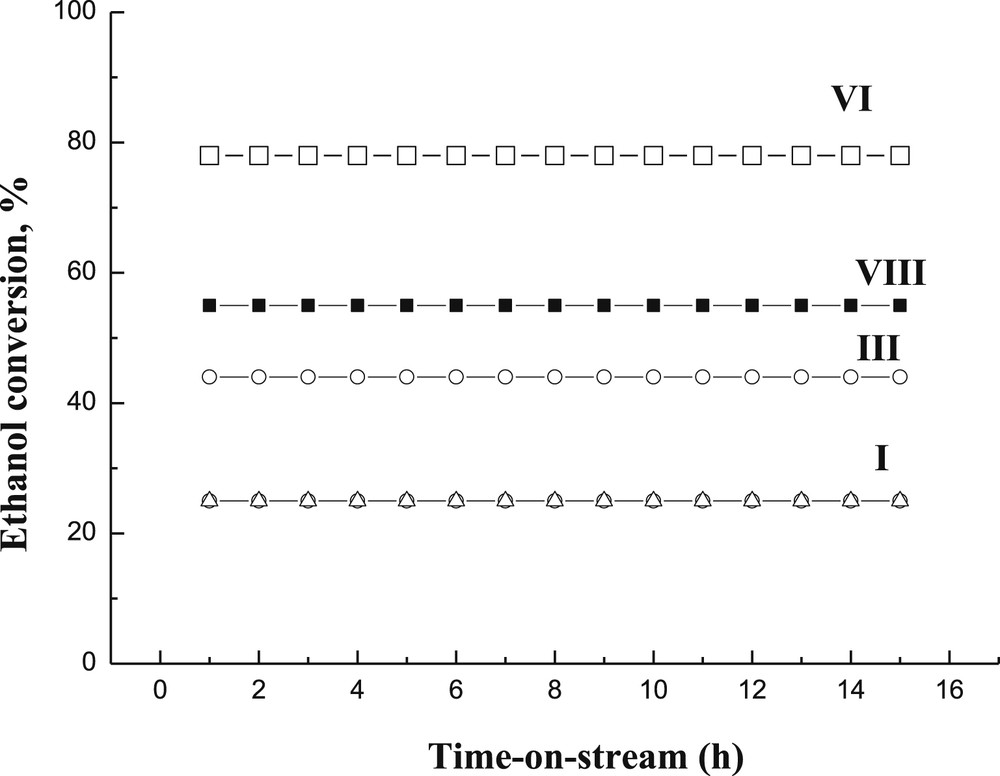
Ethanol conversion as a function of time-on-stream for I: one wt % CuO/Al2O3 (Δ), III: 1 wt % Cr2O3/Al2O3, (○), VIII: 1 wt % CuO2%Cr2O3/γ-Al2O3 (sc) (■) and VI: 3 wt % CuO2%Cr2O3/γ-Al2O3 (□) at 300оС and WHSV of 1 h−1.
3.2.3 Product distribution and selectivity in ethanol dehydrogenation using ex-MxOy catalysts
Acetaldehyde was the primary product in the liquid phase in ethanol dehydrogenation, which according to the literature [1] can further react with another ethanol molecule forming ethyl acetate. An equimolar amount of hydrogen should also be formed together with acetaldehyde according to eq. 1 in Scheme 1. In addition to dehydrogenation, dehydration of ethanol can occur, forming ethylene and water (eq. 2), as well as decarbonylation giving methane and CO according to eq. 3. Selectivity to acetaldehyde decreased in the following order: I > II > III (Table 4). This result is in accordance with the results in Ref. [7] for catalysts I and II. The molar ratio between acetaldehyde to hydrogen was, however, lower than unity for catalysts II and III showing that hydrogen was formed in excess. This indicates that hydrogen has been consumed in subsequent, most probably, hydrogenolysis reactions causing catalyst coking in the case of catalyst I, which exhibited a low conversion. Formation of hydrogen as a function of catalyst acidity is discussed in detail in Section 3.2.5. The selectivity to the undesired C1 products was the highest for catalyst II. Formation of C1 products including mainly CO and CO2 was quite substantial and independent on the amount of Lewis acid sites. On the other hand, strongly basic catalysts, such as catalyst II with high pH at a pzc of 10.6, promoted decarbonylation. In this case, methanol was not visible in the chromatograms.
The highest selectivity to ethylene among ex-MixOy catalysts was obtained with IV and III, which exhibited an optimum Lewis acid site concentration (Table 3). When using catalyst III with the highest Lewis acid site concentration, the selectivity to ethylene was lower. For catalyst I, the acetaldehyde selectivity was high at 300 °C (Table 4), whereas for catalyst II with the same metal oxide loading, a higher selectivity was obtained for ethylene. The current results are comparable with those reported by Chung et al. [7] showing that ethylene selectivity increased for the ZnO catalyst with increasing temperature between 240°–360 °C, while for CuO, the selectivity to acetaldehyde was high and temperature-independent.
In addition to acetaldehyde, ethylene and C1 compounds, isopropanol was also formed, especially over catalyst III, which was the most active for the formation of isopropanol via acetaldehyde hydrogenation and addition of CH4, in particular (Table 4). Substantial amounts of isobutene were also formed by using this chromia-containing catalyst, indicating its poor selectivity for acetaldehyde formation, facilitating instead an appearance of isobutanol and its subsequent dehydration to gaseous C4 products. Isobutanol formation was promoted, however, especially with multicomponent catalysts (see below).
3.2.4 Product distribution and selectivity in ethanol dehydrogenation using multicomponent catalysts
Multicomponent catalysts contained quite large amounts of basic sites and promoted mainly acetaldehyde formation and its further reaction to isobutanol. The highest selectivity to acetaldehyde was obtained with catalyst VIII, exhibiting the optimum Lewis acidity. According to XRD results, in particular, catalyst VIII contained copper chromite. It has also been reported that copper chromite is a suitable catalyst for the production of acetaldehyde from ethanol [18]. For a more acidic VI catalyst, the acetaldehyde selectivity was only 22% (Table 4). No ethyl acetate was formed in accordance with the literature [1,10]. It is also noteworthy that dehydration and formation of ethylene was very limited over multicomponent catalysts and independent on the concentration of Lewis acid sites (Table 3).
With multicomponent catalysts, especially C1 compounds and higher alcohols were formed in large amounts including isopropanol and isobutanol, particularly with catalyst VI exhibiting the highest Lewis acidity. These results differ from those presented in Ref. [15], when n-butanol was formed over Cu/ZrO2 and Cu/ZnO [15] via bimolecular condensation of ethanol over the basic sites. It should be, however, noted that such comparison should be taken with caution as in Ref. [15], the authors used reduced copper catalysts, while in this study catalytic data were generated for materials containing copper oxide. In this work, substantial amounts of C1 compounds were also formed via decarbonylation, which facilitated the formation of isopropanol and isobutanol in a consecutive step over basic catalysts. Furthermore, there are indications that isobutanol can be formed from ethanol via a complex reaction network [54–56], for example, via the Guerbet reaction between ethanol and methanol, since in this case, methanol was not observed in the chromatograms and isopropanol and isobutanol formation routes cannot be explained with high confidence. The largest selectivity to CO2 was found by using catalyst VIII because of the water gas shift reaction. This result is in accordance with experimental observations that this reaction is favored at 300 °C by using CuOZnO and CuOCr2O3 [17].
In addition, substantial amounts of gaseous C4 and high molecular weight liquid products were formed by using catalyst V, indicating its ability to cleave CO bonds by decarbonylation. It is also noteworthy that only traces of isobutene by isobutanol dehydration were formed over catalyst VI compared to VIII, although the former one exhibited a higher amount of Lewis acid sites. Small amounts of xylene, benzene and ethylbenzene were also produced with multicomponent catalysts.
3.2.5 Comparison of dehydrogenation selectivity for different catalysts
Quantification of hydrogen has been scarcely reported in ethanol dehydrogenation [10] and thus it was performed in this study. This is also important for production of bio-based hydrogen via ethanol dehydrogenation. To quantify the results, the dehydrogenation selectivity was compared via plotting the ratio between the selectivity to hydrogen and selectivity to acetaldehyde as a function of the amount of Lewis acid sites for all studied catalysts (Fig. 13a). In addition, when the amount of Lewis acid sites was nearly the same, the ratio between the selectivity to hydrogen versus acetaldehyde decreased as follows: VII > VIII > VI. This indicated that the supported CuOZnO/Al2O3 catalyst favoured mostly the formation of hydrogen. Furthermore, these results showed that hydrogen was in excess compared to acetaldehyde for all catalysts, except CuO/Al2O3 and catalyst IV, independent of the amount of Lewis acid sites. Due to the fact that the unreduced catalysts were used, low hydrogenation activity was observed, thus forming low amounts of methane and keeping the ratio of H2/acetaldehyde ratio high (Fig. 13a). Small amounts of carbon monoxide and methane were also formed. The former one originates from the decarbonylation of acetaldehyde eq. 3. Ethylene was produced by dehydration of ethanol eq. 4 in Scheme 1.
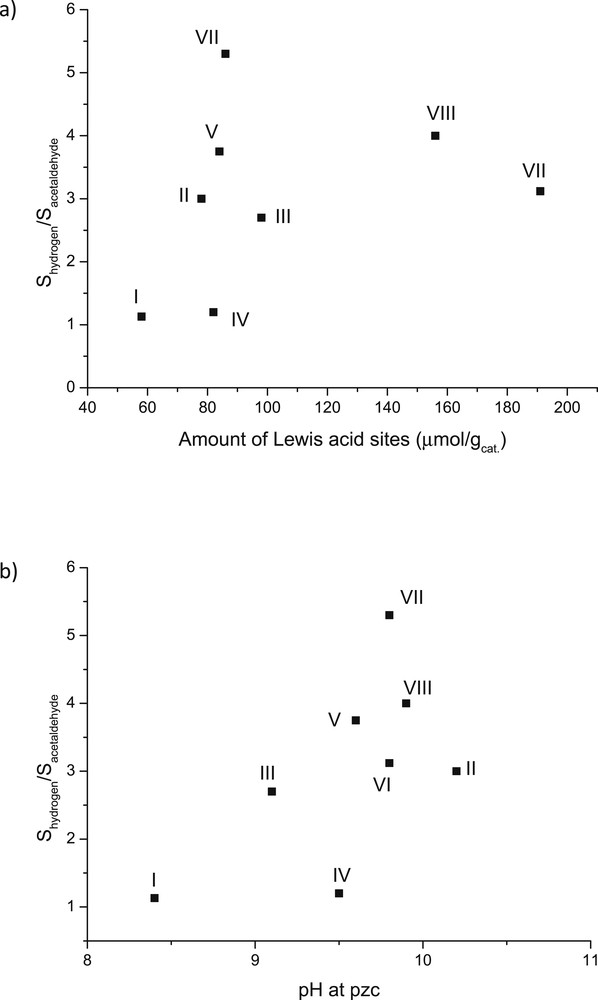
The ratio of the selectivity of hydrogen to the selectivity of acetaldehyde at steady state after 15 h time-on-stream vs (a) amount of Lewis acid sites and (b) pH of the catalyst slurry at pzc. Conditions: 300 °C and with WHSV = 1 h−1. Note: I: 1 wt % CuO/γ-Al2O3, II: 1 wt % ZnO/γ-Al2O3, III:1 wt % Cr2O3/γ-Al2O3, IV: 3 wt % CuO/γ-Al2O3, V: 3 wt % CuO+2 wt % ZnO/γ-Al2O3, VI: 3 wt % CuO+2 wt % Cr2O3/γ-Al2O3, VII: 3 wt % CuO+2 wt % ZnO/γ-Al2O3 (sc), and VIII: 3 wt % CuO+2 wt % Cr2O3/γ-Al2O3(sc).
Fig. 13b shows the ratio between selectivity to hydrogen and to acetaldehyde as a function of pzc for all studied catalysts. The results show clearly that, with increasing pzc, the selectivity to hydrogen increased compared to that for acetaldehyde. This was especially seen for ZnO-based catalysts, exhibiting low hydrogenation and high decarbonylation activity. The opposite results were observed for I and IV catalysts. In addition, although the pzc values were nearly the same for VII, VIII, V, II and IV catalysts in Fig. 13b, the highest selectivity to hydrogen was achieved with the catalyst VII containing CuO and ZnO supported on alumina beads.
3.2.6 Comparison of dehydration selectivity of different catalysts
The selectivity of dehydration versus dehydrogenation, or selectivity to ethylene and acetaldehyde was compared by plotting the ratio of selectivity versus conversion for different catalysts (Fig. 14). It can be seen clearly that only trace amounts of ethylene were formed by using multicomponent catalysts, whereas the most prominent ethylene formation was observed over catalyst III followed by II. The former catalyst exhibited a relatively mild acidity and basicity compared to the latter one, which was the most basic catalyst. On the other hand, when calculating the ratio between medium strong to mild Lewis acid sites, it can be seen that this ratio was very small for all multicomponent catalysts giving low amounts of ethylene, while both catalysts II and III exhibited more medium strong and even strong Lewis acid sites. Thus it can be concluded that Lewis acidity, and especially stronger Lewis acid sites favor formation of ethylene from ethanol. This result is also in accordance with the report of Pan et al. [19], who concluded that only Lewis acidic Zr-supported mesoporous silica was selective towards ethylene formation from ethanol at 300 °C.
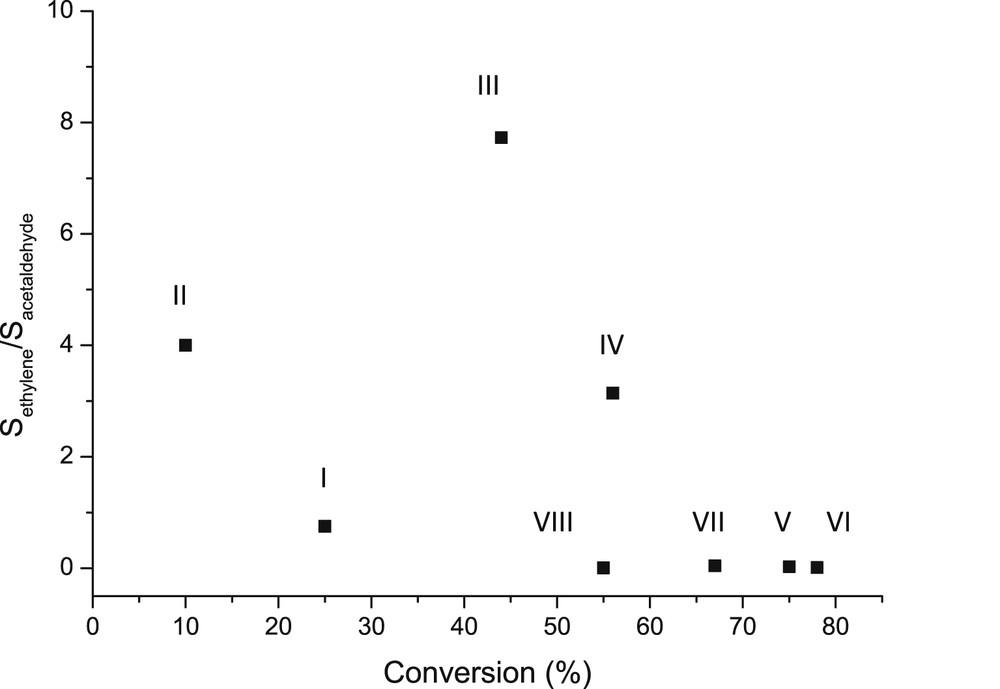
The ratio of the the selectivity of ethylene to the selectivity of acetaldehyde over different catalysts as a function of conversion. Conditions: 300 °C, WHSV 1 h−1. Notation is the same as in Fig. 13.
4 Conclusions
The purpose of this work was to investigate the preparation of the multicomponent CuOCr2O3Al2O3 catalyst by using the solution combustion method and evaluate its catalytic activity in the transformation of biomass-derived ethanol into valuable products, such as acetaldehyde and hydrogen for the first time.
Several mono metal oxide and multicomponent Cu, Zn and Cr-containing catalysts supported on industrial size alumina beads were also prepared by using the incipient wetness method. As a comparison to the incipient wetness method, multicomponent ex-MixMjyOz catalysts were also prepared by using the solution combustion method using glycine as a fuel. The catalysts were characterized by using several physico-chemical methods in order to relate the preparation method and catalytic activity in ethanol dehydrogenation with physical properties.
The results revealed that Cu− and Cr were not very homogeneously distributed in the catalyst beads, being, however, located close to each other according to surface mapping by EDXA. The amounts of multicomponent metal oxides were higher in the catalyst prepared by using solution combustion than by using incipient wetness. All studied catalysts exhibited only Lewis acidity according to pyridine adsorption-desorption FTIR. The pzc of the catalysts showed that ZnO/Al2O3 exhibited the highest pzc, followed by the multicomponent CuOCr2O3 and CuOZnO catalysts. The hydrogen uptake was the highest for CuOCr2O3/Al2O3 catalysts prepared by using the solution combustion method. In all catalysts, the ex-MixMjyOz particles between 2 and 4 nm were observed by using TEM. Due to a slightly increased lattice parameter value in η-alumina, it can be concluded that partial substitution of Al by Cu, Cr and Zn occurred on the outer surface of the crystal grains.
A stable catalytic performance in ethanol dehydrogenation was achieved with CuO/Al2O3, Cr2O3/Al2O3 and CuOCr2O3/Al2O3 catalysts prepared either by using incipient wetness or solution combustion method. The highest activities were obtained with multicomponent catalysts, which were resistant towards catalyst deactivation. These results confirm that the presence of a multicomponent catalyst is necessary in order to retain the catalytic activity in ethanol dehydrogenation. Mono metal oxide CuO and Cr2O3-containing catalysts were unselective, promoting formation of low molecular hydrocarbons. The highest selectivity to acetaldehyde, 50% at 55% conversion of ethanol was obtained at 300 °C and WHSV of 1 h−1 with CuOCr2O3/Al2O3. Other catalysts being in general more active resulted in lower selectivities towards acetaldehyde. These results clearly emphasize that the solution combustion method for the preparation of the industrial size multicomponent CuOCr2O3 catalyst should be further explored.