

1 Introduction
Recently, diverse applications of the phosphates and pyrophosphate in the domain of catalysis, photocatalysis, and adsorption have become the subject of extensive investigations, owing to their interesting physicochemical and textural properties. Pyrophosphates have interesting properties particularly in industrial and environmental applications [1–7]; indeed, these materials are used as conditioning matrices for radioactive waste [1] and fuel cells [2]. They are very attractive in heterogeneous catalysis and are used in Beckmann rearrangement [3], dehydration and oxydehydration of glycerol [4,5], xylose to furfural, [6] and sorbitol to isosorbide [7] and also in selective oxidation of low alkanes [8–11], and widely used in oxydehydrogenation (ODH) of alkanes such as isobutane [12–15] and n-butane [16–21]. They have moderately active lattice oxygen [12,13] and moderate acidic properties, whose strength depends on the metal bond and preparation method [4].
The titanium pyrophosphate (TiPO) structure can be described as a network of corner-sharing TiO6 octahedra with P2O7 double-tetrahedra units, characterized by the presence of intersecting tunnels delimited by pentagonal forms. TiP2O7 has a cubic structure, which can be thought as NaCl-type arrangement of Ti4+ and (P2O7)4− ions. This unique crystalline structure is, indeed, able to act as a Li-ion insertion host, showing reversible insertion and extraction of Li-ion under a certain electric potential [22].
Light alkanes are easily obtained from liquefied petroleum gas and frequently used as a feedstock in the production of petrochemical intermediates. The valuable compounds like alkenes are produced from the dehydrogenation process of light alkanes. This reversible endothermic process is due to the required high temperature. However, in the ODH of light alkanes, the molecular oxygen reacts with alkanes to form alkenes and water; therefore, the ODH process is exothermic and operates at temperatures generally less than 600 °C [23]. However, the obtained olefins, more reactive than the alkanes, could undergo a total oxidation. Many recent studies of diverse materials tested in catalytic oxidative dehydrogenation of n-butane have been reported in the literature, that is, carbon nanotubes modified by phosphates [24], BiMoV oxides [25], V2O5/MO–Al2O3 heterogeneous catalysts [26], BiNiO/γ-alumina [27], Pt/Sn/M/γ-alumina (M = Zn, In, Y, Bi, and Ga) [28], and Mg3(VO4)2/MgOZrO2[29]. Coprecipitation synthesis of TiPO using sodium pyrophosphate is interesting and provides high reactivity materials in catalytic ODH of isobutane [15]. It could exhibit the best catalytic activity and selectivity for the ODH of n-butane.
In this study, much attention is given to the synthesis routes owing to study a new preparation scheme of TiPO via a solid-state technique (by dry way), because it is a simple and fast method and gives a pure phase and promising results with a well-ordered structural aspect and a rosette-shaped texture. The objective of this article is to prepare the TiPO catalyst through solid-state scheme, liquid–solid reaction, and coprecipitation methods. The prepared catalysts are characterized by several physicochemical techniques and their catalytic activities have been assessed via an ODH of n-butane for investigation of the selectivity toward the products.
2 Experimental section
2.1 Catalysts preparation
Various TiPO with theoretical molar ratio P/Ti = 2 are prepared using three different synthesis methods. The TiPO catalysts are denominated TiPO-M (where M refers to the method of synthesis) and then labeled as follows: (1) TiPO-A (A, liquid–solid), (2) TiPOB (B, coprecipitation), and (3) TiPOS (S, solid-phase). The three obtained samples are very fine powders with white color. The protocol of three syntheses is described in the following section.
2.1.1 Method A (TiPO-A sample)
This technique is performed in two steps [16,18,30,31]. In the first step, the titanium dioxide (TiO2) is prepared by a precipitation method of titanium hydroxide precursor Ti(OH)4 from titanium tetrachloride (TiCl4; Merck 99%), and then followed by calcination at 450 °C during 4 h. In the second step, the TiO2 is dispersed in ultrapure water with the appropriate amount of phosphoric acid (85%). The obtained mixture is maintained at 120 °C overnight. The obtained precursor is crushed and calcined in air at 600 °C for 3 h. The formation of TiPO particles through dehydration of TiO2 and phosphoric acid in aqueous solution is described by the following proposed equation:
| TiO2 + 2H3PO4 → TiP2O7 + 3H2O (postcalcination) | (1) |
2.1.2 Method B (TiPO-B sample)
Sodium pyrophosphate (Na4P2O7) solution (0.1 M) is added dropwise to an acidified solution (0.1 M) of TiCl4 (Merck 99%), in a stoichiometric ratio P/Ti = 2, using lactic acid (B1) and hydrochloric acid (B2) [12–15]. The pH is adjusted with nitric acid (pH = 6). The precipitate is centrifuged, filtered, washed with ultrapure water, and dried overnight, then crushed and calcined in air at 600 °C for 3 h according to the literature conditions to obtain, respectively, TiPO-B1 and TiPO-B2 samples. In this synthesis, hydrolysis is regarded as an electrostatic reaction between titanium ions (Ti4+) and phosphates ions (P2O74). The electrostatic contribution to the reaction rate can be expressed as proposed below:
| TiCl4 + Na4P2O7·10H2O → TiP2O7+ 4NaCl + 10H2O (precipitation then calcinations) | (2) |
2.1.3 Method S (TiPO-S sample)
In an appropriate stoichiometric amounts, a mass of TiO2 is mixed with a mass of diammonium hydrogen phosphate [(NH4)2HPO4] for a solid-state reaction. The mixture was vigorously ground in an agate mortar for 20 min and then dried at 120 °C for 7 days (168 h). Finally, the mixture was calcined in air at 600 °C for 3 h [32–34]. The synthesis is described according the following proposed reaction:
| TiO2 + 2(NH4)2HPO4 → TiP2O7 + 4NH3↑ + 3H2O (postcalcination) | (3) |
2.2 Catalysts characterization
The surface areas are calculated by nitrogen adsorption at 77 K temperature, according to the Brunauer–Emmet–Teller (BET) method [35], using a Micromeritics' Tristar instrument. Samples (50 mg) are degassed under primary vacuum at 90 °C for 1 h and then under secondary vacuum at 250 °C for 4 h. The BET formula is used to obtain the surface area in the relative pressure range 0.1–1. The total pore volume (Vp) is estimated from the amount of nitrogen adsorbed at a relative pressure of 0.978 using the Barrett–Joyner–Halenda method.
Powder X-ray diffraction (XRD) patterns are recorded with a Shimadzu XRD-6000, employing Cu Kα radiation (λ = 1.5418 Å) using a θ-theta mode (2θ°) and equipped with a 1 D LynxEye detector. The LynxEye detector operates in 10°–80° scanning range by a step of 0.02°. The crystallite sizes are estimated using the Debye–Scherrer equation [36], using full-width at half maximum.
Sample content compositions are quantitatively determined by inductively coupled plasma through the atomic emission spectroscopy (ICP-AES), using a Perkin Elmer Optima 2000 DV spectrometer. The sample is dissolved in a solution of HNO3 + HCl. The excitation is being in plasma of argon at 7727 °C temperature.
Fourier transform infrared (FTIR) spectra are recorded using a Perkin Elmer model 100 series instrument with scanning range from 280 to 4000 cm−1. Before FTIR experiments, sample preparation method is universal attenuated total reflection, and the attenuated total reflection method is applied for determining FTIR spectra of the solid samples.
The coupled thermogravimetric analysis and differential scanning calorimetry TGA/DSC (before calcination) is performed on a Pyris Diamond Perkin Elmer Thermal Analyzer apparatus. About 10 mg of sample is heated from 25 to 600 °C in Pt crucibles, Pt/PtRh thermocouple, with nitrogen (N2) purge gas at a flow rate of 30 mL min−1 and the heating rate 10 °C min−1.
The microstructure images of nanostructures and microstructures of TiPO catalysts are obtained by field emission scanning electron microscopy (FE-SEM) using a JSM-7400F (JEOL) system operating at 15 kV, and the scanning electron microscopy (SEM) on a JEOL JSM-6400 instrument. Samples are dusted on an adhesive conductive carbon paper attached to a brass mount and analyzed.
The acidity and basicity of the catalysts is studied by temperature-programmed desorption (TPD) technique using ammonia (NH3) and carbon dioxide (CO2) as probe molecules, respectively. TPD experiments are performed using a Thermo-Finnigan TPDRO 1100 instrument equipped with thermal conductivity detector (TCD). The TPD ammonia (TPD-NH3) analysis is done by using 50 mg of a catalyst in a quartz reactor and treated under N2 (20 mL min−1) at 150 °C for 45 min. NH3 in helium gas is ramped at 1 °C min−1 for 60 min. The purging with N2 is performed at room temperature for 55 min to remove NH3 in the gas phase. The analysis of NH3 desorption is then studied between 50 and 950 °C under a helium flow (15 °C min−1, 20 mL min−1) and detected by a TCD. The TPD-CO2 experiment is performed using 50 mg of catalysts and pretreated under a helium stream at 120 °C for 5 min (10 °C min−1, 20 mL min−1). Then, the temperature is decreased to 50 °C and a flow of pure CO2 (20 mL min−1) is subsequently introduced into the reactor for 1 h. The sample is flushed with helium at 30 °C for 30 min before the CO2 desorption analysis. The TPD of CO2 is carried out between 50 and 950 °C under a helium flow (10 °C min−1, 20 mL min−1), and CO2 is detected by a TCD.
2.3 Catalytic activity
The catalytic tests are performed in a fixed bed reactor containing 200 mg of the catalyst, at the reaction temperature 500 °C and under feed gas ratio air/butane 5:1. The gas hourly space velocity is fixed to 6794 h−1. Catalyst is heated in the flow of reaction and the system allowed to stabilize at the reaction temperature before the first products' analysis. The reaction products are analyzed (after 1 h of reaction) by gas chromatography (Perkin Elmer Autosystem XL, provenance USA), which is equipped with a flame ionization detector and a TCD, connected together to an HP-PONA capillary column (50 m × 0.2 mm × 0.5 μm; J&W Scientific). The obtained products are butenes (C4H8), isobutane (C4H10), butadiene (C4H6), cracking products (CH4, C2H6, and C3H8), and COx (CO + CO2). We know that butenes are very important feedstock in petrochemistry applications (such as textile, detergents, and plastics industries) that is why the selectivity sum of butenes is more interesting in this study. In the absence of catalyst, no reaction occurred. The n-butane conversion (%) and product selectivity (%) are calculated with the following formulas [7]:
| (1) |
| (2) |
3 Results and discussion
3.1 N2 adsorption/desorption
Fig. 1 shows the nitrogen adsorption/desorption isotherms of all TiPO samples. The data of surface areas, pore volumes, and pore sizes of the samples are summarized in Table 1. Both TiPO-A and TiPO-S materials exhibited shaped isotherms with hysteresis loops very similar. In contrast, TiPO-B solids present isotherms without hysteresis loop. The isotherms of TiPO-A and TiPO-S are type IV, which is characteristic of mesoporous materials (2 < d < 50 nm) [18]. TiPO-A and TiPO-S showed a hysteresis H3 type according the IUPAC classification. Type H3 loops are not well defined by the literature, the evaporation of certain pores depends on the state of the neighboring pores indicating a micromesoporous material [35]. They probably correspond to solids with an interparticular porosity.
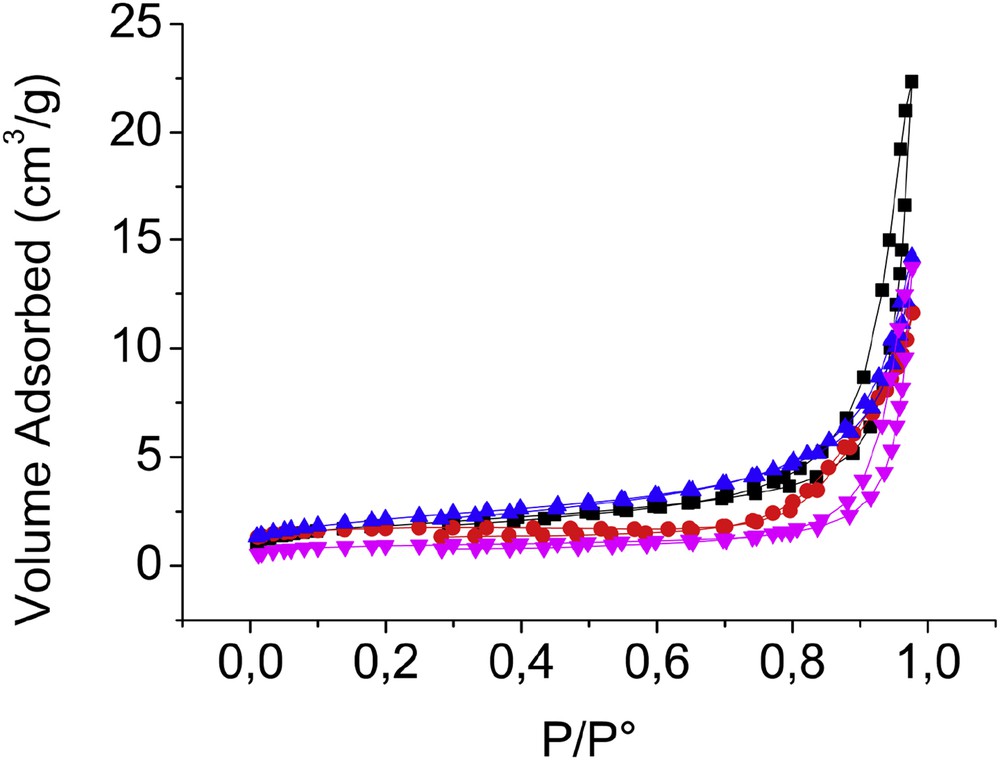
N2 adsorption/desorption isotherm plots of TiP2O7, TiPO-A (■), TiPO-B1 (Image 2), TiPO-B2 (Image 3), and TiPO-S (Image 4).
Physicochemical properties of TiPO catalysts.
| Catalyst | SBET (m2 g−1) | Vtotal pore (cm3/g) | Average diameter Dp (Å) |
| TiPO-A | 6.5 | 0.0345 | 213.04 |
| TiPO-B1 | 6.5 | 0.0179 | 157.52 |
| TiPO-B2 | 7.2 | 0.0219 | 117.37 |
| TiPO-S | 3.2 | 0.0212 | 238.53 |
All samples showed low BET surface areas (not exceeded 8 m2/g). Similar values have been reported in the literature for TiPO solids [16–21]. Besides, very low pore volumes are observed (between 0.017 and 0.034 cm3/g) compared to those found in the literature. It is worth noting that the average pore diameter decreases in order: Dp(TiPO-S) > Dp(TiPO-A) > Dp(TiPO-B1) > Dp(TiPO-B2) and stabilizes at about 11.7 nm for TiPO-B2. These differences will be discussed again in the reactivity results.
3.2 X-rays diffraction and ICP-AES analysis
The XRD patterns of TiPO samples after calcination at 600 °C are shown in Fig. 2. The crystallite size for all the samples is estimated by Debye–Scherrer formula [36] using the most intense peak and the lattice parameter as shown by the formulas
| (3) |
| (4) |
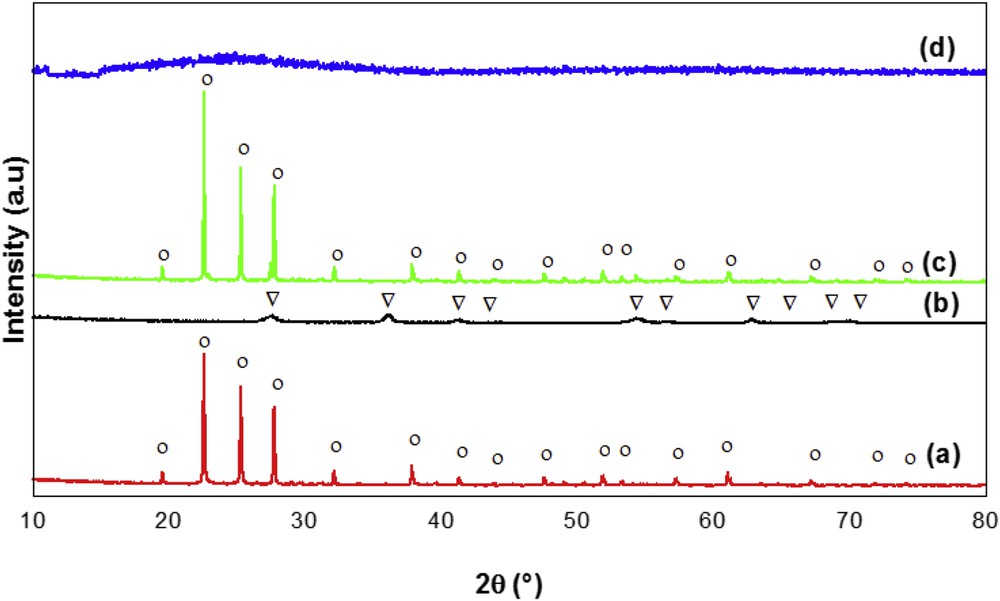
XRD patterns of TiPO samples: (a) TiPO-A, (b) TiPO-B1, (c) TiPO-S, and (d) TiPO-B2. (○) TiP2O7 phase and (▿) TiO2 rutile phase.
Structural parameters of TiPO samples.
| Catalyst | a (Ǻ)a | Crystallite sizeb (nm) | Crystalline structure | P/Ti molar ratio |
| TiPO-A | 23.637 | 115.68 | TiP2O7 cubic | 1.91 |
| TiPO-B1 | – | 66.31 | TiP2O7 amorphous + rutile-TiO2 | 1.58 |
| TiPO-S | 23.627 | 144.6 | TiP2O7 cubic | 1.97 |
a Lattice or cell parameters of cubic structure (a = b = c).
b Crystallite size calculated by Debye–Scherrer formula.
The P/Ti molar ratios were determined by ICP-AES analysis and are given in Table 2. As can be seen, the experimental composition of TiPO-2-A (P/Ti = 1.91) and TiPO-2-S (P/Ti = 1.97) catalysts is close to the theoretical one (P/Ti = 2). In contrast, for TiPO-2-B1 (P/Ti = 1.58), the experimental ratio remains very less than the theoretical one. This result could probably indicate that TiPO-2-B1 catalyst is richer in Ti element and can be explained by the low crystallite size (66.3 nm) and by the presence of rutile TiO2 phase in this catalyst. In this work, only TiPO-B1 sample synthesized by the coprecipitation method will be studied, because XRD of TiPO-B2 is not exploitable.
3.3 FTIR spectroscopy
FTIR spectra of TiPO samples calcined at 600 °C are shown in Fig. 3. All spectra are quite similar, except the intensity and broadness of the bands, which are different. These bands are mainly due to the vibrations of (P2O7)4− group, as reported by Marcu et al. [18] and Shi et al. [38]. For TiPO-A (Fig. 3a), some distinct bands are observed at about 1041, 943, 753, 618, 561, and 329 cm−1; the broad peaks appear around 1000 and 1200 cm−1. In the spectrum of TiPO-S (Fig. 3c), the bands are observed at 1052, 948, 740, 618, 560, and 355 cm−1. However, the main bands at about 1040–1050 cm−1 are attributed to the asymmetric vibration of stretching mode of PO3 (νas-PO3) terminal groups from pyrophosphate [18,38]. The characteristic bands of pyrophosphate observed at about 945 and 745 cm−1 are related to asymmetric and symmetric stretching vibration of POP bridge bond, respectively. Furthermore, the two bands at 618 and 560 cm−1 are assigned to bending vibrations of OPO and POP, respectively, which are considered as deformation modes of (PO3) in pyrophosphate group as described by some authors, whereas the bands around 327 cm−1 might be attributed to translational motions of the Ti+4 cation, which more likely correspond to a deformation mode of the TiO6 octahedral [38–43].
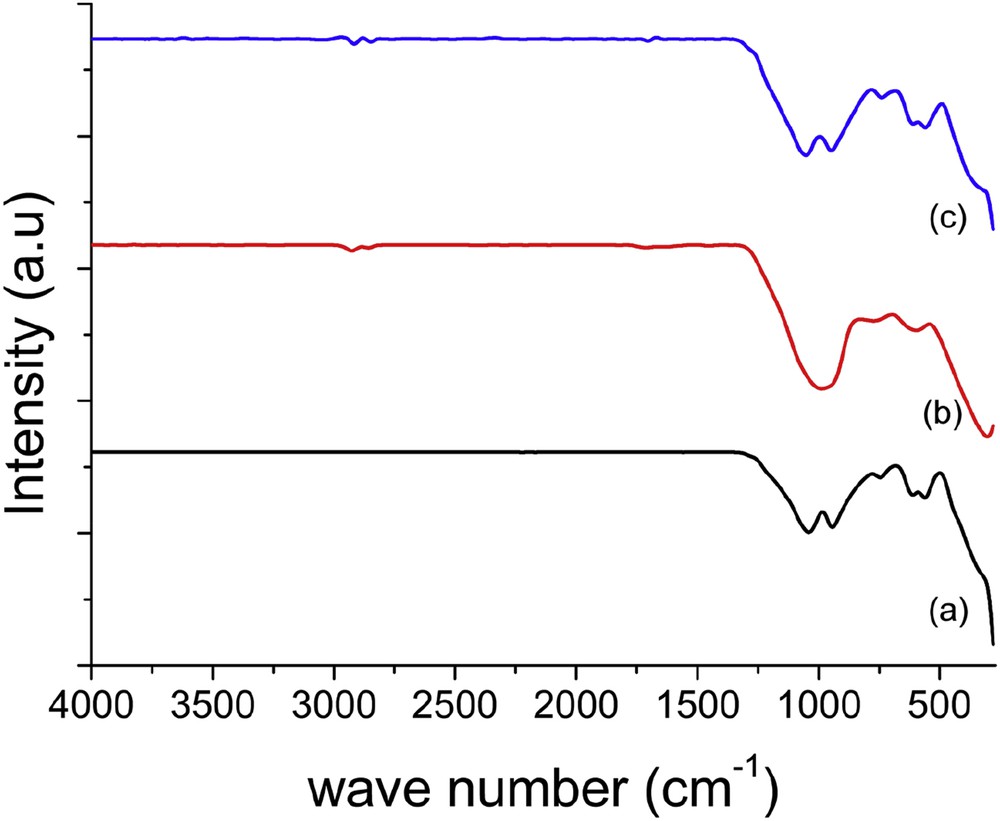
FTIR spectra of TiPO catalysts: (a) TiPO-A, (b) TiPO-B1, and (c) TiPO-S.
In TiPO-B1 spectrum (Fig. 3b), similar bands (304, 597, 754, 952, and 1058 cm−1) are observed with broader transmittance. The bands at around 940 and 740 cm−1 are attributed to the (P2O7)4− anion [38–44]. Also, a broad band shifted to lower frequencies indicates an increase in PO distances in TiPO-B1 sample as reported previously [18]. In addition, the 304 cm−1 band is attributed to Ti+4 cation–oxygen bonds [39,43]. In the spectrum of TiPO-S (Fig. 3c), several broad bands in the frequency range from 355 to 1052 cm−1 are recognized as pyrophosphates as stated in the literature [18,39–42].
Likewise, the lack of the broad bands in the range 1500–3600 cm−1, which associated with the POH deformation mode, OH bending, and H bonded OH stretch, of the phosphate group clearly indicates the absence of titanium phosphate phases as Ti(HPO4)2. These results are in good agreement with the XRD findings.
3.4 (TGA/DTG)–DSC analysis
The thermal evolution of uncalcined samples by TGA/DTG combined with DSC is shown in Fig. 4. DSC curve of TiPO-A (Fig. 4a) exhibited four endothermic peaks; the first ones between 78.7 and 180.5 °C could be ascribed to the loss of adsorbed water, the most intense endothermic peak centered at 228.3 °C is assigned to dehydroxylation step of phosphate precursor, and the last peak appeared at 365.4 °C, which could be owing to the formation of cubic TiP2O7 phase [38].
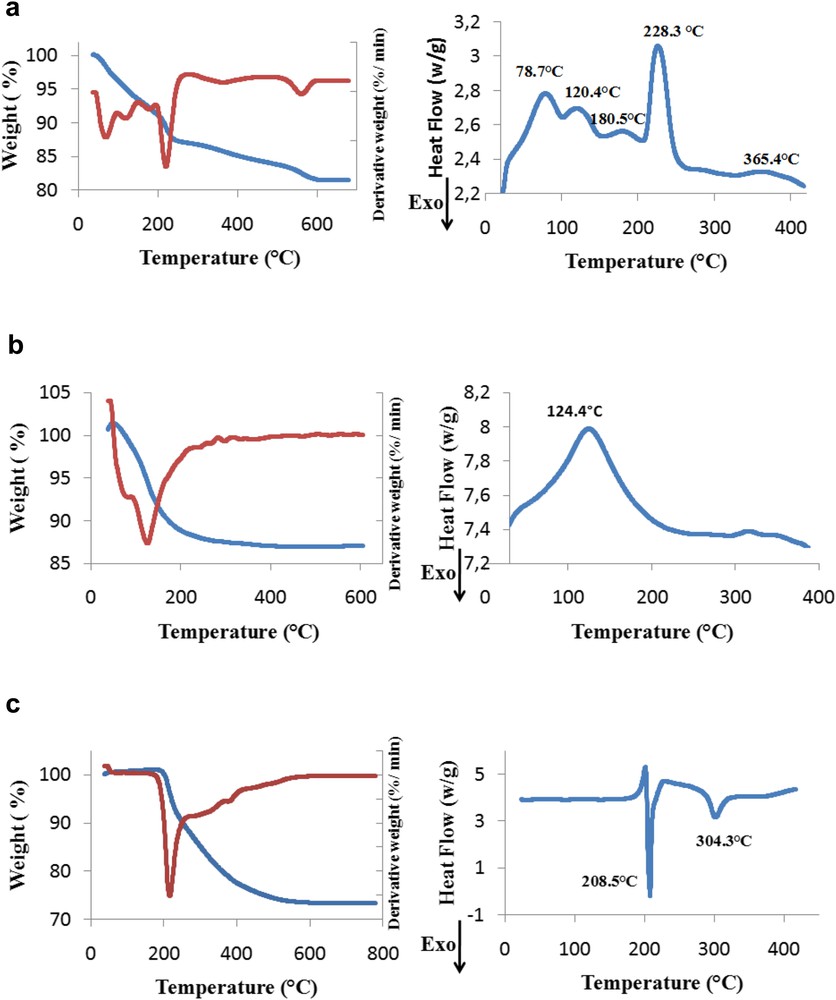
TG, derivative TG (DTG), and DSC profiles of uncalcined samples: (a) TiPO-A (b) TiPO-B1, and (c) TiPO-S.
For DSC curve of TiPO-B1 (Fig. 4b), only one endothermic peak occurred at temperature less than 124.4 °C and might be assigned to one-step desorption of the external hydration water, adsorbed on the surface of TiP2O7 during the precipitation and washing of the catalyst. The pyrophosphate phase does definitely exist in TiPO-B1 sample, as confirmed by the IR spectrum (Fig. 3b), but is not crystallized, because no DSC peak (up to 400 °C) attributed to pyrophosphate formation is observed, which confirms that TiPO-B1 catalyst is no doubt TiP2O7 amorphous as mentioned in XRD and FTIR parts.
The DSC curve of TiPO-S (Fig. 4c) shows two exothermic peaks at 208.5 and 304.3 °C. The first sharp peak could be attributed to the formation of Ti(HPO4)2 by dehydroxylation and the second peak could be assigned to the formation of cubic titanium pyrophosphate (TiP2O7) structure. The absence of endothermic peak at less than 200 °C could be because the TiPOS catalyst is obtained by a “dry method”.
For TG curve of TiPO-A (Fig. 4a), three weight loss stages are observed in the range 70–200 °C with a total mass loss of 9.3%, which is attributed to the sum of water loss (adsorbed and structural water). This result indicates sensitive variations in the crystallinity of TiPO-A sample during preparation and calcination. Obviously, the second weight loss (2.78%) occurred beyond 200–250 °C, whereas the third loss (0.67%), which happened between 250 and 500 °C, is related to a dehydroxylation and condensation of OH− groups of the phosphate precursor formed during the synthesis and the crystallization process of TiP2O7, respectively, in a good agreement with endothermic effects of the DSC curve.
TG thermogram of TiPO-B1 (Fig. 4b) presents one weight loss (13.02%) between 100 and 200 °C, which is because of the elimination of physically adsorbed water as observed by DSC profile.
For TG diagram of TiPO-S (Fig. 4c), approximately a total of 26.7% weight loss in 200–500 °C temperature range, is attributed to water loss of phosphates. However, when Ti(HPO4)2 is transformed into pyrophosphate by thermal treatment, a condensation process of POH species, deriving from two adjacent layers occurs in the interlayer region. As a consequence POP bridges observed in the IR spectrum (Fig. 3) are formed with a layer structure and causing a decrease in the interlayer distance [43,45]. This is in a good agreement with the SEM micrograph (Fig. 5c) and reveals the crystallization process of TiP2O7, which proves its better crystallinity compared to TiPO-B1 catalyst as shown by XRD data (Fig. 2)
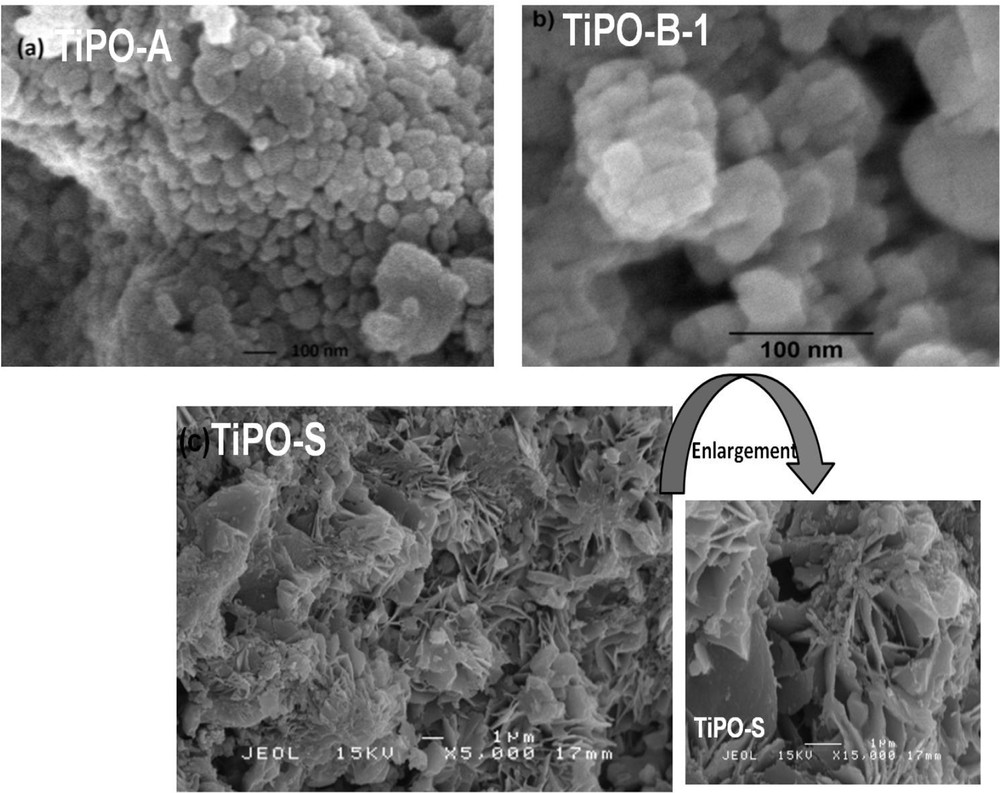
Image micrographs of (a) TIPO-A, (b) TiPO-B1, and (c) TiPO-S.
3.5 Field emission scanning electron microscopy
The surface morphology and particle size of TiPO catalysts are examined by FE-SEM measurements (Fig. 5). As can be seen in Fig. 5a, FE-SEM image of TiPO-A catalyst exhibits homogeneous form of nanospherical particles in a porous cluster of tiny aggregate particles, with similar contrast, which confirms the pure structure of the catalyst as revealed by the XRD analysis. The particles sizes are uniformly distributed with a typical diameter average about 47.3 nm. The FE-SEM image of TiPO-B1 (Fig. 5b) shows similar morphology to that of TiPO-A with uniform distribution of the particle size (average diameter = 54.5 nm). It is worth noting that the TiPO-S morphology is totally different from that of TiPO-A and TiPO-B1. Indeed, the SEM image of this sample (Fig. 5c) indicates morphology with multilayer microstructure similar to the petals of rose flower, called “sand roses morphology” with a uniform size distribution (2–3 μm). This rosette-shape texture has been already observed for the vanadium pyrophosphate catalyst reported by Taufiq-Yap et al. [46–49] and Rownaghi et al. [8–11].
3.6 TPD-NH3 and TPD-CO2 analysis
By using the integration of Gaussian peak method the amount of desorbed ammonia is calculated and displayed in Table 3. Depending on temperature, three kinds of acidity peaks, weak (W), medium (M), and strong (S), can been observed. The total acidity varies in the following order: TiPO-S < TiPO-A < TiPO-B1 as shown in Table 3. In addition, the same trend is observed for the density of acid sites: TiPO-S < TiPO-A < TiPO-B1. For TiPO-A catalyst, there are two small peaks of NH3 desorption recorded at around 400 and 800 °C, which are attributed to the medium (M) and strong (S) acid sites, respectively. A different behavior is observed for TiPO-B1, which shows three large peaks of desorbed ammonia at 200, 375, and 725 °C, indicating three kinds of acid sites weak (200 °C), medium (375 °C), and strong (725 °C), respectively. For the catalyst prepared by S method only medium strength acid sites are detected around 320 °C. Accordingly, the TiPO-B1 coprecipitated sample gives a highest density of acid sites. The observed differences in acidity results might be attributed to the structures and surface characteristics of the catalysts due to the preparation method. So, the coprecipitation method improves the surface acidity, this one decreases as the crystallinity degree increases as indicated by both the TPD-NH3 and XRD data.
Results of TPD-NH3 and the distribution of acid sites according to their strength obtained with TiPO-A, TiPO-B1, and TiPO-S samples.
| Catalyst | NH3-uptake (μmol NH3/g) | Total acid amount (μmol NH3/m2) | W-acid amount (μmol NH3/m2) | M-acid amount (μmol NH3/m2) | S-acid amount (μmol NH3/m2) |
| TiPO-A | 375.42 | 57.67 | – | 42.26 | 15.41 |
| TiPO-B1 | 2408.74 | 372.87 | 40.87 | 264.00 | 68.00 |
| TiPO-S | 148.05 | 46.27 | – | 46.27 | – |
Moreover, the basic properties of TiPO catalysts performed by CO2-TPD, are summarized in Table 4. The total amount of the carbon dioxide desorbed varies in the following order: TiPO-A < TiPO-S < TiPO-B1. TiPO-B1 shows the highest basic character confirmed by the appearance of two desorption peaks toward the high temperature at 720 and 920 °C. This catalyst, also having the highest acidity, could act as a bifunctional catalyst in this reaction.
Results of TPD-CO2 obtained with TiPO-A, TiPO-B1, and TiPO-S samples.
| Catalyst | CO2-uptake (μmol CO2/g) | Basic amount (μmol CO2/m2) |
| TiPO-2-A | 257.65 | 39.58 |
| TiPO-2-B1 | 657.98 | 101.85 |
| TiPO-2-S | 289.56 | 90.49 |
3.7 Catalytic performances
The catalysts were tested in oxidative dehydrogenation of butane at 500 °C with the molar ratio air/n-butane 5:1 and the volume hourly space velocity (VHSV) with respect to n-butane kept at 6794 h−1. The results are summarized in Table 5. The obtained products are butenes (C4H8), isobutane (C4H10), butadiene (C4H6), cracking products (CH4, C2H6, and C3H8), and COx. Depending on the catalyst preparation procedure, differences in total activity and product distribution were observed. These differences in catalytic behavior might be related to the surface acid–base properties. The n-butane conversion varies in the same order as the surface basicity of the catalysts (TiPO-B1 > TiPO-S > TiPO-A). The highest butane conversion was obtained on TiPO-B1 owing to the existence of high density of both types of acid–base active sites on its surface. Furthermore, TiPO-B1 catalyst is less selective in butenes and isobutane (C4H10) products, but it is very selective in cracking products. These results could be related to the presence of the surface strong acidic sites (Table 3), which are responsible for cracking reaction. Furthermore, the lower selectivity of TiPO-B1 catalyst compared with that of TiPO-A and TiPO-S may be because of the cracking of the reaction products or to their overoxidation.
Selectivity and conversion values obtained in ODH of n-butane over TiPO-A, TiPO-B, and TiPO-S samples.
| Catalyst | n-C4H10 conversion (%) | Selectivity (%) | Butenes yieldc (%) | |||||
| All butenesa | iso-C4H10 (%) | COx (%) | Crackingb products (%) | |||||
| Trans-2-butene (%) | Butadienes (cis and trans) (%) | Other (%) | ||||||
| TiPO-A | 22.7 | 48.46 | 0.0 | 2.76 | 12.05 | 1.43 | 35.3 | 11.63 |
| TiPO-B-1 | 48.4 | 8.98 | 1.67 | 1.14 | 2.30 | 4.00 | 81.91 | 5.71 |
| TiPO-S | 27.5 | 37.2 | 0.0 | 1.76 | 3.82 | 1.28 | 55.94 | 10.71 |
a All butenes: trans-2-butene, butadiene (cis + trans), other (1-butene, cis-2-butene).
b Hydrocarbons cracking products: methane (CH4), ethane (C2H6), propane (C3H8), acetylene (C2H2), and propadiene (C3H4).
c All butenes yield.
In the case of TiPO-S and TiPO-A, similar butane conversion is observed. Nevertheless, TiPO-A showed the best selectivity toward dehydrogenation (total C4H8, 51.2%) and isomerization (C4H10, 12.1%) products probably because of the presence of acidic and basic active sites, approximately in the same proportion.
Fig. 6 shows the stability of catalysts as a function of time. All catalysts present a fairly good stability over time up to 120 min. The selectivity of butenes follows the trend TiPO-A > TiPO-S > TiPO-B1, whereas for the cracking products, the trend is TiPO-B1 > TiPO-S > TiPO-A. From these variations, it is obvious that the catalytic performance depends closely on acid–base active sites. Thus, it can be noted that the most basic and acidic catalyst (TiPO-B1) exhibits the best activity toward butane transformation, which begins with H atom abstraction from adsorbed molecule on the strong basic sites. The same catalyst is less selective in dehydrogenation products probably because of the presence of strong acid sites, which could favor the subsequent transformation of the olefins into the cracking and COx products before their desorption. Finally, the activity and selectivity of TiPO catalysts can be related to the method of preparation, the crystalline phase formed, and to their particle size. The highest yield of butene observed with TiPO-A (11.63) could be assigned to its good crystallinity, small FE-SEM particle size (47.3 nm), and uniform particle distributions.
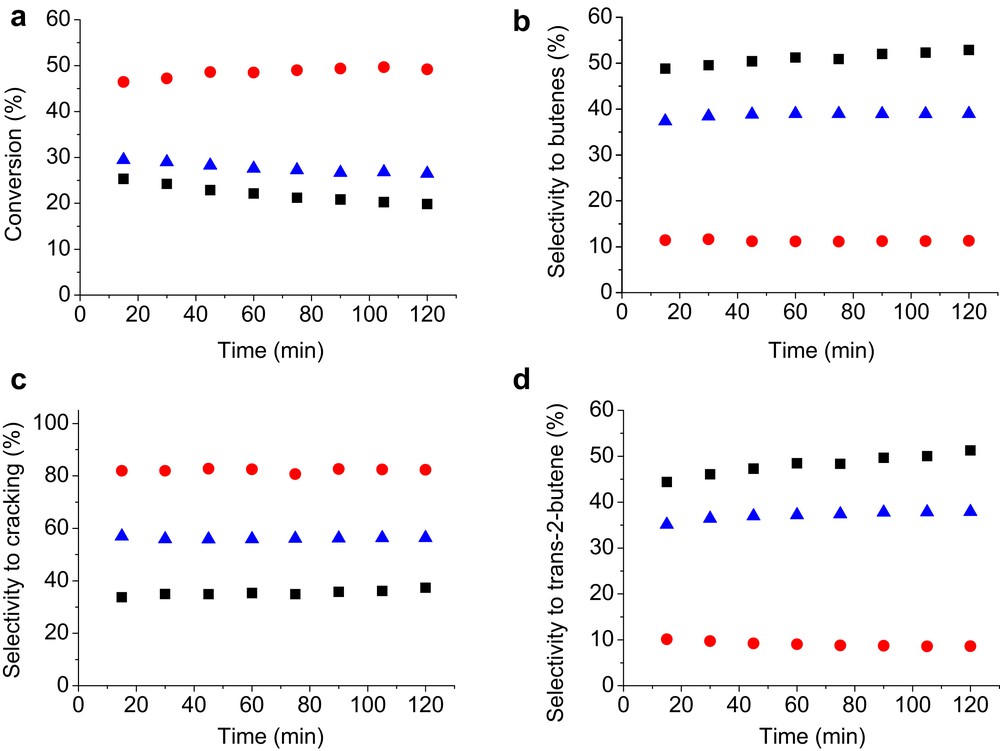
Catalytic performance of TiPO catalysts in ODH of n-butane. (a) Conversion, (b) selectivity to butenes, (c) selectivity to cracking, and (d) selectivity to trans-2-butene (T = 500 °C, air/n-butane = 5:1, VHSV = 6794 h−1). TiPO-A (■), TiPO-B1 (Image 2), and TiPO-S (Image 3).
According to the literature [16–21], titanium pyrophosphates are studied for the catalytic ODH of n-butane. These authors have neither used solid-phase synthesis by dry way nor coprecipitation methods with tetrasodium pyrophosphate (Na4P2O7). They have used similar reaction conditions (TR = 530 °C and hourly space velocity of 1000 h−1) to ours. Their catalytic results on TiPO synthesized by the liquid–solid reaction method and the precipitation method show a conversion of about 25% and 28%, respectively, and butenes selectivity of 42% and 33%, respectively. We noted that their results are close to activities of our TiPO-A and TiPO-S catalysts, but our TiPO-B1 remains the most active catalyst. Furthermore our solid catalysts showed better selectivity of butenes than those realized in their study and particularly our TiPO-A produces isobutane (iso-C4H10) at 12.05% of selectivity, but compared to our butadiene selectivity, the authors obtained more important production of butadiene.
4 Conclusions
TiPO catalysts were prepared by liquid–solid (TiPO-A), coprecipitation (TiPO-B), and solid-state (TiPO-S) methods and tested in oxidative dehydrogenation of butane at 500 °C. The obtained products are butene (C4H8), isobutane (C4H10), butadiene (C4H6), cracking products (CH4, C2H6, and C3H8), and COx. It is found that activity and the obtained products' distribution can be correlated to the surface acid–base properties. The n-butane conversion varies in the same order as the surface basicity of the catalysts (TiPO-B1 > TiPO-S > TiPO-A); the best conversion was given by TiPO-B1, owing to the existence of high density of both types of acid–base active sites on its surface. Finally, the activity and selectivity of TiPO catalysts can be related to the method of preparation, the crystalline phase formed, and to their particle size. The highest yield of butene observed with TiPO-A could be assigned to its good crystallinity, small particle size, and uniform particle distributions. All catalysts present a good stability over time up to 120 min.
Acknowledgments
We gratefully acknowledge the “Ministère de l'Enseignement Supérieur et de la Recherche Scientifique” (MESRS) and Chlef University “UHBC” for a financial support. We also gratefully acknowledge Catalysis Science & Technology Research Center “PutraCat” and Institut de chimie des milieux et matériaux de Poitiers “IC2MP” for their collaboration.