

1 Introduction
Spinel ferrites are preferred materials for wastewater treatment procedures, mainly because of the possibility of easily separating them from aqueous solutions by a simple magnetic process [1,2]. Recently, the successful use of spinel compounds for pollution control has been demonstrated with regard to the removal of anionic dyes from aqueous solutions through adsorption processes [3], catalytic wet hydrogen peroxide oxidation [4], or photodegradation [5,6]. Contrary to the performances observed for the catalytic wet hydrogen peroxide oxidation and photocatalytic processes, which were remarkable, as compared to the literature, the adsorption capacities were relatively low and were ranging only from 5 to 15 mg/g, depending on the chemical composition of the magnetic oxide [3–6]. The unsatisfactory adsorption capacities are explained by the natural tendency of the spinel ferrites to aggregate as a result of their magnetic properties [1,7]. There are two solutions often proposed in the literature to mitigate this drawback: to coat the ferrites with polymers, inorganic oxides (silica) or carbonaceous materials [1,8,9] or to dope them with small amounts of rare-earth cations [10].
First, the coating procedures are expected to improve the adsorption performances not only by hindering the spinel ferrite aggregation but also by providing functional groups on their surface, which may participate in adsorption processes [1,11,12]. Chitosan (CS) is often proposed as an ideal candidate for coating the magnetic particles in view of anionic dye adsorption because of the presence of an important number of amino groups (NH2) [13]. The main concerns of using CS-based materials for the removal of dyes are related to its low chemical stability in acidic media [13]. The need to improve the chemical stability of this nontoxic and biodegradable polysaccharide has led to its modification by cross-linking reactions [14]. In this respect, several cross-linking agents were successfully used to enhance the CS resistance in acid media by ionic bonds (i.e., pentasodium tripolyphosphate [15] and sulfuric acid [16]) or by covalent bonds (i.e., glutaraldehyde [17] and ethylene glycol [15,16]). Nevertheless, for anionic dye adsorption, the use of cross-linking agents that involve exclusively the reaction of hydroxyl groups, such as epichlorohydrine (ECH), was suggested as the amino groups are expected to play a key role for the anion adsorption process [13,14].
Second, we demonstrated that doping the spinel ferrites with lanthanide ions leads to the modification of structural, dimensional, and magnetic properties of this kind of oxides. In this respect, we observed that the grain and crystallite sizes as well as the magnetization values of spinel ferrites decrease by rare-earth ion doping [4,18,19]. Other authors showed that these findings are beneficial for improving the adsorption of anionic dyes on ferrites [10].
Therefore, this study aims to combine both approaches of enhancing the spinel ferrite adsorption capacity by coating the samarium-doped cobalt ferrite with CS cross-linked with ECH. To the best of our knowledge, this is the first report dealing with the adsorptive removal of anionic dyes by functionalized rare-earth–doped spinel ferrites.
2 Experimental section
2.1 Materials
Analytical reagent-graded cobalt nitrate [Co(NO3)2·6H2O], iron nitrate [Fe(NO3)3·9H2O], samarium nitrate [Sm(NO3)3·6H2O], and maleic anhydride [C4H2O3] were used to prepare the spinel ferrite material. CS of Mw 50–190 kDa and deacetylation degree ranging from 75% to 85% and ECH were used for the samarium-doped cobalt ferrite functionalization. Orange II (Tropaeolin 000 No. 2) azo dye with chemical formula C16H11N2NaO4S was selected as model anionic dye. All chemicals were used as purchased from Sigma–Aldrich without any purification.
2.2 Adsorbent preparation
2.2.1 Samarium-doped cobalt ferrite synthesis
Nanoparticles of cobalt ferrite doped with samarium cations with the chemical formula CoFe1.98Sm0.02O4 were synthesized by the sol–gel autocombustion method using nitrate cation precursors and maleic acid as combustion/chelating agent, following the protocol previously detailed for rare-earth–doped nickel ferrite preparation [4]. Note that, to the best of our knowledge, this is the first report of using maleic acid as fuel for rare-earth–doped cobalt ferrite synthesis.
2.2.2 Functionalization of samarium-doped cobalt ferrite
First, a 3% (w/v) CS solution was obtained by magnetically stirring CS in 2% (v/v) acetic acid solution at 35 °C for 6 h. Second, a ferrofluid of samarium-doped cobalt ferrite of 1% (w/v) was prepared by dispersing the CoFe1.98Sm0.02O4 nanoparticles in distilled water by ultrasonication for 40 min. The amount of spinel ferrite was designed to obtain a content of 15% (w/w) reported to the final solid material. Furthermore, the ferrofluid was mixed with the CS solution under ultrasonication for 1 h, until a homogeneous viscous dispersion was obtained. The as-obtained viscous solution was transferred in Petri dishes and dried in oven at 40 °C for 24 h until the water was completely removed (to constant weight). Afterward, the CS-functionalized spinel ferrite material (in the initial form of a composite membrane) was subjected to the cross-linking process. In this respect, the CoFe1.98Sm0.02O4@CS membrane was immersed in isopropyl alcohol at 40 °C for 30 min and the designed amount of ECH was slowly added (i.e., isopropyl alcohol: ECH = 15:7 (v/v)). The cross-linking bath was maintained under stirring (300 rpm) for 12 h and further the obtained sample was washed with ethanol and distilled water and dried at room temperature. Finally, the cross-linked membrane material (CoFe1.98Sm0.02O4@CS-ECH) was subjected to mechanical grinding and sieving to obtain functionalized particles with sizes less than 800 μm.
2.3 Materials characterization
The elemental analysis of the samarium-doped cobalt ferrite was realized by energy-dispersive X-ray fluorescence (XRF) using an EX-2600 X-Calibur SDD system, operated under vacuum. The formation of spinel phase was studied by X-ray diffraction (XRD) using Shimadzu LabX 6000 diffractometer with Cu Kα radiation (k = 1.54060 Å) and by infrared (IR) spectroscopy at room temperature in the mid-IR range using a Bruker Vertex 70 Fourier transform infrared (FTIR) spectrometer. The spectroscopic technique was also used to study the successful CS functionalization of the samarium-doped cobalt ferrite. Transmission electron microscopy (TEM; Hitachi High-Tech HT7700) was used for the morphological and dimensional characterization of the unmodified ferrite. The surface microscopic analysis of the functionalized material was performed by scanning electron microscopy (SEM; Quanta 200). Magnetic measurements of the studied materials were carried out using an MPMS3 (7 T) SQUID magnetometer, in DC mode, at ambient temperature, under an applied magnetic field of 10 kOe. The specific surface area, SBET, of the adsorbent was calculated from water vapor sorption capacity determined in dynamic regime by using the gravimetric analyzer IGAsorp supplied by Hiden Analytical (UK), equipped with an ultrasensitive microbalance. The adsorption and desorption isotherms were determined by measuring the weight change with the humidity variation at 25 °C. The material was first dried under nitrogen flow (250 mL/min) to constant weight of the sample at a relative humidity <1%.
Finally, the solid addition method was used to determine the point of zero charge (pHPZC) of the sorbent [20]. To this end, 20 mL of a 0.1 M NaCl solution was transferred into conical flasks. The initial pH values (pHi) of each solution (ranging from 4 to 10) were adjusted by adding HCl (0.1 M) or NaOH (0.1 M), respectively. Afterward, the total volume of the solution was adjusted to exactly 25 mL by adding 0.1 M NaCl solution. Then, 0.125 g of adsorbent was added and the resulting mixtures were agitated at 60 rpm for 24 h. The final pH values (pHf) of the solutions were then measured. The difference between the initial and final pH values (ΔpH) was plotted vs the value of pHi. The point of intersection with the abscissa of the resulting curve (ΔpH = 0) gave the pHPZC value.
2.4 Evaluation of adsorption capacity for anionic dye removal
The functionalized samarium-doped cobalt ferrite was used as adsorbent for the removal of Orange II from the aqueous solutions using batch mode. In this respect, calculated amounts of CoFe1.98Sm0.02O4@CS-ECH (sorbent dosage [SD] of 2 g/L) were added to 50 mL of Orange II solutions (50 mg/L), and the samples were stirred in an orbital shaker (equipped with a temperature control system) at 240 rpm for different periods of time. The adsorption tests were done at naturally occurring pH 6.2 and at three different temperatures (i.e., 298, 318, and 338 K, respectively). The spent adsorbent was removed from the suspension by applying an external magnet, and the resulting solutions were analyzed to determine the Orange II concentrations. The concentrations of the anionic dye in the resulting clear solutions were determined using a SPECORD 200 Analytik Jena UV–vis spectrophotometer by monitoring the absorbance at λmax = 495 nm.
The adsorption capacity q (mg/g) was determined using Eq. (1) and the color removal efficiency Y (%) was ascertained by Eq. (2), respectively [3,21]:
| (1) |
| (2) |
In addition, the adsorption process was modeled and optimized by investigation of the synergetic effect between pH and SD with the aim of enhancing the color removal efficiency.
3 Results and discussion
3.1 Characterization of samarium-doped cobalt ferrite (CoFe1.98Sm0.02O4)
The elemental composition for the CoFe1.98Sm0.02O4 ferrite was studied using the XRF technique. According to XRF data (spectrum not shown), a Fe/Co/Sm ratio of 1.97:1.00:0.02 was found, which was in very close agreement with the theoretical ratio (1.98:1.00:0.02). Furthermore, the CoFe1.98Sm0.02O4 particles were characterized from structural, morphological, and magnetic point of view (Fig. 1a–d). The analyzed material presents the XRD pattern depicted in Fig. 1a, which is typical for spinel ferrites. The clear observation of strong diffraction peaks at 30.1°, 35.5°, 37.2º, 43.1º, 53.4º, 57.1º, 62.6º, 74.3º, and 75.3º confirms the successful synthesis of a material with spinel structure and are attributed to the (2 2 0), (3 1 1), (2 2 2), (4 0 0), (4 2 2), (5 1 1), (4 4 0), (5 3 3), and (6 2 2) diffraction planes, respectively. However, some weaker diffraction lines are observed, additional to the peak characteristic for spinel structure, which indicates the presence of very small amounts of impurities. On the basis of the JCPDS card No. 40-1139, the impurity is identified as hexagonal Fe2O3. These observations are consistent with our previous findings showing that the insertion of rare-earth cations into the spinel matrix often leads to the segregation of single iron oxides at the grain boundaries [4,18]. The appearance of this impurity is due to the difference between the ionic radii of Fe3+ (0.645 Å) and Sm3+ (0.958 Å) [22]. It is important to note that no diffraction lines attributed to single samarium oxide and/or samarium orthoferrite were observed. This confirmed the successful insertion of the rare-earth cations into the spinel structure.
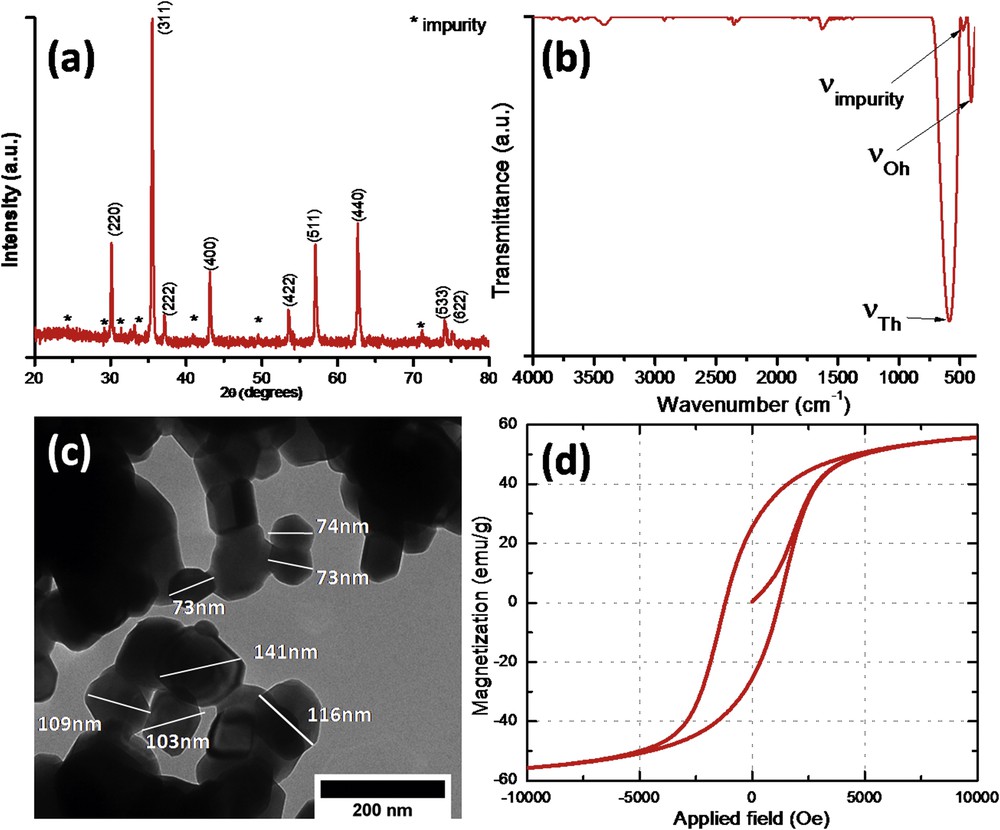
Characterization of CoFe1.98Sm0.02O4 nanoparticles: (a) XRD pattern; (b) IR spectrum; (c) representative TEM photomicrograph; and (d) room temperature hysteresis loop.
The IR spectrum of the CoFe1.98Sm0.02O4 recorded in the range 4000–350 cm−1 is depicted in Fig. 1b corroborating the X-ray analysis observations. Thereby, the strongest bands are attributed to the stretching vibration of the tetrahedral (νTh at about 600 cm−1) and octahedral (νOh at about 400 cm−1) metal–oxygen bonds, which are typical for spinel ferrites. The third band clearly observed between νTh and νOh is attributed to the hexagonal Fe2O3 impurity also observed in the XRD pattern. Our previous studies on rare-earth–doped spinel ferrites proved that the presence of the additional vibration band is explained by the presence of single oxides as a result of cation migration at grain boundaries once the bulky rare-earth cations are inserted in the spinel matrix [4,18]. The small bands in the range 4000–1500 cm−1 are attributed to the impurities present in KBr and/or to the atmospheric water and carbon dioxide.
The morphological and dimensional characterization of samarium-doped cobalt ferrites was realized by TEM analysis (Fig. 1c). The microscopic image shows the formation of homogenous nanostructures with irregular shapes. The dimensions of ferrite grains are ranging from about 70 to 150 nm. These nanoparticles tend to aggregate owing to their magnetic properties as observed from the hysteresis loop shown in Fig. 1d. The specific magnetization value of CoFe1.98Sm0.02O4 sample was found to be 55 emu/g. It is important to note that the literature reports magnetization values close to 85 emu/g for undoped cobalt ferrites obtained by wet chemistry procedures [10,23]. This magnetic behavior is typical for rare-earth–doped ferrites because the magnetization values are frequently smaller when lanthanide cations are present into spinel interstices [4,10,18,19].
3.2 Preparation and characterization of CS-functionalized samarium-doped cobalt ferrite (CoFe1.98Sm0.02O4@CS-ECH)
The achievement of the ferrite functionalization was verified by IR spectroscopy. Fig. 2 shows the FTIR spectrum of the functionalized product (CoFe1.98Sm0.02O4@CS-ECH). According to Fig. 2, absorption bands typical for the spinel ferrite are clearly observed in the range 600–400 cm−1 (red oval), which is in good agreement with Fig. 1b. In turn, characteristic bands for CS are observed in the range 4000–800 cm−1. These adsorption bands are assigned as follows: OH stretching vibrations in the range 3500–3100 cm−1 (purple arrows); CH stretching bands in the range 3000–2800 cm−1 (light green arrows); the amide I CO stretching at about 1650 cm−1 (pink arrows); the primary amine NH bending at 1550 cm−1 (brown arrows); the amide II NH bending at 1420 cm−1 (blue arrows); the amide III CN stretching at about 1320 cm−1 (light blue arrows); and CO deformation in the range 1080–1020 cm−1 (gray arrows), respectively [24,25]. For comparison purpose, the pristine CS spectrum was also registered. By comparing both spectra, one may observe that the cross-linking process led to a strong decrease in the intensity of the band attributed to OH stretching vibrations and to the increase of CH stretching bands. Likewise, it is important to note that the intensities of the amine bands were almost unaffected by cross-linking. These facts suggested that the cross-linking reaction occurred predominantly at the hydroxyl groups of the CS. The gain in IR signal for CH bonds is provided by the presence of ECH.
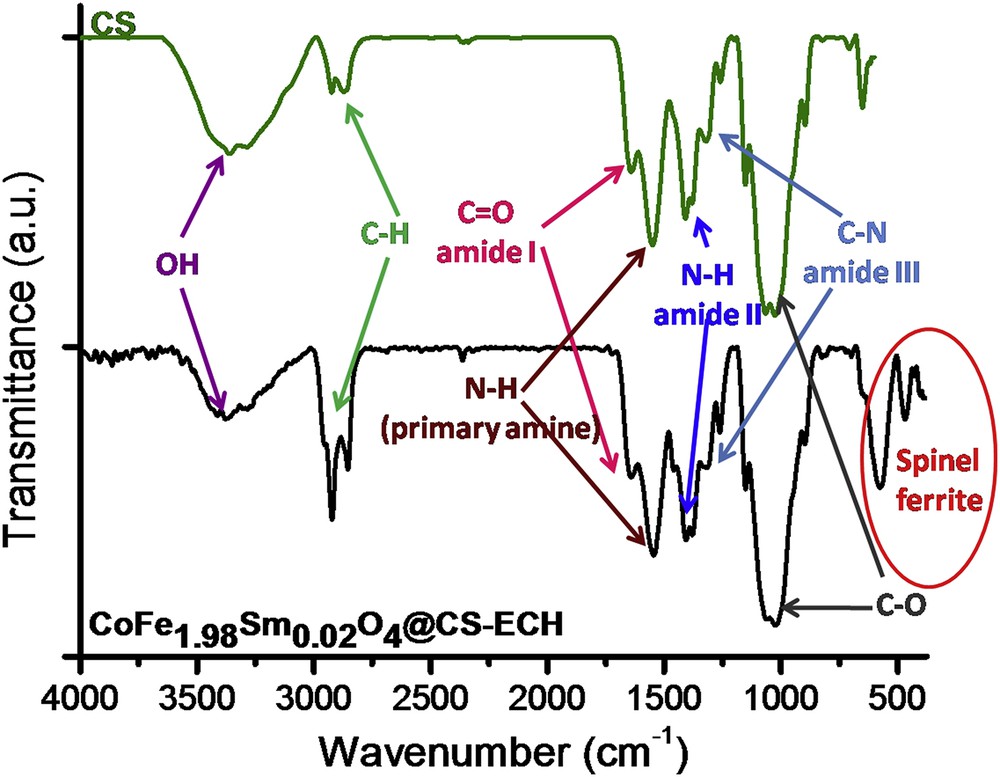
IR spectra of pristine CS and CoFe1.98Sm0.02O4@CS-ECH.
Representative SEM images of the produced adsorbent are presented in Fig. 3a and b at different resolutions. From these micrographs, one may observe that the micron-sized particles are homogenous and plate-like in shape. The surface of the adsorbent can be described as rough and folded. The results reported in the literature are suggesting that the roughness of the sorbent surface can positively affect the adsorption performance by increasing the contact area [26]. Likewise, the samarium-doped cobalt ferrite nanoparticles are homogenously distributed into the CS matrix. On the other hand, the aggregation tendency is clearly diminished once the CoFe1.98Sm0.02O4 nanoparticles were functionalized with CS. According to Fig. 4, the specific magnetization of this material is only 7 emu/g as compared to 55 emu/g for the unmodified rare-earth–doped cobalt ferrite. The strong decrease in saturation magnetization value is predictable considering that the CoFe1.98Sm0.02O4@CS-ECH sample contains only 15% w/w magnetic oxide. Nevertheless, the produced material can be easily recovered from aqueous solutions after adsorption tests by using an external magnet, as can be observed from the inset in Fig. 4.
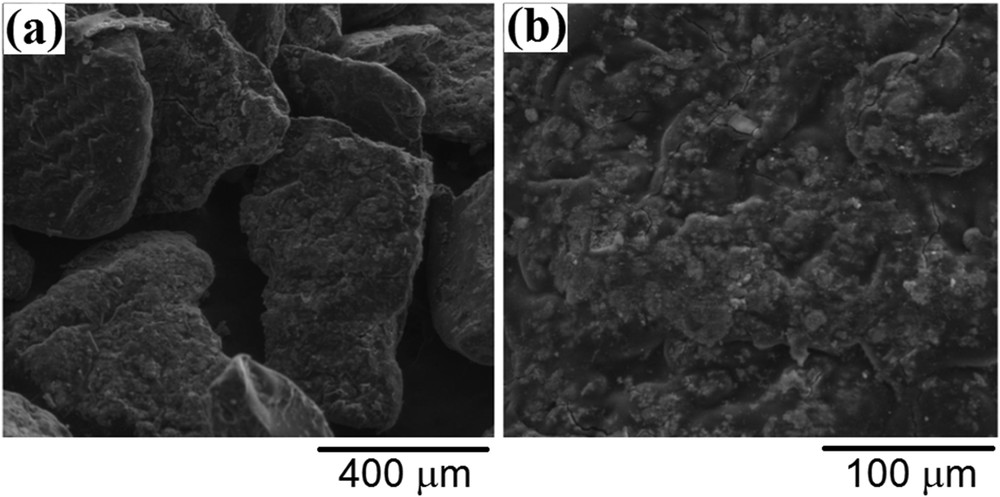
Representative SEM photomicrographs of the CoFe1.98Sm0.02O4@CS-ECH sample at different resolutions: (a) 250×; (b) 1000×.
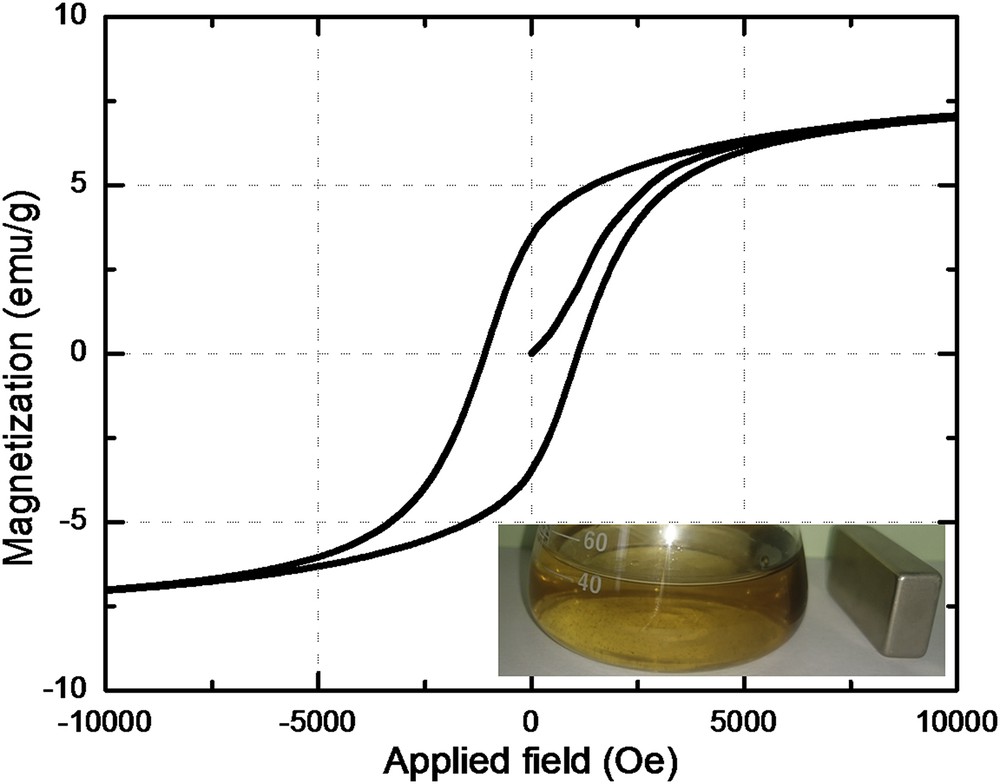
Room temperature hysteresis loop for the CoFe1.98Sm0.02O4@CS-ECH sample and magnetic separation after adsorption test (inset).
Adsorption–desorption isotherm of water vapors determined for the CoFe1.98Sm0.02O4@CS-ECH sample is depicted in Fig. 5a. According to the IUPAC classifications, the isotherm is type III with an H3 hysteresis loop [27]. The type III isotherm is characteristic for relatively weak adsorbent–adsorbate interactions and the H3 hysteresis type is characteristic for nonrigid aggregates formed by plate-like particles. These results are in good agreement with SEM observations. The specific surface area was determined using the Brunauer–Emmett–Teller (BET) method and the calculated value was 443 m2/g. Otherwise, the pHPZC of the CoFe1.98Sm0.02O4@CS-ECH adsorbent was found to be 5.84 (Fig. 5b). Thus, below this value the sorbent surface was positively charged, whereas over pH 5.84 the surface acquired negative charge.
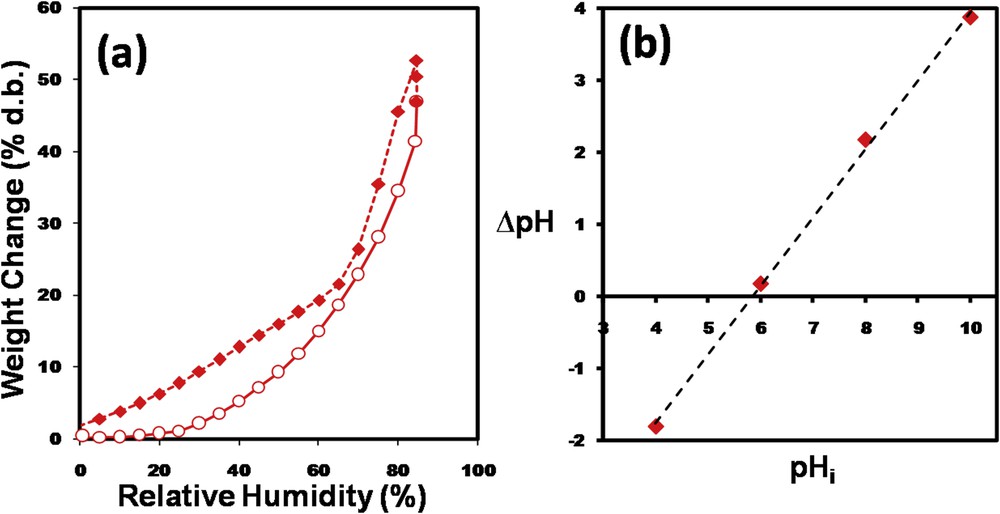
(a) Adsorption–desorption isotherm of water vapors in dynamic mode and (b) plot of ΔpH versus pHi for the determination of the point of zero charge for the CoFe1.98Sm0.02O4@CS-ECH sorbent.
3.3 Adsorption properties of CS-functionalized samarium-doped cobalt ferrite
3.3.1 Adsorption kinetics and isotherms
The kinetic study of the adsorption of anionic dye Orange II onto CoFe1.98Sm0.02O4@CS-ECH was carried out to evaluate the rate of the adsorption process. In addition, the adsorption isotherms were investigated to determine the relation between the equilibrium dye concentration and the adsorption capacity. Hence, Fig. 6a shows the amount of Orange II adsorbed q (mg/g) against the contact time t (min) at 298 K. In turn, Fig. 6b illustrates the quantity of anionic dye adsorbed at equilibrium qe (mg/g) vs the equilibrium concentration Ce (mg/L) after 180 min at 298, 318, and 338 K, respectively.
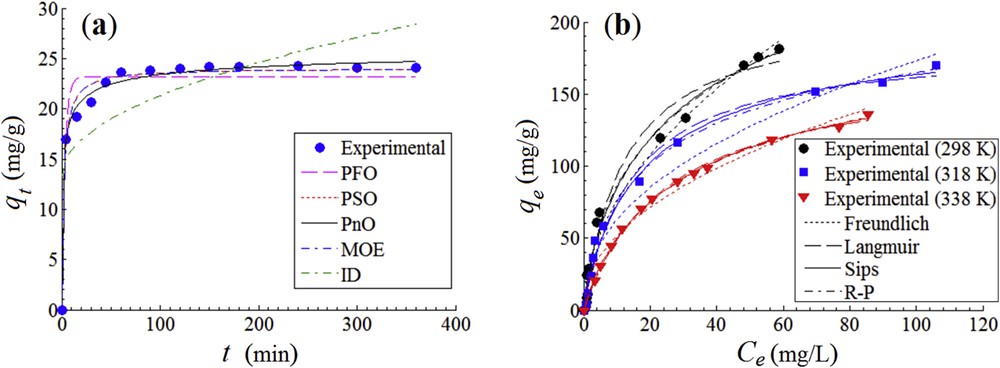
Orange II adsorption onto CoFe1.98Sm0.02O4@CS-ECH: (a) adsorption kinetics data; conditions: T = 298 K; SD = 2 g/L; C0 = 50 mg/L; pH 6.2; (b) adsorption isotherms data; conditions: t = 180 min; SD = 2 g/L; pH 6.2.
Kinetic models are given as nonlinear equations in Table 1 [28,29]. Furthermore, isotherm modeling equations used in this study are summarized in Table 2 [28–30]. The goodness-of-fit between models and observations was ascertained in terms of sum of absolute errors (Ɛa) and chi-square test (χ2) using Eqs. (3) and (4), respectively [31]:
| (3) |
| (4) |
Kinetic models, rate equations, and parameters for Orange II adsorption onto the functionalized sorbent material CoFe1.98Sm0.02O4@CS-ECH; experimental conditions: T = 298 K; SD = 2 g/L; C0 = 50 mg/L; pH 6.2.
| Model | Rate equation | Parameters |
| PFO | qe = 23.2129 (mg/g); k1 = 0.3102; εa = 13.9703; χ2 = 1.1807 | |
| PSO | qe = 24.0392 (mg/g); k2 = 1.97 × 10⁻²; εa = 8.1192; χ2 = 0.460 | |
| PnO | qe = 27.266 (mg/g); kn = 4.7641 × 10⁻⁵; n = 4.1116; εa = 6.0897; χ2 = 0.1855 | |
| MOE | qe = 24.039 (mg/g); K1 = 3.1072 × 10⁻⁶; K2 = 1.9672 × 10⁻²; εa = 8.124; χ2 = 0.4605 | |
| ID | kd = 0.7933; J = 13.3537; εa = 30.7229; χ2 = 4.6435 |
Isotherm models, equations, and parameters for the adsorption isotherms.
| Model | Equations | Parameters |
| Freundlich | KF, nF | |
| Langmuir | qm, KL | |
| R-P | A, B, g | |
| Sips | qS, b, nS | |
| D-R | qD, KD, ES; ε- Polanyi potential |
The parameters of kinetic models for Orange II adsorption onto functionalized sorbent were determined by the Gauss–Newton nonlinear regression method. The calculated values of parameters are reported in Table 1 along with the sum of absolute errors (Ɛa) and chi-square test (χ2) values.
According to Fig. 6a and error function values (Table 1), the best-fitting of kinetic data was predicted by the pseudo-n-order kinetics (PnO) model that provided the smallest Ɛa and χ2 values as compared to the other studied models. The order of PnO rate equation converged to n = 4.1. In contrast, the intraparticle diffusion model showed the lowest prediction level for the experimental data (Fig. 6a and Table 1/error functions). Additional kinetic models, that is, pseudo–first-order, pseudo–second-order, and mixed 1,2-order kinetics are in reasonable agreement with experimental data, mainly if we consider exclusively the χ2 values. The experimental kinetics data unveiled an equilibrium adsorption capacity equal to 24 mg/g, for the selected test conditions.
To reveal isotherms, the adsorption of Orange II onto the CoFe1.98Sm0.02O4@CS-ECH material was studied against equilibrium concentration at three different temperatures (298, 318 and 328 K). According to kinetic outcomes, the contact time was fixed at t = 180 min to attain the equilibrium adsorption for isotherms. Fig. 6b displays isotherm data highlighting a detrimental influence of the temperature increase over the adsorption process of Orange II onto functionalized ferrite. Thus, a lower level of temperature is preferred to improve the adsorption performance of the produced material. Such a trend was also observed in our previous study dealing with the adsorption of an anionic dye onto unfunctionalized spinel ferrites [3]. It should be mentioned that the maximum observed adsorption capacity from isotherm experiments was found to be 182 mg/g at 298 K.
Experimental data obtained at equilibrium were fitted by isotherm models with two and three parameters, that is, Freundlich, Langmuir, Sips, Redlich–Peterson (R-P), and Dubinin–Radushkevich (D-R) models (Table 3). The isotherm parameters were determined also by nonlinear regression technique (Gauss–Newton method). As for adsorption kinetics, the goodness-of-fit for isotherm models was evaluated via the sum of absolute errors and chi-square test. Overall, minimal error function values were attained for R-P model, suggesting the best fit for the adsorption data. Likewise, small error function values were also observed for Langmuir and Sips models highlighting the well-behaved predictions. In contrast, Freundlich equation unveiled a satisfactory fitting, but with less precision as compared with R-P, Langmuir, and Sips models.
Isotherm parameters for Orange II adsorption onto the functionalized sorbent material CoFe1.98Sm0.02O4@CS-ECH; experimental conditions: t = 180 min; SD = 2 g/L; pH 6.2.
| Isotherm model/parameters | Adsorbent: CoFe1.98Sm0.02O4@CS-ECH | ||
| T = 298 K | T = 318 K | T = 338 K | |
| Freundlich KF (mg/g) (L/g)1/nF nF | KF = 23.5419 nF = 1.9670 εa = 86.927 χ2 = 38.08 | KF = 22.6541 nF = 2.2651 εa = 123.71 χ2 = 49.905 | KF = 17.6943 nF = 2.1498 εa = 56.658 χ2 = 7.0736 |
| Langmuir KL (L/mg) qm (mg/g) | KL = 0.0801 qm = 209.2987 εa = 105.07 χ2 = 23.818 | KL = 0.0672 qm = 185.4670 εa = 69.288 χ2 = 20.504 | KL = 0.0402 qm = 170.1099 εa = 19.674 χ2 = 0.63348 |
| Redlich–Peterson A (L/g) B (L/mg) g | A = 26.3456 B = 0.3764 g = 0.7380 εa = 78.892 χ2 = 23.72 | A = 16.1461 B = 0.1644 g = 0.8642 εa = 59.439 χ2 = 21.013 | A = 8.2571 B = 0.0868 g = 0.8763 εa = 13.524 χ2 = 0.40295 |
| Sips qS (mg/g) b (g/mg) nS | qS = 301.9408 b = 0.0698 nS = 1.3412 εa = 86.88 χ2 = 27.079 | qS = 202.6372 b = 0.0741 nS = 1.1418 εa = 65.998 χ2 = 22.813 | qS = 189.0675 b = 0.0460 nS = 1.1266 εa = 15.825 χ2 = 0.52694 |
| Dubinin–Radushkevichi qd (g/g) KD (mol2 kJ−2) ES (kJ/mol) | qd = 2.29611 KD = 5.14903 × 10⁻³ ES = 9.8542 r2 = 0.8926 | qd = 2.52459 KD = 5.06582 × 10⁻³ ES = 9.9348 r2 = 0.8531 | qd = 1.05778 KD = 3.59925 × 10⁻³ ES = 11.7863 r2 = 0.9805 |
In addition, the separation factor RL, which is a dimensionless parameter of the adsorption equilibrium, was calculated by Eq. (5) to determine the type of the adsorption system (i.e., favorable or unfavorable) [30]:
| (5) |
In our particular case, we found an RL factor varying from 0.02 to 0.83, suggesting a favorable adsorption process for all considered temperature levels [32].
Moreover, on the basis of the D-R isotherm equation (Table 2), the mean free energy of adsorption, ES (kJ/mol), was calculated to identify the physical or chemical nature of the adsorption process. The energy values (ES), reported in Table 3, ranged from 9.85 to 11.78 (kJ/mol) depending on temperature. These values are included into the range of 8–16 kJ/mol suggesting that the ion exchange mechanism is predominant [33] for this adsorption system. The thermodynamic parameters for Orange II adsorption onto CoFe1.98Sm0.02O4@CS-ECH were calculated using the equations reported in Ref. [30]. The calculated values of thermodynamic functions were found to be as follows, ΔG = −26.278 ± 0.790 kJ/mol; ΔH = −14.266 kJ/mol, and ΔS = 37.776 ± 0.915 J/K mol. These values suggested that the studied adsorption process occurred spontaneously (negative ΔG value) accompanied by the exothermic effect (negative ΔH value). The positive value of entropy ΔS indicated the affinity between anionic dye molecules (Orange II) and functionalized ferrite surface.
3.3.2 Effects of pH and SD: modeling and optimization
In this section, the influence of pH and SD factors on the adsorption performance was investigated by using the design of experiments (DoE) and response surface methodology. DoE involves the exploration of a process via simultaneous variation in the levels of input variables (factors). In accordance with DoE methodology, the number of experimental runs is lower as compared to the conventional one-variable-at-a-time approach. Consequently, DoE diminishes time and resources needed for the investigation. Theoretical background related to DoE and response surface methodology is widely reported in the specialized literature [34–37].
In this study, the synergetic effect of two factors (pH and SD) was investigated with the aim to improve the adsorption performance (i.e., color removal efficiency, Y). The considered constant conditions for experiments were C0 = 50 mg/L (initial dye concentration), t = 180 min (contact time), and T = 298 K (temperature). For modeling protocol, the input factors were normalized into coded variables with the same dimensionless scale [34,35,37].
Experimental data were collected according to a central composite design (rotatable type) summarized in Table 4. Herein, both coded variables (x1 and x2) and actual factors (pH and SD) are reported. The DoE (Table 4) involves 11 experimental runs, where run numbers 9–11 were used to test the experiment reproducibility. On the basis of collected data (Table 4), a fitted model was developed using the multiple regression technique [34–37]. This model in terms of coded variables (x1 and x2) may be written as follows:
| (6) |
Central composite design of rotatable type used for experimentation and investigation of the adsorptive removal of Orange II dye onto CoFe1.98Sm0.02O4@CS-ECH sorbent; considered constant conditions: C0 = 50 mg/L; t = 180 min; T = 298 K.
| Run | Initial pH of solution | Sorbent dosage | Color removal efficiency (response) | ||
| x1 | pH | x2 | SD (g/L) | Y (%) | |
| 1 | −1 | 4.0 | −1 | 2 | 96.06 |
| 2 | +1 | 8.0 | −1 | 2 | 95.79 |
| 3 | −1 | 4.0 | +1 | 4 | 92.69 |
| 4 | +1 | 8.0 | +1 | 4 | 92.99 |
| 5 | −1.414 | 3.2 | 0 | 3 | 93.81 |
| 6 | +1.414 | 8.8 | 0 | 3 | 94.13 |
| 7 | 0 | 6.0 | −1.414 | 1.58 | 96.29 |
| 8 | 0 | 6.0 | +1.414 | 4.41 | 91.10 |
| 9 | 0 | 6.0 | 0 | 3 | 93.66 |
| 10 | 0 | 6.0 | 0 | 3 | 93.73 |
| 11 | 0 | 6.0 | 0 | 3 | 93.69 |
The fitted model (Eq. (6)) was verified for the adequacy using the analysis of variance (ANOVA) [35–37]. Outcomes of ANOVA statistical test are summarized in Table 5. Because of small P value (0.001), the model is considered statistically significant and can be used to navigate the design space. The value of determination coefficient R2 points out that the model can explain more than 96% of data variation. The adjusted correlation coefficient R2adj is close to R2, suggesting that the quadratic model with all terms provides an acceptable prediction. According to Fig. 7, the agreement between predicted and actual response is reasonable. Ultimately, the final model was developed in terms of actual factors establishing the functional correlation between input variables (pH and SD) and the color removal efficiency (i.e., response, Y). The final empirical model can be written as
| (7) |
ANOVA test for the fitted model .
| Source | DFa | SSb | MSc | F valued | P valuee | R2f | Radj2g |
| Model | 5 | 23.422 | 4.684 | 29.2954 | 0.0010 | 0.967 | 0.934 |
| Residual | 5 | 0.799 | 0.160 | ||||
| Total | 10 | 24.221 |
a Degrees of freedom.
b Sum of squares.
c Mean square.
d Ratio between mean squares.
e Probability of randomness.
f Coefficient of determination.
g Adjusted coefficient of determination.
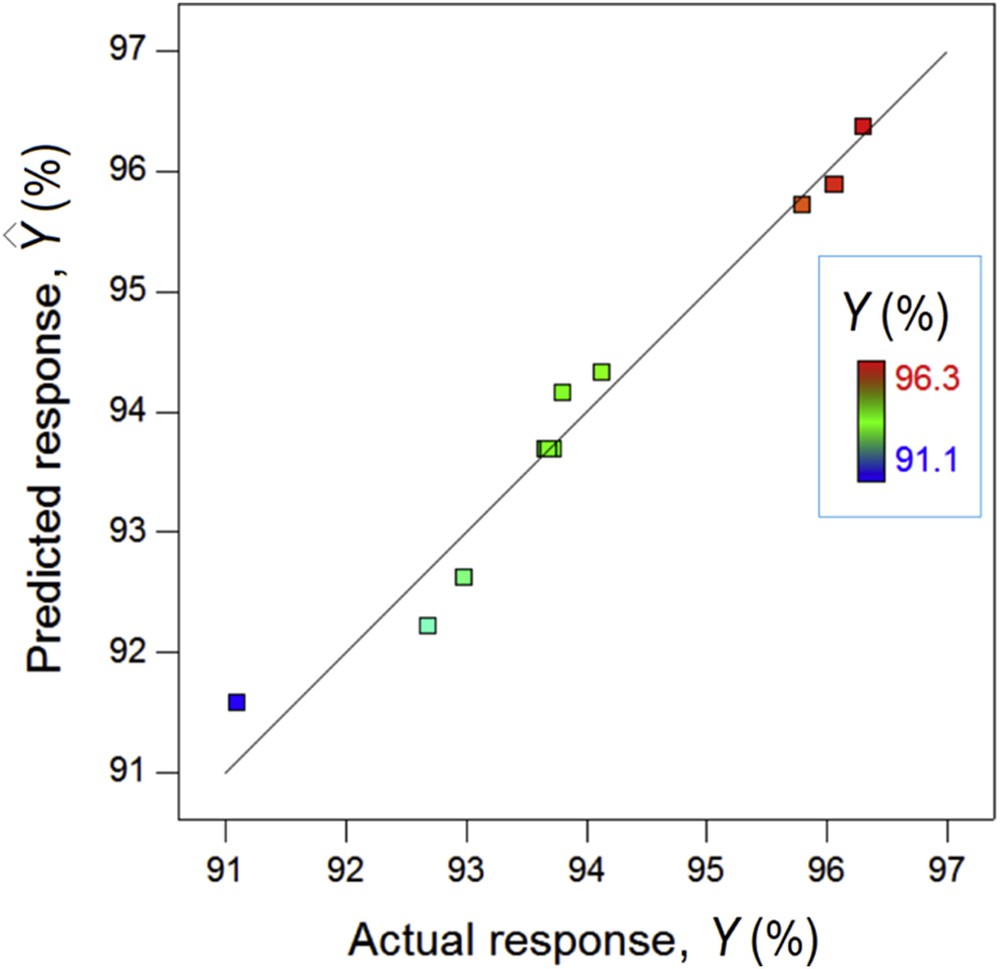
Goodness-of-fit plot showing the agreement between actual and predicted response values, color points by value of the response—removal efficiency Y (%).
On the basis of the data-driven model (Eq. (7)), the response surface plot and contour-line map were developed to show the coupling effects of factors on the response (Fig. 8). As can be seen in Fig. 8, the most significant factor influencing the removal efficiency is the SD. Surprisingly, the increment of this factor results in the response diminishing. In other words, a lower SD yielded better removal efficiency. This might be explained by the equilibrium between adsorption and desorption of dye on/from the solid surface resulting in higher removal efficiency at lower SD. This observation suggests a good efficiency of the developed sorbent even in a small amount owing to a great number of functional amino groups of CS. The second factor (pH) as well as the interaction effect between pH and SD has a diminished importance on the adsorption performance. This might be attributed to the tautomeric equilibrium for the Orange II dye.
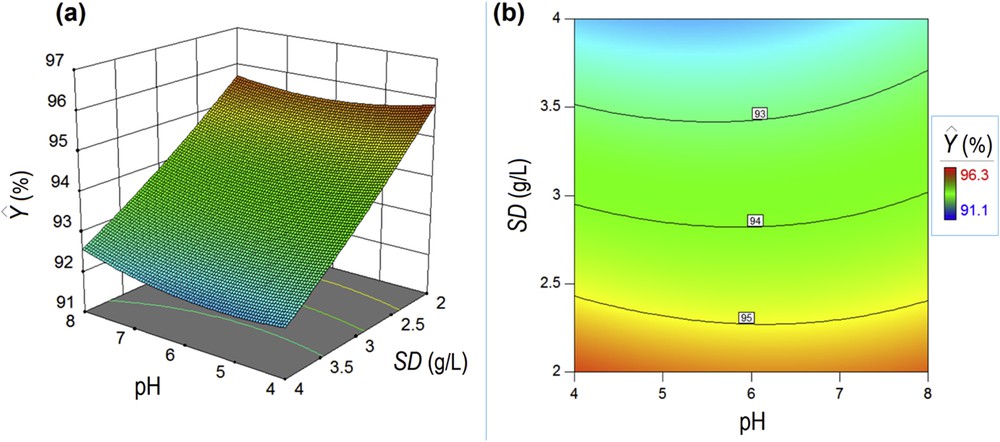
Response surface plot (a) and contour-line map (b) showing the coupling effects of pH and SD factors on the color removal efficiency Y (%).
The model-based optimization was performed by stochastic simulation using the Monte-Carlo method [38,39]. The optimal values of factors were found to be pH 5.2 and SD = 1.60 g/L. The optimal pH of 5.2 is less than the pHPZC value (i.e., 5.84) meaning that in optimal conditions the adsorbent is positively charged to successfully interact with the anionic dye (Orange II). In such conditions, the maximal adsorption performance (response) was equal to 96.324 (predicted) and 96.31% (observed). All computations performed in this article were done by means of SciLab-5.5.2 and Design-Expert 10 software.
3.4 Sorbent reuse and recovery
As mentioned in Section 1, one of the main advantages of using spinel ferrites and spinel ferrite-based materials as adsorbents for the removal of organic dyes from aqueous solutions is represented by the possibility of their magnetic extraction from reaction environment along with their well-known chemical stability [1]. To study this aspect, in our particular case, the spent adsorbent was recovered after adsorption test in the presence of an external magnetic field. Furthermore, the sample was evaluated to determine the reuse capacity and to recover the magnetic part of the material.
3.4.1 Reuse tests
The used adsorbent was added to a flask containing 15 mL of 0.1 M NaCl solution to provoke the Orange II desorption. The flask was then shaked for 30 min at 240 rpm at room temperature and the resulting solution was analyzed to determine the Orange II concentration. The adsorbent was subjected to three consecutive use/reuse cycles to determine its stability and adsorption capacity. Desorption efficiency was ranging from 13% to 15% in 0.1 M NaCl solutions. Also, the adsorption performances for each use/reuse cycle are presented in Fig. 9. From Fig. 9 data, one may observe that the adsorption capacity of the material is practically unchanged during the adsorption–desorption cycles suggesting the successful chemical functionalization of the samarium-doped cobalt ferrite.
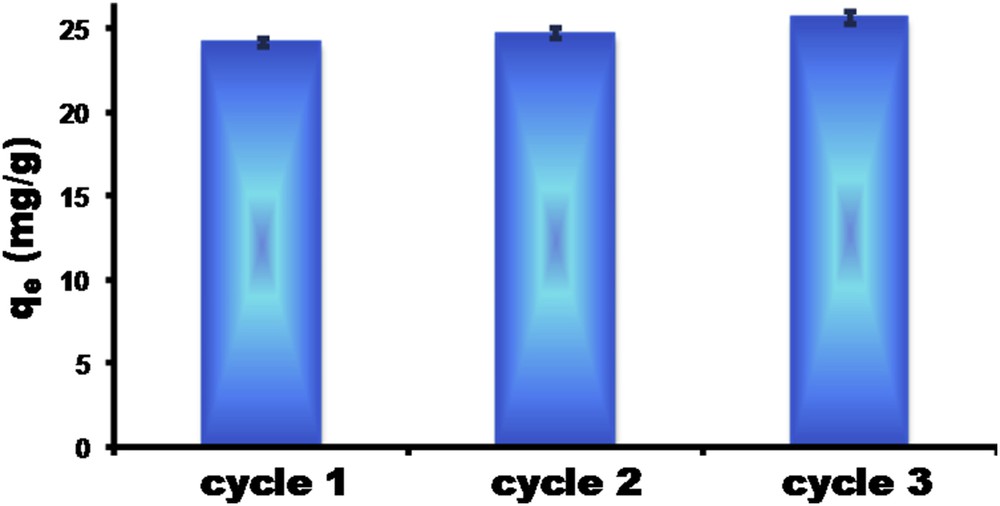
Adsorption capacity of CoFe1.98Sm0.02O4@CS-ECH for three consecutive use/reuse cycles.
3.4.2 Recovery of samarium-doped cobalt ferrite
After reuse tests, a sample of spent adsorbent was dried overnight in an oven at 100 °C and then heat-treated at 700 °C for 4 h to burn all the organic material (CS and adsorbed dye). Finally, the sample was analyzed by FTIR spectroscopy and TEM.
The IR spectrum of the recovered samarium-doped cobalt ferrite is shown in Fig. 10a and a representative TEM micrograph is reported in Fig. 10b. One can notice a very good match between the IR spectra of the pristine and recovered CoFe1.98Sm0.02O4 (Fig. 1b vs Fig. 10a) with the main adsorption bands clearly observed in the range 600–400 cm−1. Moreover, the TEM micrograph analysis showed no differences between the sizes and shapes observed for the pristine sample as compared to the recovered material (Fig. 1c vs Fig. 10b). Therefore, the recovered CoFe1.98Sm0.02O4 nanoparticles can be resubjected to a new functionalization procedure and reused for other adsorption experiments without any modifications.
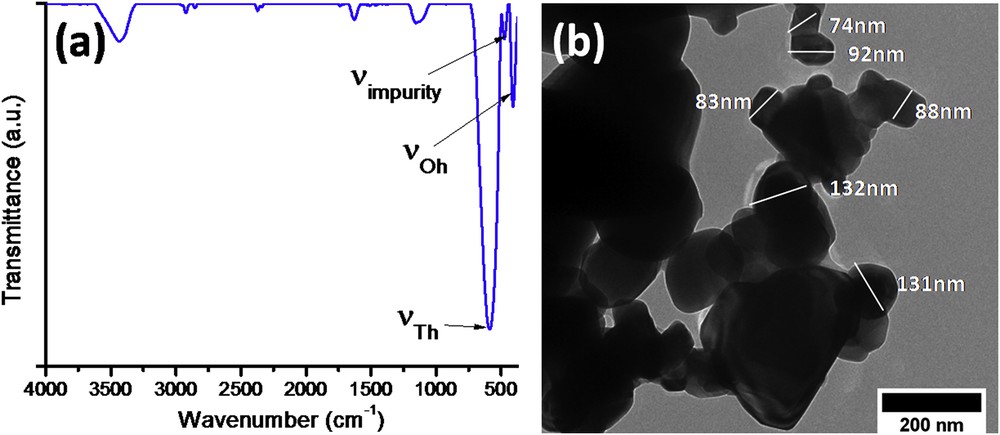
Characterization of recovered CoFe1.98Sm0.02O4 nanoparticles: (a) IR spectrum and (b) representative TEM photomicrograph.
4 Conclusions
Samarium-doped cobalt ferrite nanoparticles were successfully obtained by the sol–gel autocombustion technique using maleic acid as fuel, for the first time. The insertion of the samarium cations into cobalt ferrite spinel structure was proved by XRF, XRD, FTIR spectroscopy, and magnetic measurements. The spinel-structured compound was functionalized with CS and ECH, without affecting the NH2 groups, to obtain a novel magnetic material stable in aqueous media, as proven by IR spectroscopy and magnetometry. The ability of the CS-functionalized samarium-doped cobalt ferrite for anionic dye adsorption was investigated. The kinetic study of the adsorption showed that the experimental data were best fitted by the PnO model with the order for the rate equation of n = 4.1 and the equilibrium adsorption capacity value equal to 24 mg/g. Concerning the adsorption isotherms, the R-P model revealed the best fit to the observed data. The maximum observed adsorption capacity was of 182 mg/g at 298 K. The mean free energy values (ES) determined from the D-R isotherm suggested that the adsorption process was based on the ion exchange mechanism. The model-based optimization proved a greater influence of the SD over color removal efficiency as compared to the pH factor. Moreover, the samarium-doped cobalt ferrites can be recovered after adsorption experiments without any structural and dimensional modifications, as demonstrated by FTIR and TEM analysis, and reused for further functionalization and adsorption applications.
Acknowledgments
This work was supported by a grant of the Romanian National Authority for Scientific Research and Innovation, CNCS—UEFISCDI, project number PN-II-RU-TE-2014-4-1266.