

1 Introduction
The current demand for high-quality proteins is increasing, especially for uses in food, biological, pharmaceutical, and chemical industries. The denaturation or the molecular structural change in proteins, caused by different operating factors, has become an important concern for many purposes. Indeed, filtration, mixing, pumping, drying, transport, delivery, and so forth are common industrial processes that significantly expose proteins to operating conditions and can cause loss of molecule properties and activity [1].
Although many studies [2–4] were performed in both domains to follow the path to denaturation or to simply understand the influence of physical parameters or additives, the denaturation mechanisms and kinetics are not well known. Denaturation is the process in which a protein evolves from an ordered native state to a less-ordered state, loses tridimensional native conformation and, as a consequence, can lose biological activity [5]. Consequently, a protein with an activity loss actually gives rise to serious problems when it is considered for therapeutic purposes. A denatured state exposes the buried hydrophobic residues, can favor hydrophobic interactions, and can lead to aggregation. The aggregation of proteins decreases the biological activity of the solution.
Protein denaturation can be easily achieved by exposure to a specific stress such as temperature [5], pH, shearing, organic solvent [4,6], pressure [7–9], nature of the contact surface [6,10], and so forth. All of these parameters can trigger conformation modifications at different levels. Most of the modifications can destabilize the folded state (native state [11]) and stabilize the unfolded state (state that will lead to a further denaturated molecule), thus favoring the formation of intermediates and even aggregates [4].
Lysozyme is the most used protein in both pharmaceutical and food industries, thanks to its interesting properties.
Discovered in 1922 by Alexander Fleming, the egg-white protein is a chain of 129 amino acids containing enzyme, cross-linked by disulfide bridges [12]. This molecule is often used industrially because lysozyme is inexpensive and remains relatively stable. Nowadays, lysozyme is commonly used not only in food industries (milk-based products, wine shelf-life, preservative for sea-food, fresh vegetables, and animal-based products [13–18]) but also as a bactericidal and anticancer agent [19], with anti-inflammatory and mucolytic effects. Lysozyme, indeed, kills bacteria (especially Gram-positive ones) by hydrolyzing its cell wall, thus it is understandable to be used as a natural antimicrobial agent [20].
At present, membrane filtration seems to be an adequate operation [21] to concentrate/separate/rectify protein concentration from an initial solution composed of solvent, different proteins or amino acids, and impurities. This type of separation process does not require chemical reagent addition or heat input, thus minimizing the risks of molecule denaturation and loss of biological activity. Nevertheless, the filtration operation generates constraints (shear stresses) in the fluid that goes through the porous medium. These shear stresses are related to the applied transmembrane pressure [22]. The problem of shear stress on protein structure is a subject of continuing interest as it is a common phenomenon in bioprocessing [23]. It was addressed in studies such as the study of Lesnierowski et al. [24], where ultrafiltration (UF) of lysozyme at different pressures (15, 20, and 30 bars) for 1, 2, and 5 h was performed. The study concluded that the studied molecules couple into larger agglomerates after UF of the protein solution in the respective conditions. However, in most of the studies, the focus is upon the impact of shear stress on the activity of the enzyme. For such, the review of Thomas and Geer [1] gives the guidelines for the previous performed research. As a general aspect, the exposure of a protein to a hydrodynamic flow can make a loss of molecule activity (reversible or not). As the review shows, this depends on the operating conditions and on the molecules studied. Rodŕiguez-Fernández et al. [25] highlighted that the action of shear forces in the membrane can cause a loss of the activity of the studied molecule.
Considering the important role of shear stress on the protein conformation, this study is focused on understanding the protein behavior during UF. The novelty of this work relies on the direct approach to study to which extent the filtration process affects the conformation of the lysozyme protein, while concurrently observing the protein denaturation (using high-performance liquid chromatography [HPLC] investigations) and the filtration performances in terms of selectivity and hydraulic performances [26]).
2 Materials and methods
2.1 Material and products
The chemical reagents used in the present work were vitamin B12 (VB12), lysozyme (Lys), l-tyrosine, and l-phenylalanine. Information regarding the substances used (formula, molar mass, Stokes radius, supplier, and purity) is presented in Table 1.
Information on the molecules considered for the filtration experiments.
| Product | Formula | Molar mass (g mol−1) | Stokes radius (Ǻ) | Supplier | Purity (%) |
| l-Phenylalanine | C9H11NO2 | 165.19 | 4.62 | Fluka | 99 |
| l-Tyrosine | C9H11NO3 | 181.19 | 4.97 | Fluka | 99 |
| Vitamin B12 | C72H100CoN18O17P | 1355.38 | 8.5 | Alfa Aesar | 98 |
| Lysozyme | – | 14,300 | 18.5 | Sigma | – |
2.2 Experimental setup
The filtration tests were carried out in a laboratory pilot plant supplied by Techniques Industrielles Appliquées (TIA, Bolène, France) using a tubular UF membrane provided by TAMI Industries (1 kDa, 25 cm length, and 7.2 mm internal diameter). This ceramic membrane is composed of a γ-alumina support and an active layer of TiO2, with an asymmetric pore structure. The pilot setup was described in previous work [27] and a schematic layout is presented in Fig. 1.
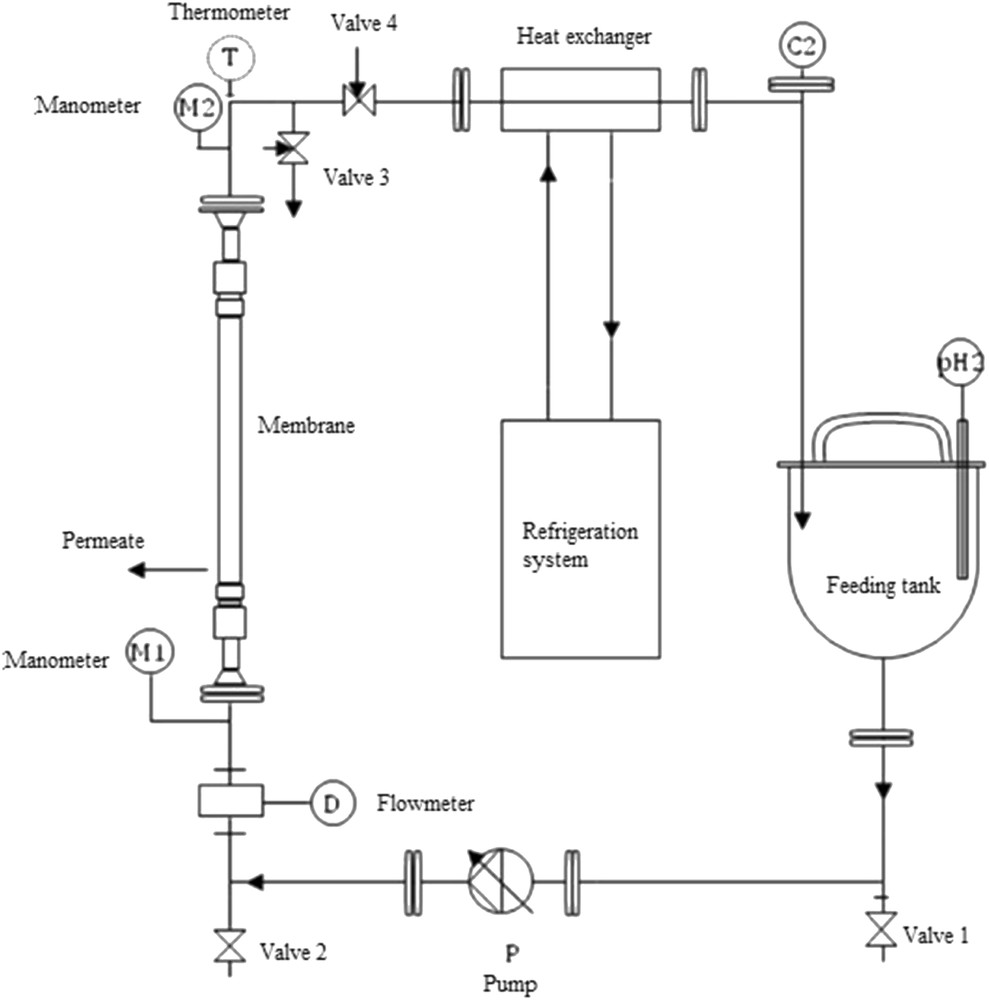
Schematic representation of the experimental setup.
The experimental setup, exclusively made from stainless steel, has the membrane embedded in a carter. A volumetric pump provides the fluid circulation from the 5 L feeding tank through the membrane.
A manual valve is used to control the transmembrane pressure. This pressure, also referred to as TMP in the literature, is measured upstream and downstream the membrane via two pressure sensors (manometer).
The temperature of the solution is maintained constant by a cooling unit (refrigeration system and heat exchanger), asset by circulation in contracurrent. As filtration carries on, the permeate is recovered at the carter outlet and sampled before recycling back into the feeding tank.
2.3 Experimental protocol
Before any filtration test, the membrane has to be conditioned to have the hydraulic properties stabilized. For this, filtration of demineralized water (also referred to in text as pure water) is performed at a constant pressure (5 bar) and flow rate (700 L/h) until the hydraulic performances of the membrane are stabilized. When the hydraulic performances remain constant, the conditioning process is considered to have ended and the obtained values are referred to as the initial hydrodynamic conditions.
Solutions of the chemical reagents mentioned earlier are prepared by dissolving the concerning substance (VB12, lysozyme, l-phenylalanine, or l-tyrosine) in 4 L of demineralized water (conductivity <1 μS/cm) to obtain the desired concentration. To ensure the adsorption equilibrium, the prepared solutions were let in the pilot for 12 h before the filtration experiments started.
The pilot operates in cross-flow filtration (the alimentation flux is parallel to the membrane surface) to minimize accumulation and, thus, the formation of clogging at the surface of the membrane. The experiments were performed at high flow velocities to avoid polarization concentration layer at the membrane surface (around 5 m/s) [28]. For each filtration test, the permeate flux was calculated by measuring the permeation flow rate. The solutions were filtrated at different pressures ranging from 4 to 12 bar, maintaining a constant flow rate (700 L/h) and a constant temperature (25 °C). At each pressure, samples from both retentate and permeate were taken for further analysis.
2.4 Regeneration protocol
After each series of filtration tests, the membrane was regenerated to regain its original hydraulic and selectivity properties. The regeneration process followed the same procedure: the membrane was immersed in water and let in the oven (T ≈ 105 °C) for several days (around 5 days) at atmospheric pressure. The water level was periodically adjusted to have the membrane completely submerged. Three regenerations were performed during the study. The following notations will be considered: the original membrane is referred to as M0, after one regeneration the membrane is referred to as M1, M2 after two, and M3 after three regenerations.
2.5 Membrane properties
After each experimental test, the hydraulic performances of the membrane were investigated by filtration of pure water. The permeation flux Jv (m3 m−2 s−1) was measured and plotted for different transmembrane pressures ΔP (Pa). The hydraulic permeability Lp (m3 m−2) was assessed by Eq. 1 (slope of the linear curve):
| (1) |
Size selectivity is investigated by studying transmission of the studied molecules. For this, the Nernst–Planck approach is used to investigate solute transmission. This model assumes that the active layer is constituted by cylindrical pores, equally sized, and uniformly dispersed. The flux of each constituent i is a differential equation of mass transfer in the active layer (Eq. 2):
| (2) |
| (3) |
| (4) |
The integration of the differential equation gives the following equation (Eq. 5):
| (5) |
2.6 Permeate and retentate analysis
2.6.1 UV–vis spectroscopy analysis
As the retentate and permeate of the solutions were sampled at different pressures, the concentration and the observed rejection rate can be calculated. Observed rejection rate and concentrations of both retentate and permeate samples were calculated using UV–vis spectroscopy (Lambda 35, Perkin Elmer Instrument) at corresponding wavelength (Table 2) using Eq. 6:
| (6) |
Chemical reagent solutions with their respective concentrations and UV–vis wavelengths.
| Solutions | Concentration (mol m−3) | Wavelengths (nm) |
| Vitamin B12 | 9.22 × | 362 |
| Lysozyme | 0.025 | 281 |
| l-Phenylalanine | 0.054 | 275 |
| l-Tyrosine | 2.48 | 275 |
2.6.2 HPLC analysis
For lysozyme filtration tests, both retentate and permeate samples were additionally analyzed using size-exclusion high-performance liquid chromatography (SEC-HPLC) to observe if there is any molecule denaturation or aggregation. SEC-HPLC can detect aggregation or denaturation of the protein based on the modification of the protein hydrodynamic radius in solution or by the decrease in the area of a chromatogram peak as previously shown by Huang et al. [30] for bovine serum albumin thermally denatured.
The chromatographic study was performed with Agilent 1100 Series chain (Agilent Technologies GmbH) equipped with a quaternary pump and connected to a UV detector. This chromatographer apparatus uses a 9.4 × 250 mm Zorbax Bio Series GF-250 column (also provided by Agilent Technologies). This column is recommended for the size separation of proteins with molecular weight in the range of 400,000–4000 g mol−1.
This type of analysis uses two phases: one stationary, represented by the sample solutions and one mobile, which consist of a mixture of solvents (called buffers) with high salt concentration or acids. One hundred microliters of the lysozyme solution at each pressure from both retentate and permeate was injected in the column at 25 °C and analyzed at a wavelength of 280 nm. The measures were carried using a buffer composed of phosphate-buffered saline, 0.1 wt % sodium dodecyl sulfate, and 0.005 wt % sodium azide (NaN3). The elution was carried out for 15 min. The flow rate was 1.0 mL/min.
3 Results and discussion
3.1 Filtration test
The sequence of filtrated solutions with the original membrane (referred to as M0) is presented in Table 3.
M0 (original membrane)—chronological sequence of filtrated solutions with obtained rejection rates and membrane permeability values.
| Test no. | Protein solution | Concentration (mM) | Rmax (%) | Calculated pore radius (nm) | Lp (10−14 m3 m−2memb) |
| Pure water after conditioning step | 6.2 | ||||
| 1 | l-Phenylalanine | 5.45 | 5 | 5.5 | |
| 2 | l-Tyrosine | 2.48 | 5 | 4.2 | |
| 3 | VB12 | 9.22 × 10⁻³ | 57 | 1.61 | 4.1 |
| 4 | Lysozyme | 0.025 | 85 | 3.6 | |
| 5 | Lysozyme | 0.025 | 93 | 3.3 | |
| 6 | VB12 | 9.22 × 10⁻³ | 75 | 1.27 | 3.2 |
| 7 | Lysozyme | 0.025 | 98 | 3.1 | |
| 8 | Lysozyme + VB12 | 0.025 + 9.22 × 10⁻³ | 99 + 81 | 1.17 | 2.8 |
| 9 | Lysozyme + VB12 | 0.025 + 9.22 × 10⁻³ | 100 + 87 | 1.08 | 2.3 |
| 10 | VB12 | 9.22 × 10⁻³ | 86 | 1.09 | 2.3 |
| 11 | l-Phenylalanine | 5.45 | 16 | 2.4 |
Table 3 also shows the filtration results in chronological order in terms of rejection rate (selectivity property), hydraulic permeability (hydraulic performances), and calculated pore radius. As expected, considering the cutoff of the membrane (1 kDa) and the characteristics of the respective molecules (Table 1), the lowest rejection rates were observed for the amino acids (l-phenylalanine and l-tyrosine).
The rejection sequence of proteins is in agreement with the molecule size, suggesting that steric exclusion was the preponderant phenomenon acting. As a general observed trend, after each filtration test, the rejection rate increases and the hydraulic performances of the membrane decrease. For VB12, the rejection rate increases as filtration tests are performed, so calculated pore radius decreases (as calculated by Eq. 5).
Fig. 2 shows the experimental rejection rates of VB12 for tests referenced 3, 6, and 10 in Table 3 with their corresponding simulation curves (dotted lines). With each filtration test performed (the experimental tests were performed with the same transmembrane pressures), a decrease in the permeation flux can be observed along with an increase in the rejection rate. This behavior indicates that the membrane becomes more selective, but the hydraulic performances decline.
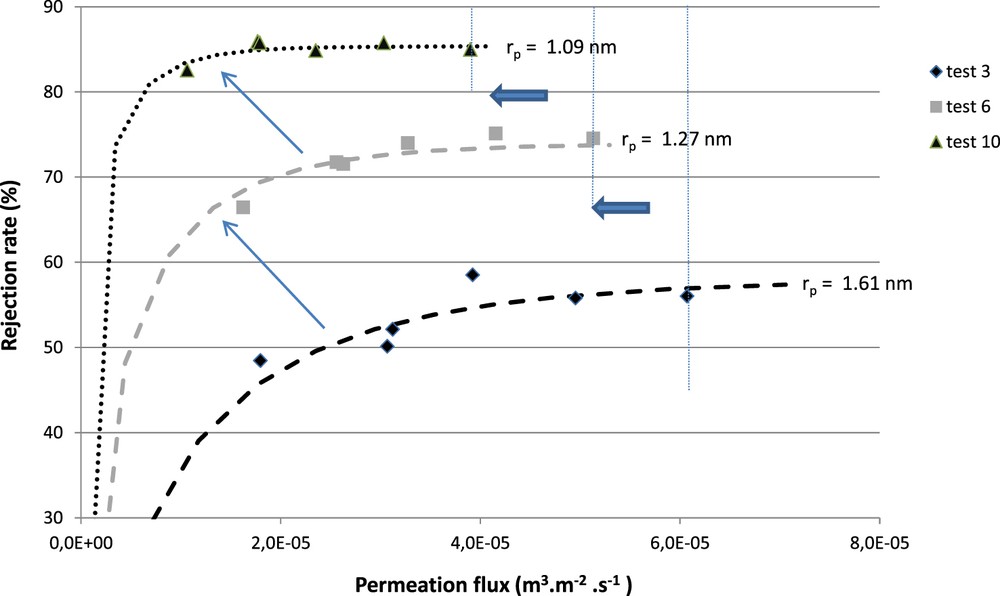
Experimental and numerical rejection rates of VB12 with the associated best-fitted mean pore radius.
Moreover, the successive filtration of the same molecule (lysozyme) shows a decrease in transmission and hydraulic permeability, which could indicate a possible adsorption of molecules at the surface of the active layer. This phenomenon is already observed and is significantly described and discussed in the literature [31,32]. The progressive clogging limits mass transfer of solvent and substantially increases the selectivity.
To complete the experimental investigation with additional filtration tests and characterizations, a regeneration process was performed three times to observe not only if the regeneration can actually reach the initial properties of the membrane, but also to study the degree to which the regeneration results can be reproduced. The studied membrane, M0, is called M1 after the first regeneration, M2 after the second, and M3 after the third thermal treatment. The results are presented in Table 4.
Rejection rate and hydraulic permeability obtained for membrane M1 (membrane after first regeneration), M2 (membrane after second regeneration), and M3 (membrane after third regeneration) for filtration tests performed (in chronological order).
| Solution | Membrane (M1) | Membrane (M2) | Membrane (M3) | |||
| R (%) | 1014 Lp (m) | R (%) | 1014 Lp (m) | R (%) | 1014 Lp (m) | |
| Water | 6.7 | 6.5 | 5.3 | |||
| VB12 | 32 | 5.9 | 40 | 5.2 | 40 | 4.8 |
| Lysozyme 1 | 87 | 4.5 | 90 | 4.7 | 96 | 4.3 |
| Lysozyme 2 | 95 | 5.0 | 95 | 4.5 | 99 | 4.3 |
| Lysozyme 3 | 100 | 4.2 | 97 | 4.0 | 99 | 3.9 |
| Lysozyme 4 | 100 | 2.7 | ||||
| VB12 | 66 | 4.7 | 73 | 4.0 | 85 | 2.7 |
| Tyrosine 1 | 9 | 4.3 | 9 | 3.8 | 15 | 2.7 |
| Tyrosine 2 | 12 | 4.2 | 15 | 3.8 | 18 | 2.7 |
| Tyrosine 3 | 12 | 4.2 | 14 | 3.6 | 16 | 2.7 |
| VB12 | 64 | 4.3 | 73 | 3.6 | 82 | 2.7 |
The results presented in Table 4 shows that the membrane has recovered the initial properties after the regeneration treatment in terms of hydraulic and selectivity performances.
The hydraulic permeability results are consistent with previous observed behavior: the hydraulic permeability performances decrease as filtration tests are performed. This behavior was observed even after three regeneration treatments. Results also show that after successive filtrations of VB12, the hydraulic permeability remains constant. Several tests were carried out to ensure the repeatability of this test. For example, the second filtration test of VB12 performed with membrane M1 (i.e., rejection rate = 66%, hydraulic permeability = 4.7 × 10⁻¹⁴ m) was successively carried out two times for the same results (data not shown). Such result was expected because VB12 is often used in filtration experiments and adsorption phenomena with this molecule are not reported in the literature. Starting from this observation, VB12 filtration tests were used to investigate and follow the membrane performances.
Three successive lysozyme filtration tests were performed after membrane regeneration. As a general observation, the hydraulic permeability decreased and the rejection rate increased rapidly up to 100%. After lysozyme filtration tests, the transmission of VB12 and the hydraulic permeability were significantly decreased, suggesting an adsorption of lysozyme molecules at the membrane surface or/and in the pores.
3.2 HPLC investigations
As mentioned before, HPLC investigations were performed on both retentate and permeate samples taken at different pressures to observe if there is any modification in the structure of the lysozyme as a result of the filtration.
The HPLC technique used was SEC, which is based on the exclusion of molecules according to their hydrodynamic volume in solution. The native state run was performed as a reference regarding peak characterization and/or retention behavior. The results of both retentate and permeate were, therefore, reported to the native lysozyme reference. The most obvious differences between the samples are the ones for the peak heights and areas.
Fig. 3 shows the chromatograms of retentate samples obtained during filtration test 2 of lysozyme with membrane M2 with regard to chromatogram of native lysozyme (black curve).
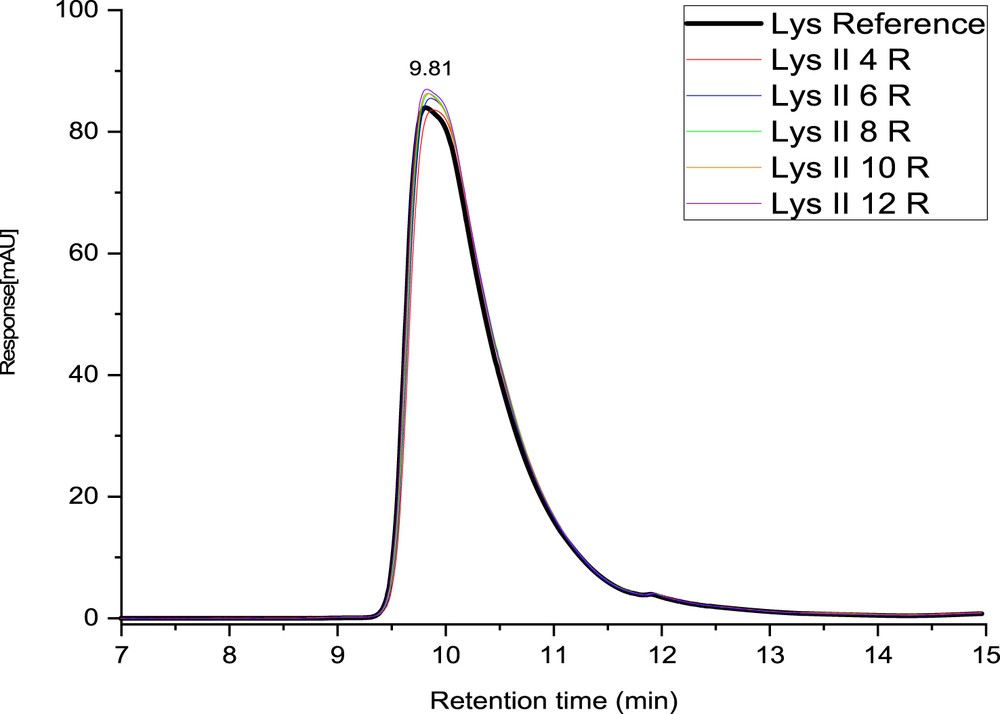
Chromatograms of retentate samples taken at different pressures (4, 6, 8, 10, and 12 bar, R = retentate sample at respective pressure) (test: lysozyme 2 (II)—membrane M2).
The chromatogram shapes are exactly the same for the five pressures and for the native lysozyme with an elution time of 9.81 min. The peak maximum corresponding to the retention time was registered at similar values, despite the difference in pressure. Because the values of the elution time were in the same range as the reference, it can be considered that the lysozyme molecule did not suffer any modification in its configuration and dimension in the retentate solution. These results are in good agreement with the literature. Indeed, the studies devoted to the influence of the pressure on the molecule conformation show that the hydrostatic pressure does not denaturate the lysozyme. Also, the shear stress due to recirculation is relatively low and negligible (around 70 Pa for a Reynolds number close to 35,000).
Moreover, no aggregates could be detected in the chromatograms. As soluble aggregates have a larger size than native lysozyme, they are expected to be eluted at a smaller retention time than the principal peak. The chromatogram shows an asymmetric profile of the peak, having a tailing. The asymmetry of a peak might suggest denaturation (complete or misfolding) [33], interactions between the protein and the surface of the column or could be because of the presence of impurities in the native lysozyme, which are concentrated as a result of filtration [34]. This last hypothesis seems to be more conceivable because when the lysozyme rejection increased, the secondary peak increased as well (Fig. 4).
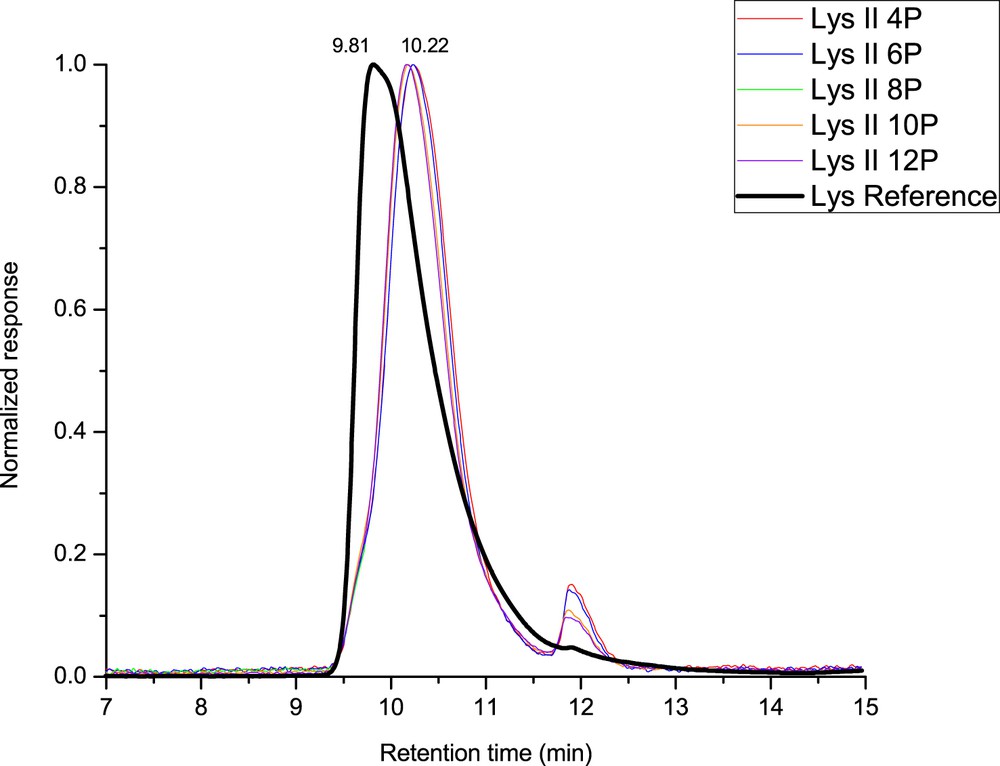
Chromatograms of permeate samples taken at different pressures (4, 6, 8, 10, and 12 bar, P = permeate sample at respective pressure) (test: lysozyme 2 (II)—membrane M2, peak intensity has been normalized for comparison).
Fig. 4 shows the chromatograms of permeate samples obtained during filtration test 2 of lysozyme with membrane M2 as compared with native lysozyme chromatogram. For a qualitative comparison, the chromatograms are normalized and overlaid. The native lysozyme studied by SEC-HPLC displayed one major asymmetric narrow chromatographic peak detected at an elution time of 9.81 min. Unlike for retentate samples, chromatograms related to permeate samples are shifted. The elution time for retentate samples was 10.22 min, indicating a significant change in the hydrodynamic radius of the lysozyme after filtration on the membrane. However, there is no observable difference according to transmembrane pressure. The shear stress because of the crossing through the porous medium (permeate) is very important as compared with the shear stress because of the retentate flow. It seems that the transmembrane pressure does not influence the molecule denaturation, whereas the shear stress is directly proportional to the applied transmembrane pressure. We think that the denaturation is due to the immediate vicinity of the molecule and the surface chemical groups inside of the pore and due to the necessity for the hydrated molecule (radius = 1.85 nm) to change its tridimensional conformation to go through the pore (radius <1.6 nm).
As it can be seen in Fig. 4, the permeate chromatogram was shifted toward an elution time of 10.22 min, but a shoulder still exists at a lower retention time. This shoulder can probably be attributed to the molecule of lysozyme in native conformation (detected at an elution time of 9.8 min) as can be seen in Fig. 5.
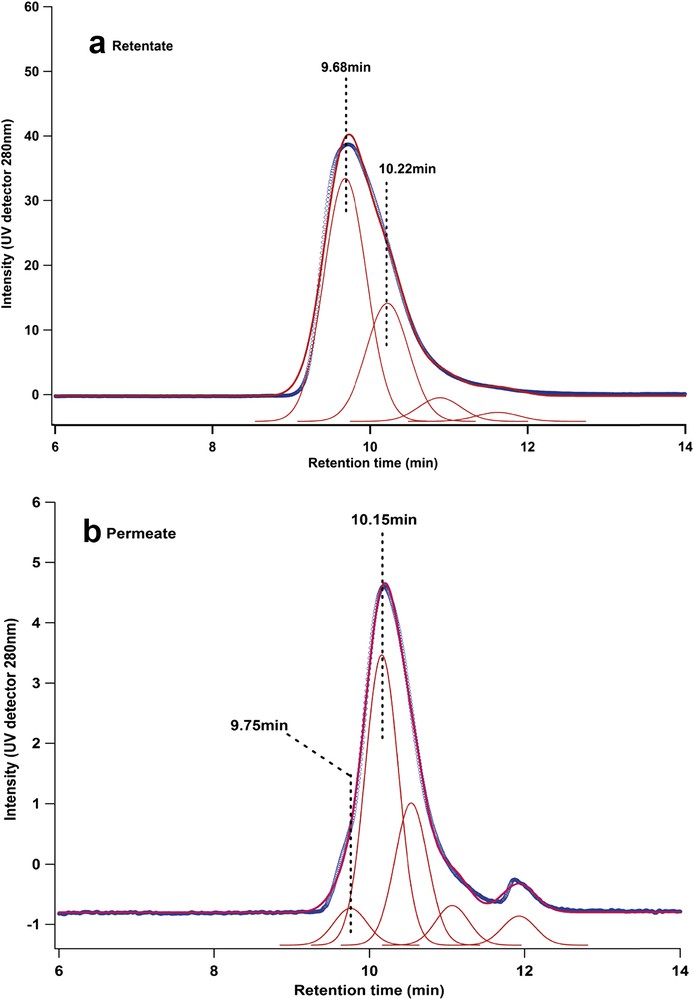
Peak fitting of chromatograms for (a) retentate and (b) permeate showing population of native protein (retention time, 9.75 min) and denatured form (retention time, 10.15 min)—(membrane M2—test lysozyme 2 (II)—ΔP = 8 bar).
According to the peak fitting of the chromatograms, several populations of lysozyme proteins can be found in the permeate: native proteins are eluted at 9.75 min and denatured population at 10.15 nm. After filtration, the majority of protein molecules are in denatured state, but it is interesting to see that a small part is still in native state. According to the pore size of the membrane, lysozyme can permeate only in denatured state. However, after filtration, the isolated protein molecule can be considered as ultradiluted, which is a condition commonly used to favor refolding of the protein [35]. Another small peak can also be detected at an elution time of 12 min. The area of this peak increases with increasing pressure during filtration and corresponds to the total elution of the column. As pressure increased, more small molecules (impurities probably) were filtrated through the permeate. These impurities can also be detected on the chromatogram of retentate solution (see Fig. 3). Nevertheless, the amount of impurities in the permeate is limited as compared with the concentration of lysozyme. The main difference between the retentate and permeate chromatogram's profile is the shift in the position from 9.81 to 10.22 min. The difference between the two elution times (native and filtrated lysozymes) suggests that the lysozyme molecule suffers a modification of its conformation in solution after contact with membrane pores. This might suggest that, indeed, mechanical stress related to filtration plays an important role on the molecule's conformation. An increase in the retention time suggests that the lysozyme molecule became seemingly smaller, or at least in a more compact structure. This result shows that the molecule is denatured after passing through the porous medium and could probably lose its inherent biological properties. The shape of the monomeric peak in the permeate chromatograms (Figs. 4 and 5) is also more symmetrical than the retentate peak, which suggests a more homogeneous conformation population for the lysozyme population in the retentate solution.
The results obtained for the other filtration tests are basically the same as the presented one. For all of the studied filtration tests of lysozyme–water solution with membranes M2 and M3, the retentate samples revealed peaks equal in terms of elution time and magnitude to the native lysozyme indicating that the lysozyme is not affected by the filtration process in the retentate. Probably some impurities are filtrated as revealed by the increase in the impurities' peak in Fig. 4 (retention time 12 min, increasing with pressure).
4 Conclusions
Filtration tests of solutions containing proteins were performed with a ceramic UF membrane. As tests were carried out, the hydraulic membrane performances decreased, which is the consequence of protein or amino acid adsorption. Intermediary filtration tests of VB12–water solutions show that the selectivity of the membrane increases, suggesting that the adsorption mainly operates in larger pores. To recover initial filtration properties, the membrane is hydrothermally treated, meaning that adsorption phenomena are partially irreversible with classical cleaning operations. Rejection rates of lysozyme increase as successive tests are performed and reach approximately 100%. HPLC analysis of the samples show a difference in the shape of the chromatogram peaks in retentate and permeate for lysozyme solution. The main peak is shifted to higher retention time by 0.4 min indicating that the hydrodynamic radius of the protein in solution is lower. This suggests that the protein is probably denatured after filtration. In both retentate and permeate solution, no higher mass aggregates have been detected suggesting that the process of filtration with shear stress, flow, and transmembrane pressure is not inducing the dramatic aggregation effect on the lysozyme solution at this given concentration.
Acknowledgments
This research did not receive any specific grant from funding agencies in the public, commercial, or not-for-profit sectors.