

Concentration of tryptophan (mol.m−3)
CsaltNaCl concentration (mol.m−3)
DDiffusion coefficient (m2/s)
NpNumber of particles
Posmotic pressure (Pa)
rradius (m)
ttime (s)
uwater velocity
μPartial molar volume of tryptophan in water (m3.mol−1)
Vwvolume of water (m3)
Wmoisture content (kg.kg−1)
W∗reduced moisture content
SuperscriptCLclay layer
SubscriptCLclay layer
eqequilibrium
Ttryptophan
Wwater
1 Introduction
The encapsulation of active molecules (vitamins, antioxidants, nutriments, etc.) offers many advantages, the main one being the protection from drastic conditions (light, oxygen, moisture, etc.) through the physical barrier formed by the encapsulating compounds [1–4]. Encapsulation also enables the selective control of the release depending on the applied stimulus (pH variation, temperature, etc.). Thus, the delivery will be performed with optimal kinetics at a required rate. Because of the versatility and numerous applications of these systems in the fields of pharmaceutics, food, cosmetics and agriculture, there has been intensive interest in recent years for both basic and applied studies [5–7]. In the field of plant nutrition, the stimulation of the physiological needs is a way to match the demand of intensive crop production and environment protection. In many cases, it is based on the release of active compounds directly on the leaves or near the roots. Active compounds are selected regarding their effect on nutrient absorption, root development or to promote microbial activity into soils. The encapsulation methods can be roughly divided into three methods: chemical, physicochemical and physicomechanical methods [8,9]. Among these methods, there are different ways to encapsulate active components to form the physical barrier (also called capsules or matrix): interfacial polymerization [10], sol–gel encapsulation [11], solvent evaporation [12] and spray drying [13]. Polymers are widely used to form capsules [14,15]. Inorganic compounds such as clays [16], graphene [17] and, more recently, metal-organic frameworks (MOF) [18] are also considered for many applications. In the case of layered compounds (e.g., clays), the tunable interlayer space enables the possibility to host a wide range of active molecules. The purpose of the study was, first, to adsorb an active molecule (i.e., tryptophan, which is an amino acid) on a substrate and to encapsulate the tryptophan saturated substrate in a clay-type layered structure. Second, it was to determine the relationship between the release kinetics and the medium (demineralized water or saline water) and to quantify the release of tryptophan. Finally, it was to establish and validate a two steps-based model (hydration and diffusion), which allows the understanding of molecule transport in the material.
2 Materials and methods
2.1 Materials
Two materials were studied. The first one organic material (OM) is a carbon material activated through a water vapour treatment (Bion AC four EE, from Bioconservacion company, Spain). After grounding, the fraction with a size less than 250 μm was used. The sample was dried for 1 week at 40 °C.
The second sample, labelled CM (clay-based material), is prepared by encapsulating the OM sample saturated with tryptophan in a clay-like structure. Experimental details cannot be given as the method of preparation is under patenting. As in the case of OM sample, the CM sample was dried for 1 week at 40 °C.
2.2 Tryptophan adsorption
The adsorption capacity of tryptophan on sample OM was determined at 25 °C. A proper amount of tryptophan (l-tryptophan, >98.5%, Merck) was dissolved in 1 L of demineralized water to have a series of solution with concentrations ranging from 200 to 1000 mg L−1. One gram of CM sample was then added and the obtained solution was stirred at 25 °C for 24 h. A part of the solution was collected by filtration using syringe filters (0.2 μm porosity) to determine the tryptophan concentration by UV spectroscopy. At the end of the experiment, the solution was filtrated on a Bόcher and the solid part was dried in the oven at 40 °C overnight. This experiment enables the determination of the tryptophan adsorption isotherm on OM sample and thus to know the amount of tryptophan needed to saturate the surface of the sample.
2.3 Tryptophan release tests
To study the release of tryptophan from OM and CM samples, 50 mg of material (OM or CM) was added to 100 mL of demineralized water in a glass vial. A strong agitation avoids the adsorption phenomenon on the walls. Five milliliters were collected, filtrated and analyzed by UV spectroscopy to determine the amount of released tryptophan. The solution was then added to the pristine solution. This experiment was repeated until the concentration of tryptophan remained constant.
To study the influence of the ionic strength on the kinetics of release, the same experiments were carried out by replacing the demineralized water with an aqueous solution of sodium chloride (99 wt %, Fluka) with concentrations equalling 5 × 10⁻³ and 10−1 M.
2.4 Characterization
Scanning electron microscopy investigations were carried out using a Philips XL30 FEG scanning electron microscope (SEM). X-ray diffraction (XRD) patterns were recorded by using a PAN analytical X'Pert Pro diffractometer operating with Cu Kα radiation (λ = 0.15418 nm). A micromeritics ASAP 2420 apparatus was used to perform nitrogen adsorption manometry experiments. The samples were heated at 90 °C under vacuum (∼10−6 bar) for 1 h and then at 100 °C for 15 h before measurements. Thermogravimetric analyses (TGAs) were collected using a Mettler Toledo TGA/DSC one STARe System device. Before analysis, the samples were dried for 48 h at 40 °C. Samples weighing between 10 and 20 mg were further heated from 30 to 800 °C under air or nitrogen at a heating rate of 5 °C min−1. Tryptophan concentrations were obtained by visible UV spectroscopy using a Λ 35 (Perkin Elmer Instruments) spectrometer at a wavelength of 280 nm, the highest concentration of the solution is 40 mg L−1.
2.5 Experimental tests of hydration
Hydration experiments were carried out on four samples of OM materials and on four CM materials (clay + OM) to have a representative observation of the hydration step. The mass of the different samples is given in Table 1. The setup used for this experiment is very simple. To begin, the different samples are dried at 105 °C for 48 h, when a constant mass is obtained. The remaining water content is estimated by thermogravimetric experiments. As it is lower than 0.5 wt %, it is neglected in the mass hydration balance. Then, the different samples are placed in a desiccator (in aluminium cup) saturated with humidity. The desiccator is closed hermetically and maintained at 20 °C in an environmental chamber. The uptake mass of the samples is controlled periodically to follow the kinetics of hydration.
Mass of OM and CM materials used for the hydration experiments.
| Material | Mass of the dry samples (mg) | |||
| OM material | 155.1 | 175.9 | 186.1 | 255.2 |
| CM material (clay + OM) | 192.8 | 247.6 | 251.6 | 306.5 |
2.6 Numerical modelling
2.6.1 Organic material
After preparation and storage, the previously dried material was plunged in the solution (pure water or sodium chloride–water solution). Basically, the water diffuses into the material porosity providing the tryptophan diffusion and release in the solution. For modelling the tryptophan release, two steps were considered: the first one consisting in the material hydration (independent step) and the second one in the tryptophan diffusion in water.
As the material is microporous and mesoporous, the water transfer in the material porosity is purely assumed diffusive [19]. For spherical particles, the differential mass balance is [20,21]
| (1) |
| (2) |
This differential equation is solved with two boundary conditions:
| (3) |
| (4) |
As for the water transport in the material, the tryptophan transfer is assumed to be diffusive and the sum of two contributions: diffusive and convective. For spherical particles, the differential mass balance is
| (5) |
| (6) |
The associated boundary conditions are the equations of symmetry at the centre of the particle (Eq. 7) and the equality between the release flux of tryptophan and the variation in tryptophan concentration in the external solution (Eq. 8) as follows:
| (7) |
| (8) |
2.6.2 Clay-based material
In the same way, the mass transfer in the CM is modelled by the same equations but taking into account both materials (clay layer and OM). For the hydration step, Eq. 1 is solved for the two materials with an additional boundary condition, a continuity equation at the interface between the OM and the clay layer as follows:
| (9) |
The same tryptophan transfer modelling is applied for both materials (Eqs. 5–7 for the OM from r = 0 to r = R and Eqs. 5, 6, and 9 for CM) along with a continuity equation (Eq. 10)
| (10) |
2.6.3 Modelling and method for solving
Two programs were carried out. The first one simulates the hydration and the tryptophan release in the OM (Eqs. 1–8). The differential equations are discretized with the finite difference method and integrated by using the Euler method (explicit schema). The set of Eqs. 1–4 is previously solved to estimate the convective term, which is introduced in the second part of the simulation program (Eqs. 5–8). The program is written in Fortran 90.
The second program (Eqs. 1–3 and 9 for the hydration part and Eqs. 5–7 and 10 for tryptophan release) is solved in the same way.
3 Results and discussion
3.1 Materials
The textural properties of the activated carbon (sample OM) were characterized by nitrogen adsorption manometry. The obtained isotherm is type I with a slight hysteresis, indicating that the activated carbon is mainly microporous with some mesopores. The specific surface area determined by the BET method (Brunauer, Emmett, and Teller) equals 959 m2.g−1. A microporous surface of 932 m2.g−1 is determined by the t-plot method. Fig. 1 displays the XRD pattern of the sample. Two broad bands and narrow reflections are present. The two broad brands are attributed to a partial organization of the carbon after its pyrolysis, this latter is inducing the formation of a graphitic phase. The narrow reflections are related to the presence of quartz as impurity.
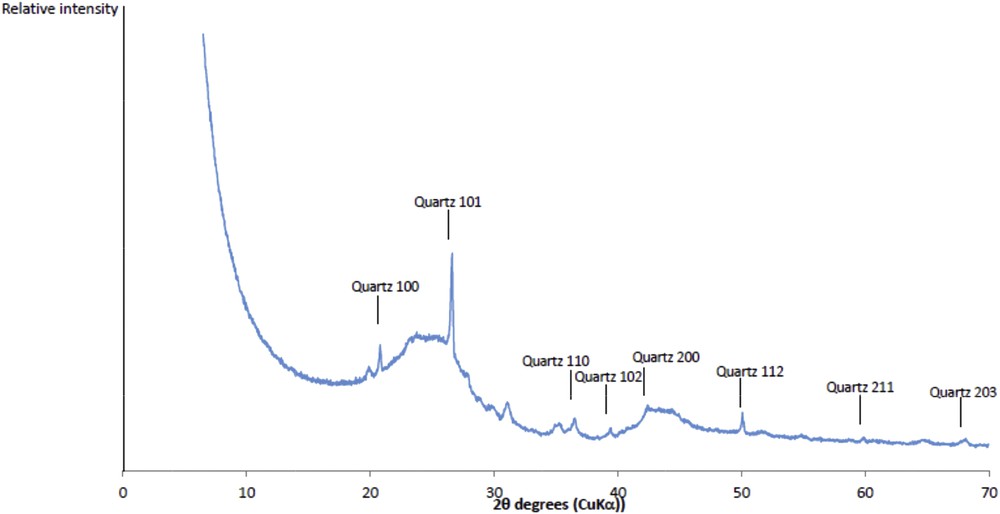
XRD pattern of activated carbon (sample OM).
The adsorption kinetics of tryptophan on sample OM is represented in Fig. 2. It can be seen that the carbon saturation with tryptophan is reached for a tryptophan concentration of 800 mg L−1. It is also shown that the adsorption of tryptophan on the activated carbon is fast as 80% of the saturation is achieved after just 15 min of contact. Under these conditions, the adsorption phenomenon mainly takes place on the surface.
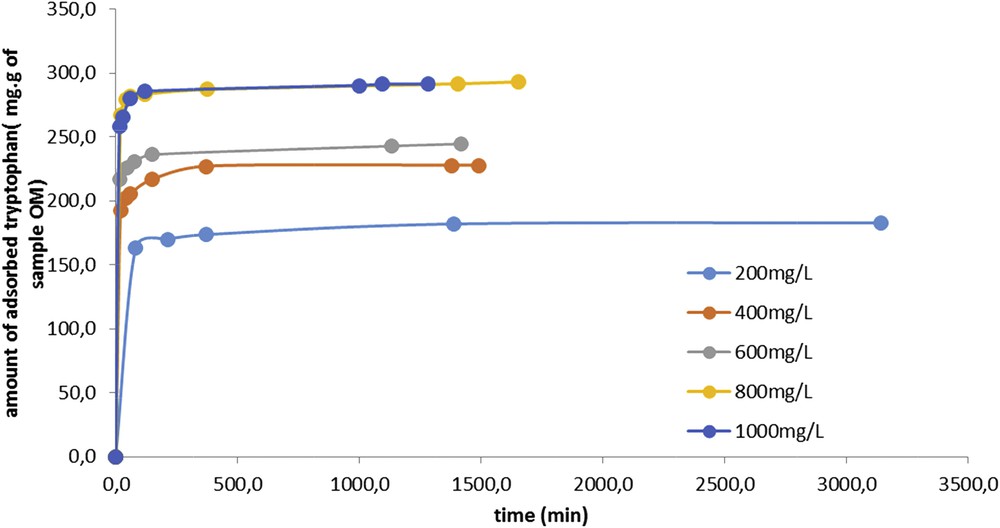
Amount of adsorbed tryptophan per gram of OM sample versus time.
Taking into account these results, the adsorption isotherm of tryptophan on OM sample can be determined. The isotherm (Fig. 3) is a type VI isotherm corresponding to an ultramicroporous solid having energetically different adsorption sites. In such case, the adsorption first takes place on the most stable energy sites. It can also be noted that the two levels are not identical in terms of adsorbed quantities.
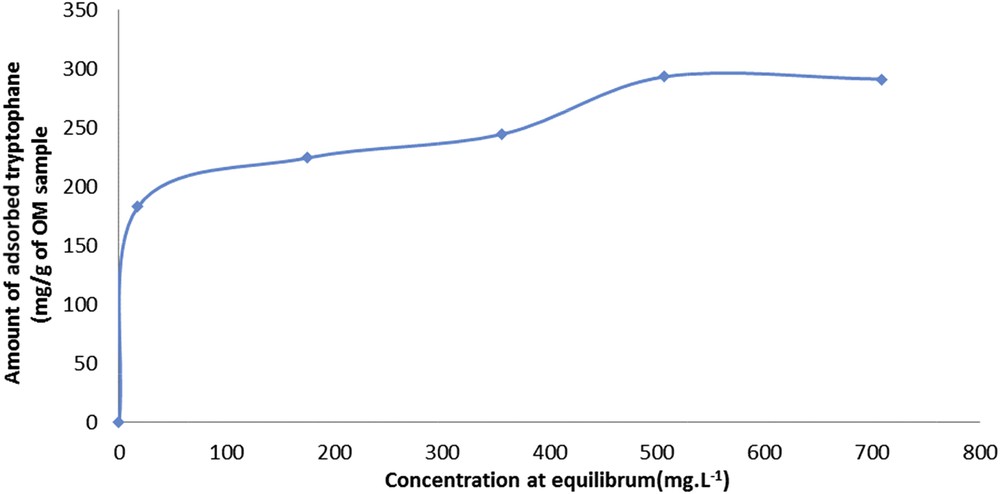
Adsorption isotherm of tryptophan on sample OM.
The saturation of OM sample with tryptophan leads to a decrease in the specific surface area (from 959 m2.g−1 for OM sample to 263 m2.g−1OM saturated sample). The same trend is observed for the microporous surfaces (decreasing from 932 m2.g−1 to 210 m2.g−1), reinforcing the conclusion that tryptophan absorbs in the microporosity of the activated carbon.
TGAs were performed on CM sample to estimate the average thickness of the clay layer encapsulating OM sample saturated with tryptophan (assuming spherical particles with a diameter of 100 μm for OM saturated with tryptophan). According to this hypothesis, the average thickness is 2.2 μm. SEM micrograph (Fig. 4) confirmed that the clay layer is around 2–3 μm thick.
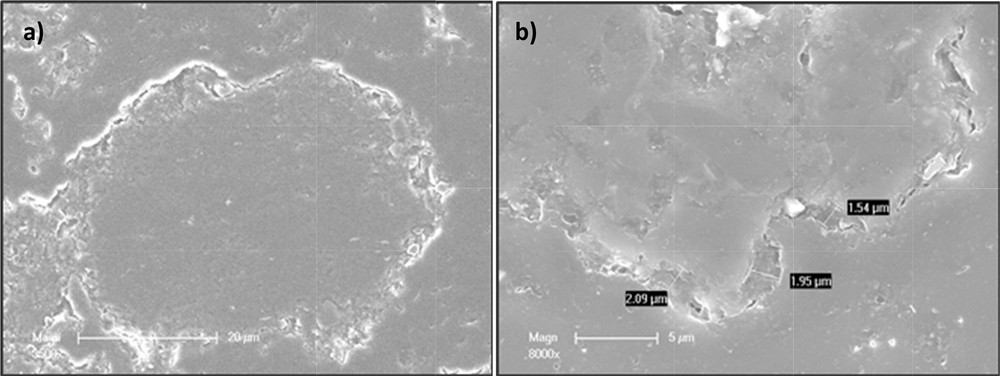
SEM micrograph of an OM sample (a) and zoom of the clay layer (b).
Fig. 4(a) shows an OM particle encapsulated by a thin layer of clay (light colour). A zoom of this layer is shown in Fig. 4(b).
3.2 Experimental results—tryptophan release
Experimental tests of tryptophan release were conducted and studied in two external media (water and sodium chloride–water solution).
Fig. 5 shows the kinetics of tryptophan release according to time for the OM. The results are close in terms of kinetics indicating that tryptophan release is not influenced by the external medium in the OM.
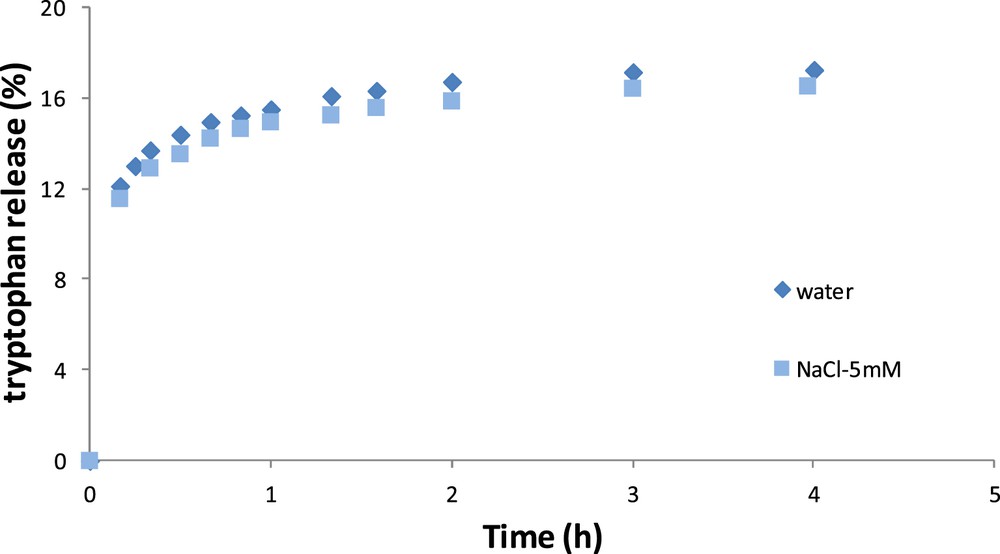
Release kinetics of tryptophan in pure water and in NaCl–water solution for the OM.
Fig. 6 shows the amount of tryptophan released according to time for the CM. The first observation refers to the effect of the clay layer, which considerably reduces the release kinetics (around 0.4% of tryptophan released per hour for the OM and 0.07% per hour for the CM). Contrary to the OM, the kinetics are different for both studied external media. The release is faster in pure water than in salt–water solution. After 3 days, the amount of tryptophan released in solution is three times higher in water than in NaCl–water solution.
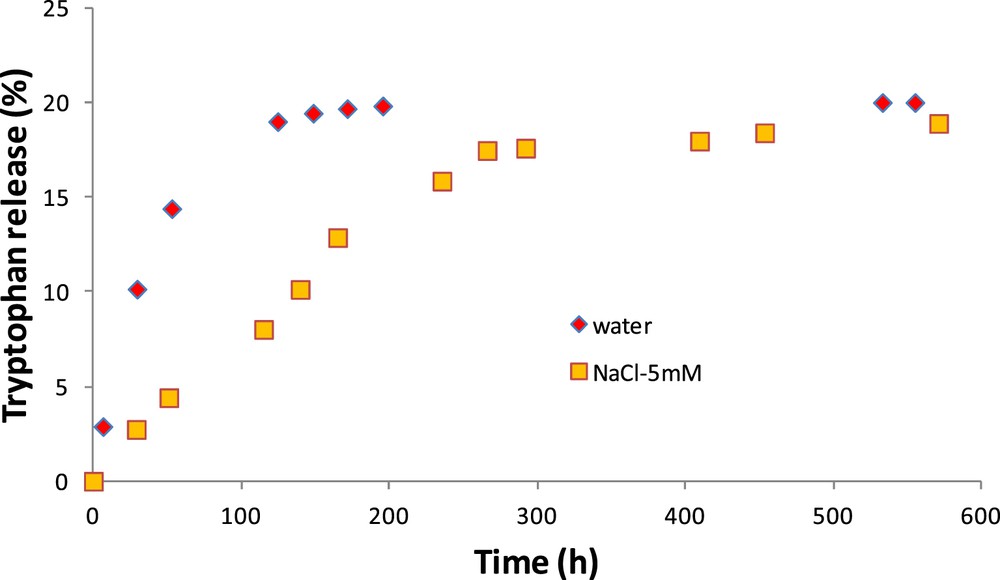
Release kinetics of tryptophan in pure water and in NaCl–water solution for the CM.
Assuming that the characteristic time of diffusion is the ratio between the squared characteristic length and the diffusion coefficient, its value is lower than 10 min for the OM and around 42 h for the CM in pure water (>130 h for diffusion in the saline solution).
3.3 Organic material: numerical results
As previously observed, the release kinetics is different according to the material and the external medium. It is obvious that the clay layer significantly modifies the mass transfer. Two ways can be studied: the effect of water, especially the hydration phenomenon and, only for the clay layer, the presence of ionic solutes.
As mentioned, after preparation and storage, the previously dried material was plunged in solution (pure water or sodium chloride–water solution). Principally, the water diffuses into the material porosity providing the tryptophan diffusion and release in the solution. As the OM is microporous and mesoporous, the water transfer in the material porosity is purely assumed diffusive [22]. For spherical particles, the differential mass balance is described by Eqs. 1–4.
For the OM, Eq. 1 can be analytically solved [23] by assuming the diffusion coefficient independent of the position and by substituting W∗ by X = rW∗. After separation of variables (i.e., X(t,r) = T(t) × R(r)), we obtain
| (11) |
Fig. 7 shows the experimental and calculated hydration kinetics in terms of moisture content for the OM particles. The characteristic time of water diffusion in the material is on the order of 10 h. The best approximation of experimental moisture content is obtained for a diffusion coefficient of water in the OM of 1.1 × 10⁻¹⁴ m2/s. This result provides the validation for the calculation performed for the OM and the CM. Indeed, results obtained with the analytical solution and the program are quasi the same (assuming, in the program for the CM, the OM was encapsulated by itself).
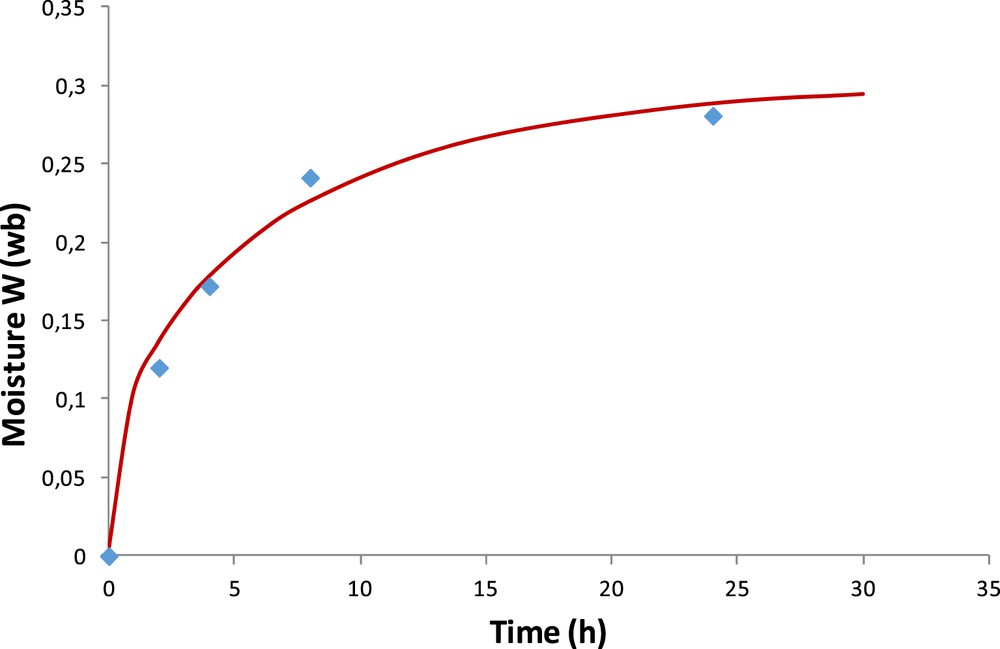
Experimental and calculated (Eq. 11 averaged for a particle) moisture content of the OM.
Fig. 8 shows the experimental and numerical amount of tryptophan released into water. The best numerical approximation is obtained for a diffusion coefficient of tryptophan in the OM of 3.0 × 10⁻¹¹ m2/s.
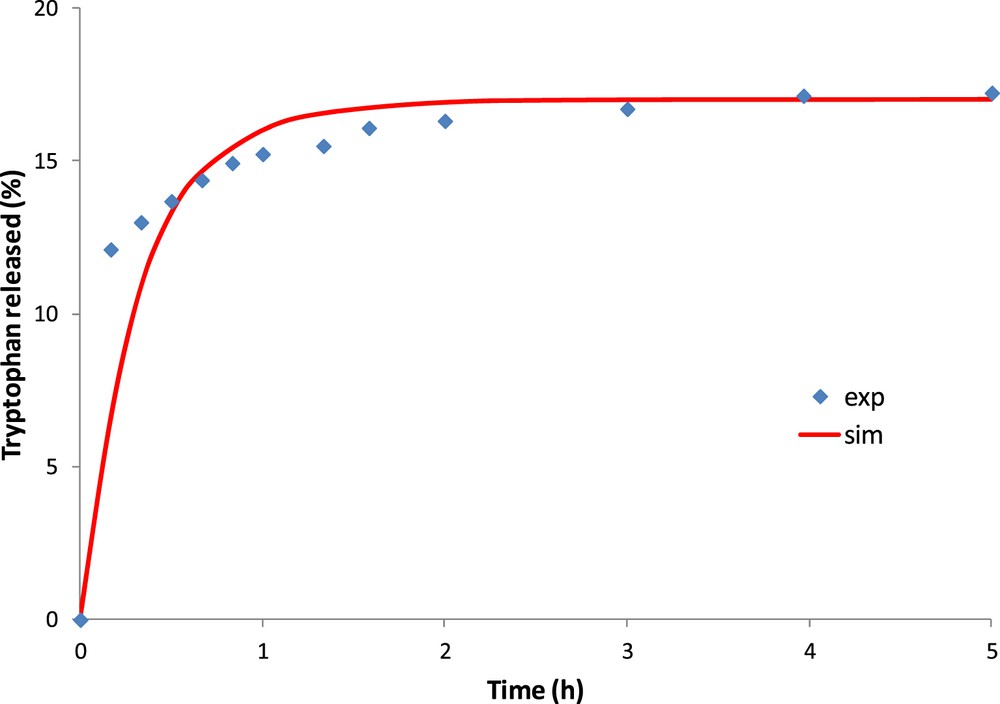
Experimental and simulated results of tryptophan released on saturated activated carbon (OM).
3.4 Clay-based material: numerical results
Just like for the OM case, hydration tests were also performed with the CM. If for the OM, the water content has reached its final value (29%) after 1 day, the hydration kinetics of the CM is much slower. After 1 day, the water content is only 6%, 7% after 3 days and reaches 15% after 45 days.
To simulate the water content evolution in the CM, the water diffusion coefficient in the organic part of the material is assumed to be the same (previously estimated 1.1 × 10⁻¹⁴ m2/s).
The simulation results do not fit well the experimental ones. Indeed, it is possible to have a better approximation of the experimental results either at short time or at long time, but not both in the same time. The experimental water content increases rapidly during the first 10 h up to 5%, then increases slightly slower the first 2 days (up to 7–8%) and continues to increase very slowly (quasi-linear increasing, 0.15% per day). It seems that for CM, there are two different hydration phenomena, unlike the hydration of the OM, which was finished after 1 day. The beginning of the hydration can be numerically approximated with a diffusion coefficient of water in the clay layer Dw (clay) ≤ 1.1 × 10⁻¹⁴ m2/s. After 3 days, the diffusion of water can be well-fitted with a coefficient 50 times lower. The hydration kinetics of the CM is so slow that this does not, in any way, affect the diffusion of tryptophan.
Fig. 9 shows the experimental and simulated amount of tryptophan released in water by the CM. To better approximate the experimental results, the tryptophan coefficient of diffusion in the clay layer is considered to be 5 × 10⁻¹⁵ m2/s. This result validates the previous assumption (i.e., hydration kinetics after 3 days neglected) owing to the diffusion kinetics is about 23 times higher. The thin layer of clay (2–3 μm) reduces the diffusion rate of tryptophan by a factor of 100. The equilibrium is reached after 150 min (2.5 h) for the OM in contrast to 250 h for the CM.
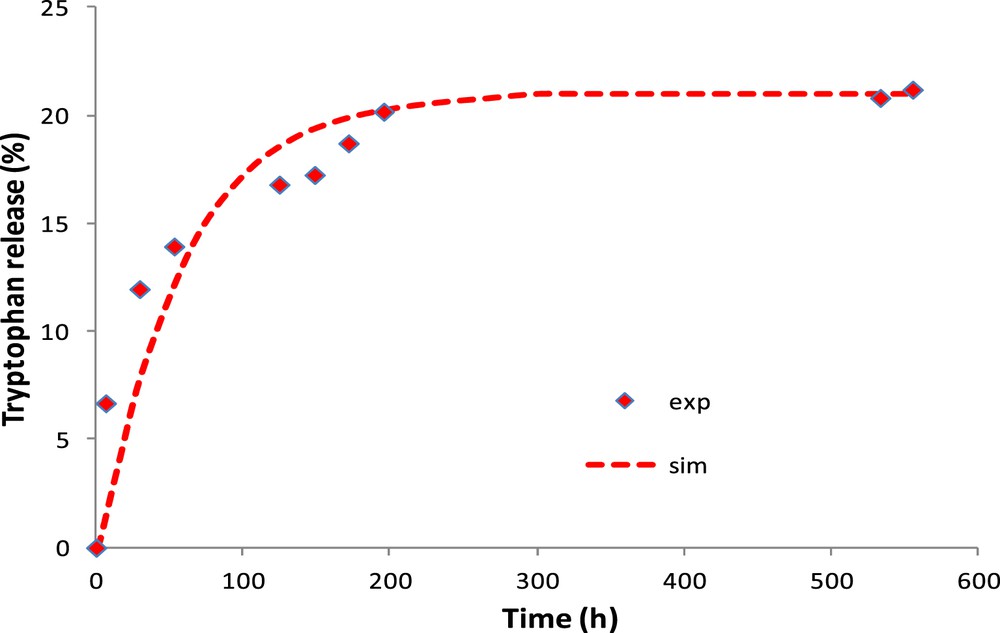
CM: experimental and simulated tryptophan released in water.
The thin layer of clay reduces considerably the mass transfer but not in the same way. It depends on the external medium. As it can be observed from Fig. 3, the diffusion kinetics of tryptophan is different in water and in saline solution. The direct simulation with the modelling as it is proposed leads to an estimated diffusion coefficient of tryptophan in the clay layer smaller in saline solution than in pure water. Theoretically, there is no particular reason to explain this behaviour, except if the salt does not modify the coefficient of diffusion but rather adds a repulsive force. In the literature, many works [24,25] deal with the transport of saline solution through a microporous/mesoporous material with an external force (gradient of pressures, concentrations, etc.). For example, in nanofiltration, many works [26–28] show that ions are mostly rejected especially for low cutoff membranes. The authors explain this behaviour by the sum of three contributions [29,30]: the steric effects (ratio between the size of the ionic specie and the pore size), the electric effects (interaction between the electric charge in the pore and ions) and the dielectric effects (modification of the solution dielectric constant in the pore, hydrophilic/hydrophobic character, modification of the electric field lines in the pore, etc.).
Table 2 gives the mass fraction of sodium contained in both materials after immersion for 72 h in the external medium (water or NaCl–water solution 5 mM). For both studied materials, the mass fractions of carbon and silica are identical according to the external media, carrying out a good match of materials compositions. For the OM, a significant increase in the sodium mass fraction is observed after immersion in saline solution, whereas the sodium content has not actually changed for the CM. These results confirm that water enters in the particle but not the salt. Starting from this assumption, the second model for tryptophan release from the CM is modified to take into account the salt influence. For this, Eq. 8 is substituted by the following expression:
| (12) |
Ultimate analysis of the studied materials.
| Material | Na (wt %) | Si (wt %) | C (wt %) |
| OM + water | 0.12 | 1.23 | 90.60 |
| OM + NaCl–water | 0.21 | 1.20 | 89.91 |
| CM + water | 0.19 | 4.19 | 79.0 |
| CM + NaCl–water | 0.17 | 4.06 | 79.7 |
This expression is the result of the description of the tryptophan flux. Indeed, according to the Onsager relations (nonequilibrium thermodynamics), it is a linear function of the gradient of chemical potential of tryptophan. This gradient consists of two parts, a gradient of activity (concentration for diluted solution) and a gradient of pressure. In Eq. 12, is the partial molar volume of tryptophan in pure water estimated at 143.8 cm3 mol−1 [31] and P is the pressure due to ionic strength.
Assuming that the gradient of pressure is only due to the difference in salt concentrations on both sides of the clay layer, it can be described by difference in osmotic pressure as follows:
| (13) |
Starting with these hypotheses, simulations are carried out without adjustable parameter and the results are shown in Fig. 10. Taking into account the osmotic pressure due to salt rejection, the simulated rate of tryptophan release is in much better agreement with the experimental results. It seems that the simulation fits well the beginning and the end of the curve but overestimates the release kinetics at intermediate times.
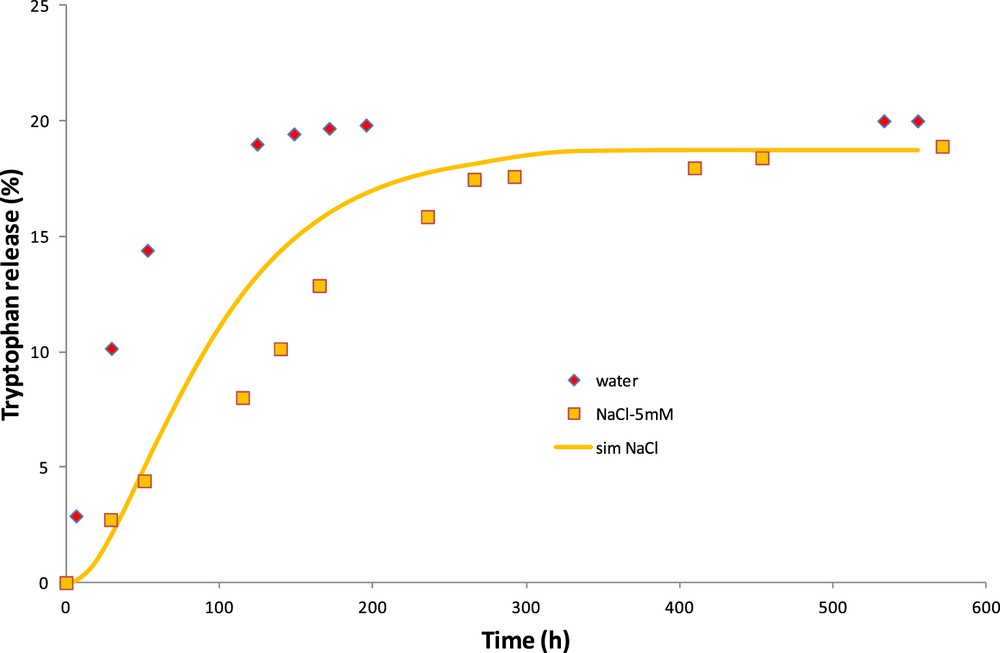
CM: experimental and simulated tryptophan released in salt–water solution.
4 Conclusions
This work is devoted to experimentally and numerically study the controlled release of an active molecule (tryptophan) in a specific medium. In the first step, the amino acid is adsorbed in a porous OM and encapsulated in a clay-type layered structure. In a second step, experimental released tests are performed in two media (pure water and saline solution) to study the release kinetics. A numerical model is used to investigate the relationship between the release kinetics and the medium by studying the effects of different phenomena (hydration, diffusion, etc.), which act on the molecule's release. The numerical results show that the hydration step of the CM slows down the tryptophan release kinetics. In the same way, the results provide understanding of the effect of salt in the external medium. Indeed, in the presence of sodium chloride, the release kinetics is substantially reduced. Taking into account the pressure gradient (osmotic pressure) due to the difference in salt concentration on both sides of the clay layer enables to better approximate the experimental results.