

1 Introduction
Nowadays, industries around the world release large amounts of dyes into the water environment. Wastewater treatment has gained much attention in need of providing a new source of clean water for agricultural and industrial applications. One of the promising methods in the treatment of dye-contaminated wastewaters is heterogeneous photocatalysis because of the availability of cheap light sources, inexpensive photocatalysts, and complete degradation of organic substances to CO2 and H2O [1]. TiO2 as a non-toxic, low-cost photocatalyst with suitable band edge positions is stable under different environmental conditions and is used as a common photocatalyst [2,3]. But TiO2 has a wide bandgap and fast electron–hole recombination which limits its application in the whole light region [4–6]. Among different methods for promoting the photocatalytic efficiency of TiO2, combination with another photocatalyst like ZnO, which has special charge characteristics, seems to be a useful method. Higher electron mobility in ZnO will reduce the electron/hole recombination rate by injecting photoexcited electrons into the conduction band [7]. Another issue in heterogeneous photocatalysis is configuration of the photocatalyst. For example, using a photocatalyst powder leads to more surface area with enhanced light absorption and pollutant adsorption. However, in this case, there are challenges like lower mass and radiation transfer and also the problem of separation unit after the reaction. Immobilization of photocatalyst powders on substrates is proposed as a promising technique in different studies [8–11]. Photocatalyst immobilization can be performed using different methods, including physical and chemical vapor deposition [12,13] and wet solution processing approaches such as sol–gel processes followed by dip coating [14], spin coating [15], and spray coating [16]. The physicochemical properties of coatings on the substrate vary depending on the preparation procedure and deposition conditions [17]. Burnat et al. [18] investigated the effect of annealing temperature as a key parameter on Ca-doped TiO2 bioactive coatings. They showed that anatase as a useful TiO2 phase was obtained at a temperature of 450 °C and at this temperature, anticorrosion and bioactivity of the coatings are maximum [18]. Hernández-Barrios et al. [19] studied the effect of parameters such as acid concentration, immersion time, and aging time on the morphology, composition, and corrosion performance of tetraethoxysilane–(3-glycidyloxypropyl)trimethoxysilane (TEOS–GPTMS) sol–gel coatings deposited on the AZ31 magnesium alloy. The experimental results showed that by suitable control of these parameters, it was possible to mitigate surface corrosion processes on the AZ31 magnesium alloy during the sol deposition, which allows obtaining continuous and homogeneous coatings without cracking [19]. In another study, Fang et al. [20] investigated the effects of dip-coating operating parameters such as the withdrawal velocity, concentration, and viscosity of the solution on the thickness of the polylactic acid coating on steel surfaces. The competition of drag force and gravity during the dip-coating process determines the film thickness [20].
In our previous studies, we investigated the effect of coating parameters like catalyst loading and solid concentration on physicochemical properties of CZA–HZSM5 catalysts coated on a stainless steel palte for direct DME synthesis in a microreactor [21,22]. In several studies, sol–gel dip coating has been applied for coating of photocatalysts on different substrates; however, the effect of coating parameters is explored limitedly. It is important to mention that by decreasing the sol concentration, wash coating of the substrate with photocatalyst powder can be performed easier; however, the risk of negative undesired changes in physicochemical properties of the resultant coating should be considered. It is generally believed that in immobilized photocatalysts, the coating thickness, amount of cracks, size of particles, surface roughness, and particle agglomerations all are influenced by coating parameters and then later they can lead to effect the photocatalytic activity of the as-prepared photocatalyst coating.
In this work, the impact of sol concentration as one of the key factors of coating was investigated through different techniques such as X-ray diffraction (XRD), transmission electron microscopy (TEM), field emission scanning electron microscopy (FESEM), EDX, UV-vis diffuse reflectance spectra (DRS), and weight loss sonication test. The synthesized coatings were evaluated in the photodegradation of methylene blue under UV irradiation, and the effect of wastewater pH, initial dye concentration, and number of coatings were studied. Mechanical and photochemical stabilities of the coatings were also evaluated.
2 Materials and methods
2.1 Materials
The reagents used in this work were zinc acetate dehydrate obtained from Sigma-Aldrich; titanium tetraisopropoxide, ethanol, diethanolamine, and isopropanol from Merck; and methylene blue dye from Fluka. All the reagents were used as received without any further purification.
2.2 Nanocatalyst preparation and coating
The TiO2–ZnO nanostructured films with 20% mol ZnO were coated on glass plates using a sol–gel dip-coating method. Fig. 1 reveals the schematic flow chart for synthesis and coating of TiO2–ZnO photocatalysts with different sol concentrations.
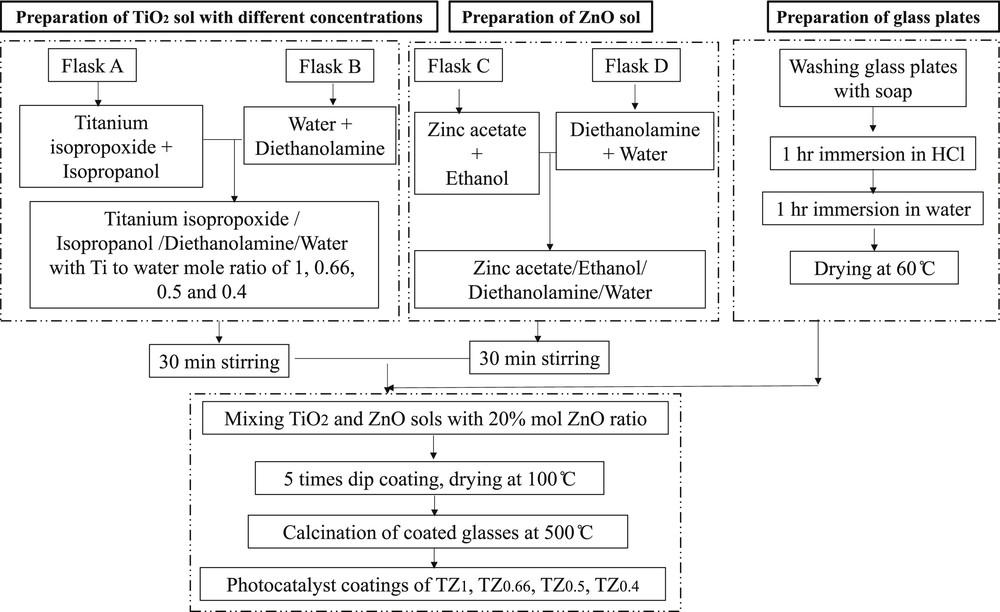
Schematic flow chart for synthesis of sol–gel dip coating of TiO2–ZnO photocatalysts with different sol concentrations.
The preparation of TiO2 sol is as follows: In flask A, titanium isopropoxide as a precursor of Ti was added dropwise into isopropanol under continuous stirring for 30 min in a mole ratio of 1:25. Then, in flask B, the mixture of diethanolamine as a stabilizer and distilled water in a mole ratio of 1:1 was added together drop by drop under continuous stirring. The contents of flask A and flask B were then mixed under stirring.
Regarding the preparation of ZnO sol, zinc acetate dehydrate, diethanolamine, and distilled water were dissolved in ethanol at 60 °C under continuous stirring in a mole ratio of 1:20:1:1, respectively. After 12 h of aging, the prepared ZnO sol was added into the TiO2 sol under continuous stirring to prepare 20% mole ZnO in TiO2–ZnO sol. To investigate the role of TiO2–ZnO sol concentration on the morphology and physicochemical properties of coatings, four different sols with Ti/water molar ratios of 1, 0.66, 0.5, and 0.4 were prepared and named as TZ1, TZ0.66, TZ0.5, and TZ0.4, respectively. A sol concentration less than that of the TZ0.4 was very dilute, and a sol concentration higher than that of the TZ1 did not form any gel and hence was not studied in this work. Microscopic glass plates (25 × 75 × 2 mm) were used as the substrate for TiO2–ZnO coatings. The surface of glass plates was washed by soap and rinsed in 1 M HCl and then distilled water. The glass plates were dried at 60 °C for 3 h. The prepared TiO2–ZnO sol was deposited on the substrate surface by the dip-coating method. For this purpose, the glass plates were dip coated vertically in the sol of TiO2–ZnO and pulled up at a constant rate. The dip-coated plates were dried in an oven at 100 °C for 2 h. Coating and drying cycles were repeated five times, and finally, the coatings were calcinated at 500 °C.
2.3 Nanocatalyst characterization techniques
In this research, phase identification of TiO2–ZnO coatings was carried out by XRD with the scanning rate of 0.02°/s using a Siemens D5000 diffractometer with Cu-Kα (λ = 1.54178 A°) radiation from 10° to 90°. The morphology of coatings was specified by a scanning electron microscope equipped with a field emission gun (HITACHIS-109 4160) and transmission electron microscope. Energy-dispersive X-ray (EDX) line mapping was carried out using a VEGA∖∖TESCAN, BSE detector for elemental analysis. The adherence of the coatings was quantified by sonication using an SONOPULS HD 3200, 20 kHz, with a power output of 100 W/cm2. The UV-vis DRS of selected samples were achieved using a Scinco 4100 device.
2.4 Photocatalytic reaction test
The photocatalytic activity of TiO2–ZnO coatings synthesized from sols with different concentrations was determined from the degradation rate of methylene blue as a model pollutant in a rectangular batch photoreactor at 25 °C. The glass plates coated with TiO2–ZnO were placed in a 100-ml methylene blue solution and positioned under two 4-W UV-A lamps (Philips, Poland) at a distance of 4 cm from the top. Ice cubes were used to prevent the evaporation of the dye solution and maintain the temperature at 25 °C during the photodegradation of methylene blue. The solution was first magnetically stirred in the dark for 45 min to ensure the adsorption/desorption equilibrium between the dye and the catalyst films, and then the UV lamps were turned on. During the reaction, the concentration of the dye was monitored by measuring the absorption of the solution using a UV-visible spectrophotometer (Unico spectrophotometer, UV-2100).
3 Results and discussions
3.1 Adsorption and photocatalytic activity of TiO2–ZnO coatings
TiO2–ZnO coatings prepared from different sol concentrations were placed in the dark for 45 min before turning on the lamps. The results show that the TiO2–ZnO coating from TZ1 parent sol had the highest adsorption amount (rate) of 8% of methylene blue, while other TiO2–ZnO coatings had lower adsorption rates (around 3%). The TiO2–ZnO coatings were then tested for photodegradation of methylene blue, as shown in Fig. 2. The TiO2–ZnO coating synthesized from TZ1 showed the highest photocatalytic activity compared with other coatings. In fact, the TZ1 coating degraded 82.03% of initial methylene blue after 390 min of light irradiation, whereas TZ0.66, TZ0.5, and TZ0.4 decomposed 36.24, 32.38, and 28.5% of methylene blue, respectively. It means the concentration of sol has a great influence on the photocatalytic activity of the resultant coating. It is generally believed that the photocatalytic activity is basically influenced by the crystalline phase, morphology, topology, particle size, elemental dispersion, and optical properties of the photocatalyst coating [33]. Therefore, the TiO2–ZnO coatings synthesized from different sol concentrations were characterized by XRD, FESEM, TEM, EDX, and UV-vis DRS, and the results are discussed here further.
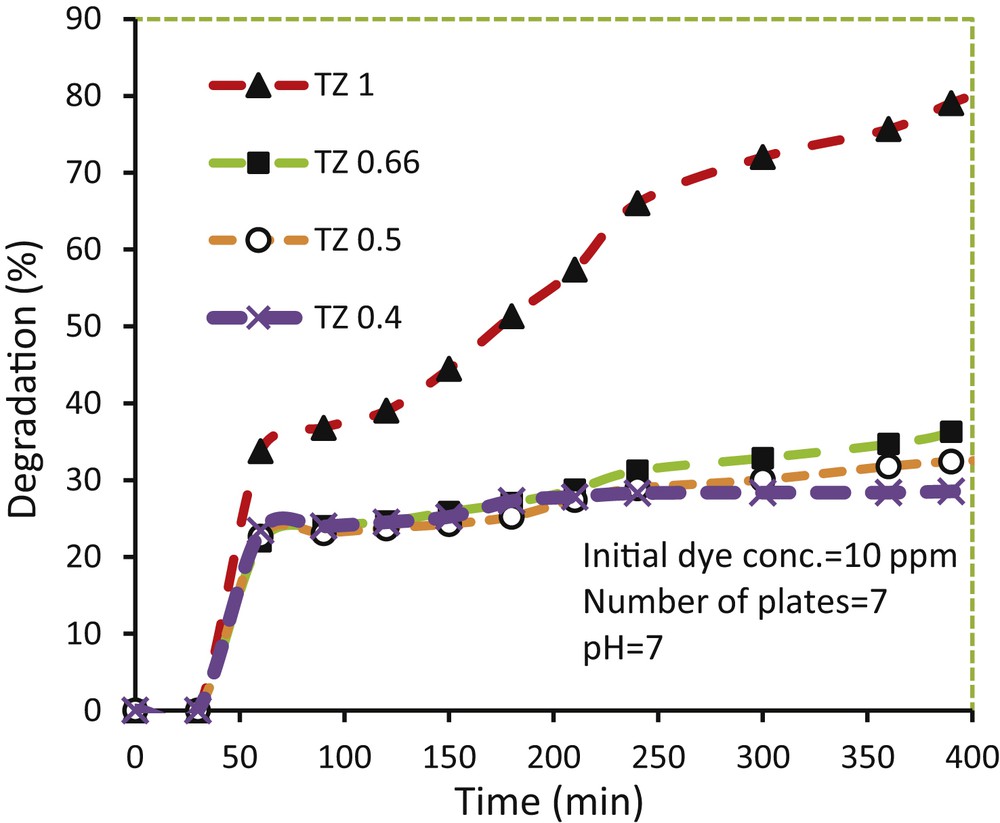
Photodegradation of methylene blue over glass plates coated with TiO2–ZnO synthesized from sols with different concentrations.
Pure TiO2 and pure ZnO coatings degraded 67.54% and 55.88% of methylene blue, respectively, under similar conditions. The ZnO–TiO2 composite shows a higher photocatalytic activity because of the synergistic effect of TiO2 and ZnO. ZnO has a higher light-harvesting capacity, whereas TiO2 has more chemical stability. Moreover, charge separation occurs in hetero junctions like ZnO–TiO2, which improves the photoactivity of the prepared photocatalyst.
3.2 XRD analysis of TiO2–ZnO coatings
The XRD patterns of TiO2–ZnO coatings synthesized from TZ1, TZ0.66, TZ0.5, and TZ0.4 parent sols are illustrated in Fig. 3. The sol concentration has a decisive role in the crystalline structure of the resultant TiO2–ZnO coatings because by changing the concentration of sol, type and crystallinity of the TiO2 phase change. The TiO2–ZnO coating synthesized from TZ1 showed a combination of rutile and anatase phases of TiO2. To calculate the mass fraction of rutile in TiO2 mixed phases, the equation as reported in the studies by Guo et al [23] and Navas et al. [24] can be used:
| fA = 1/ (1.26 IR/IA) |
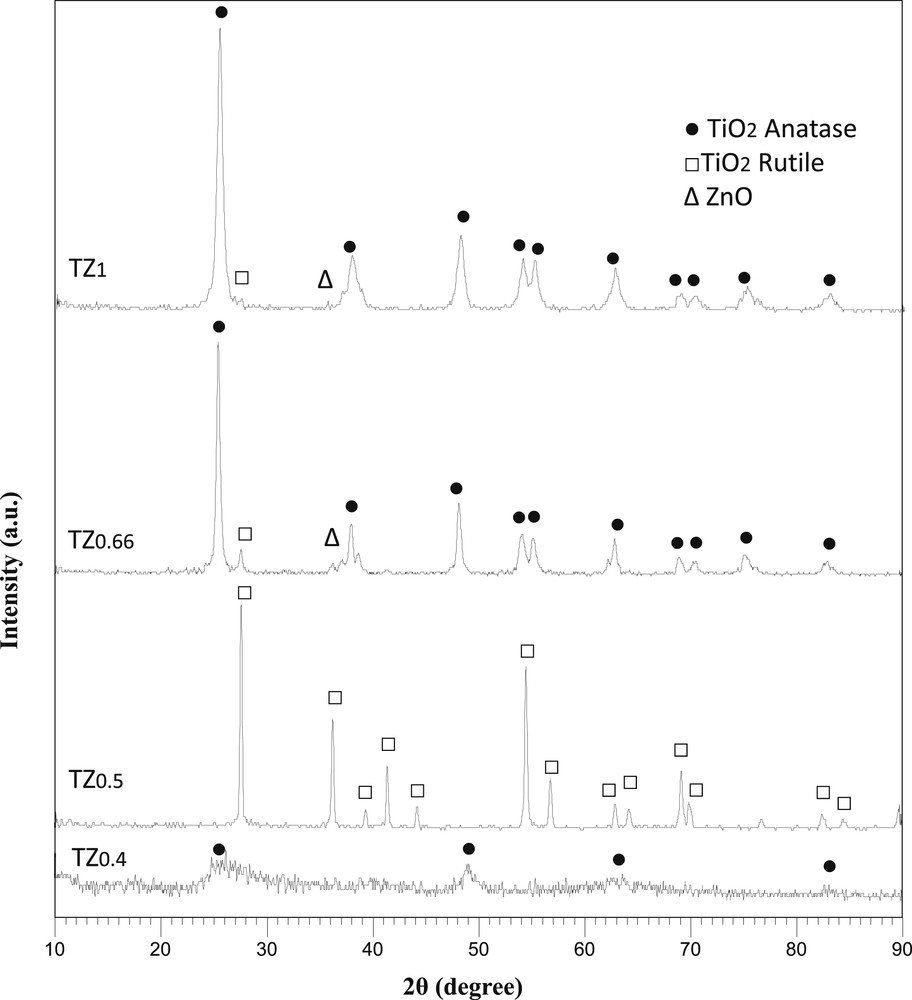
XRD patterns of TiO2–ZnO coatings synthesized from sols with different concentrations. XRD, X-ray diffraction.
In summary, XRD confirms that spinel coating structures between TiO2 and ZnO which are mostly photoinactive were not formed. This observation is consistent with the findings of Moradi et al. [25] who showed that the TiO2/ZnO nanocomposite with 20% mol ZnO had separate crystallization of TiO2 and ZnO. Janitabar-Darzi and Mahjoub [26] found that the TiO2–ZnO composites which formed separate TiO2 and ZnO phases had the strongest ability in photodegradation of Congo red. As shown in Fig. 2, the TiO2-ZnO synthesized from TZ1 showed the highest activity in photodegradation of methylene blue. This is because in this sample, the portion of anatase as active phase of TiO2 to rutile is high. Moreover, TiO2 and ZnO crystallites are small and highly dispersed in this sample which enhances the light absorption and charge carrier separations.
The XRD patterns of all samples were analyzed by the Rietveld method for identification of the amount of ZnO oxide phase. The TZ1 sample showed 4% of ZnO wurtzite phase (instead of 20%). It seems that the rest of ZnO can be amorphous or in the form of very fine crystallites. TZ0.66, TZ0.5, and TZ0.4 did not indicate the presence of ZnO. EDX analysis is necessary for confirmation of the presence of ZnO in these samples. The amount of water in the parent sol has a great impact on the formation of ZnO in crystalline phase.
3.3 FESEM analysis of TiO2–ZnO coatings
The morphology of TiO2–ZnO coatings synthesized from sols with different concentrations is illustrated in Figs. 4 and 5. As can be seen, the variation in parent sol concentration strongly changes the morphology of the TiO2–ZnO coatings. The TiO2–ZnO coating prepared from TZ1 indicated a uniform morphology of small nanoparticles with a smooth, slippery, and continuous surface. The amount of cracks and agglomerations was negligible in this sample. By decreasing the sol concentration, the growth of particles and agglomeration was observed that led to the formation of cracks on the surface. In case of TZ0.5 and TZ0.4 coatings, which had diluted sols, the surface is rough, the particles are big, and they agglomerate. Deep cracks in the surface of these coatings have made big islands of particles, which are barely in contact. Decreasing the sol concentration brings more water to the synthesis environment, which should be evaporated in a limited time, leading to deep cracks on the surface. In diluted sols, using an extra amount of alcohol could help in slow evaporation of solvents and preventing crack formation. Cracks and agglomeration of particles on the surface of the coatings lead to a reduction in photocatalytic activity. The agglomerated particles in a coating have lower surface area, lower absorption of the photons, lower formation of charge carriers and consequently reduced formation of electron–hole pairs [1,27]. With a reduction in the number of electron–holes, less radicals are generated, and as a result, photocatalytic activity decreases [28,29]. Fig. 5 represents the FESEM images of the cross section of studied coatings. In all coatings, the boundary between the surface of the substrate and TiO2–ZnO coatings is clear. With decreasing sol concentration, the thickness of coatings increased such that TZ1 had the minimum thickness of 1.23 μm and TZ0.66, TZ0.5, and TZ0.4 had thicknesses of 2.18, 4.74, and 16.13 μm, respectively. In lower sol concentrations, the viscosity of the sols is reduced, which facilitated the deposition of the sol and increased the thickness of the coatings. On the other hand, the increase in the coating thickness entailed the formation of cracks, causing the detachment. Moreover, in thick coatings, there is some difficulty in absorption of photons and dye molecules, especially for underlying layers, because of increasing pore resistance.
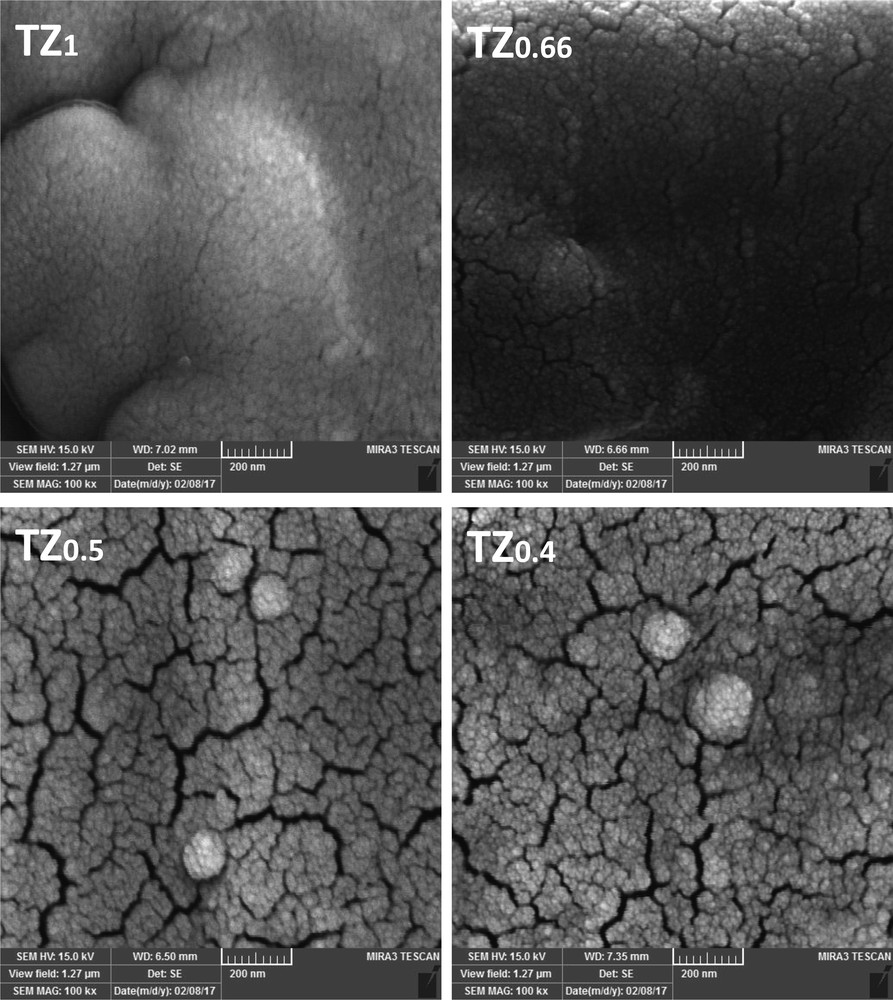
FESEM images of TiO2–ZnO coatings synthesized from sols with different concentrations, top view. FESEM, field emission scanning electron microscopy.
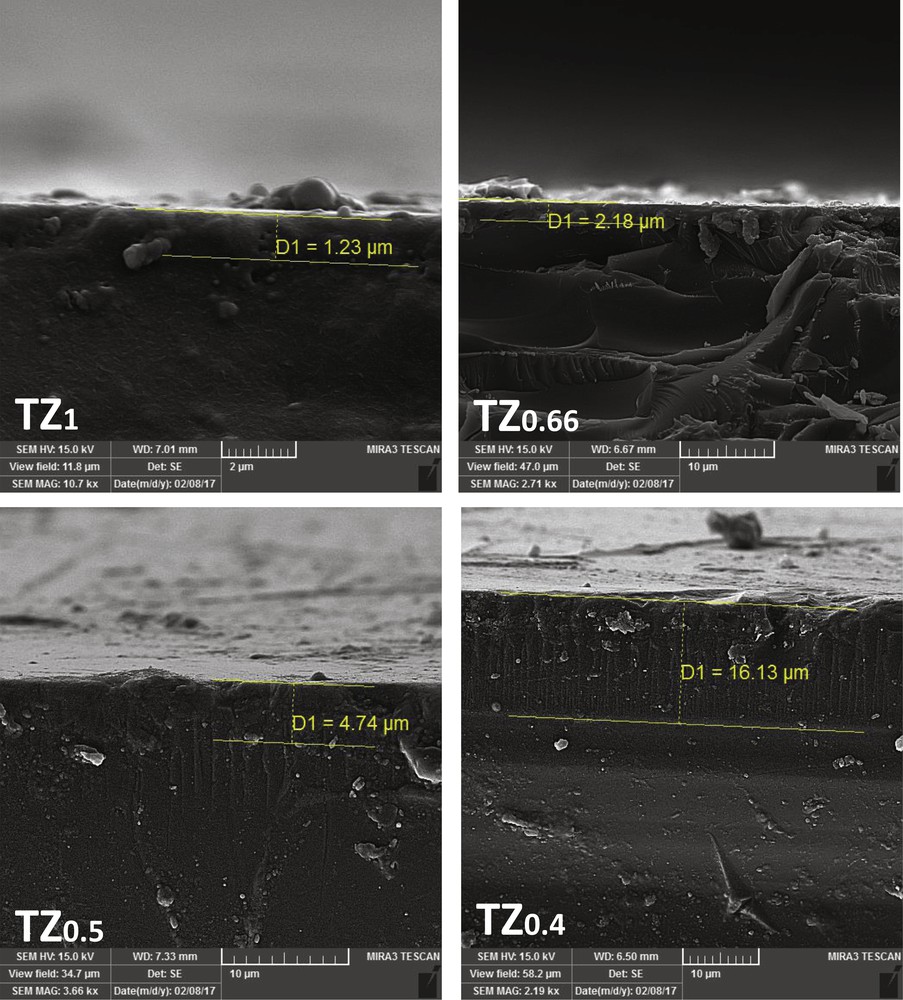
FESEM images of TiO2–ZnO coatings synthesized from sols with different concentrations, side view. FESEM, field emission scanning electron microscopy.
3.4 UV-vis DRS analysis of TiO2–ZnO coatings
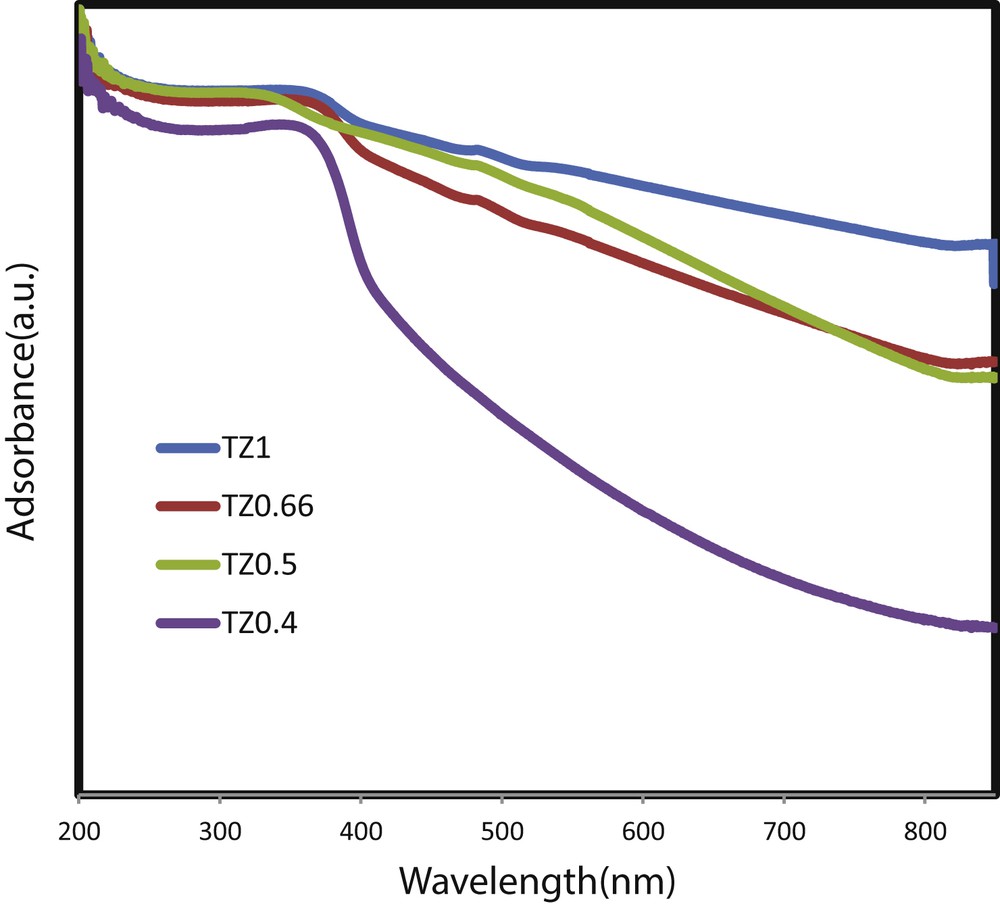
Fig. 6 represents the UV-vis absorption spectra for the TiO2–ZnO coatings prepared from different sol concentrations. All studied coatings absorb light both in the UV and visible regions. It means that composites of TiO2–ZnO, in addition to absorption in the UV region, absorb visible light, whereas pure TiO2 and pure ZnO are inactive in visible wavelengths. The TiO2–ZnO coating synthesized from TZ1 showed more shift to a higher wavelength, which means more photoabsorption in the visible light range. UV light absorption of TZ0.66 is similar to that of TZ1; however, visible light absorption is lower. TZ0.4 had the lowest UV absorption, and its visible light absorption is weaker than that of other studied coatings. It means that the amount of water in parent sol via changing the morphology, crystallite phase, and size and particle distribution, as confirmed by XRD and FESEM, can influence the light absorption capability of the as-prepared coatings. TZ1, which has a higher ratio of anatase to rutile, uniform morphology, small particles without agglomeration, and cracks, shows the strongest UV and visible light absorption. The optical bandgap values of the TiO2–ZnO films were calculated from the following equation:
| Bandgap (eV) = 1440/absorption edge (nm). |
DRS results of TiO2–ZnO coatings prepared from different sol concentrations. DRS, diffuse reflectance spectra.
Fig. 7 shows the absorption edge of studied coatings. The calculated Eg values of TiO2–ZnO coatings prepared from TZ1, TZ0.66, TZ0.5, and TZ0.4 are 2.23, 2.42, 2.18, and 3.16 eV, respectively, which are lower than what were reported by Pozan and Kambur [30]. This trend indicates that the TiO2–ZnO coating with smaller particles and more uniform morphology has lower bandgap energy. Moreover, this trend can be further correlated with the portion of anatase in the coatings. The anatase-to-rutile phase transformation depends on the growth rate of the material, which is affected by surface defects, grain boundary concentration, and the degree of molecular packing [31]. According to literature, anatase has a bandgap of 3.2 eV and rutile has a bandgap of 3 eV. TZ0.5 shows pure rutile, and the lower bandgap is expected in this sample. TZ0.4 shows a very weak light absorption in both regions of UV and visible light and a very wide bandgap energy which mainly can be related to the amorphous state of TiO2 in that coating.
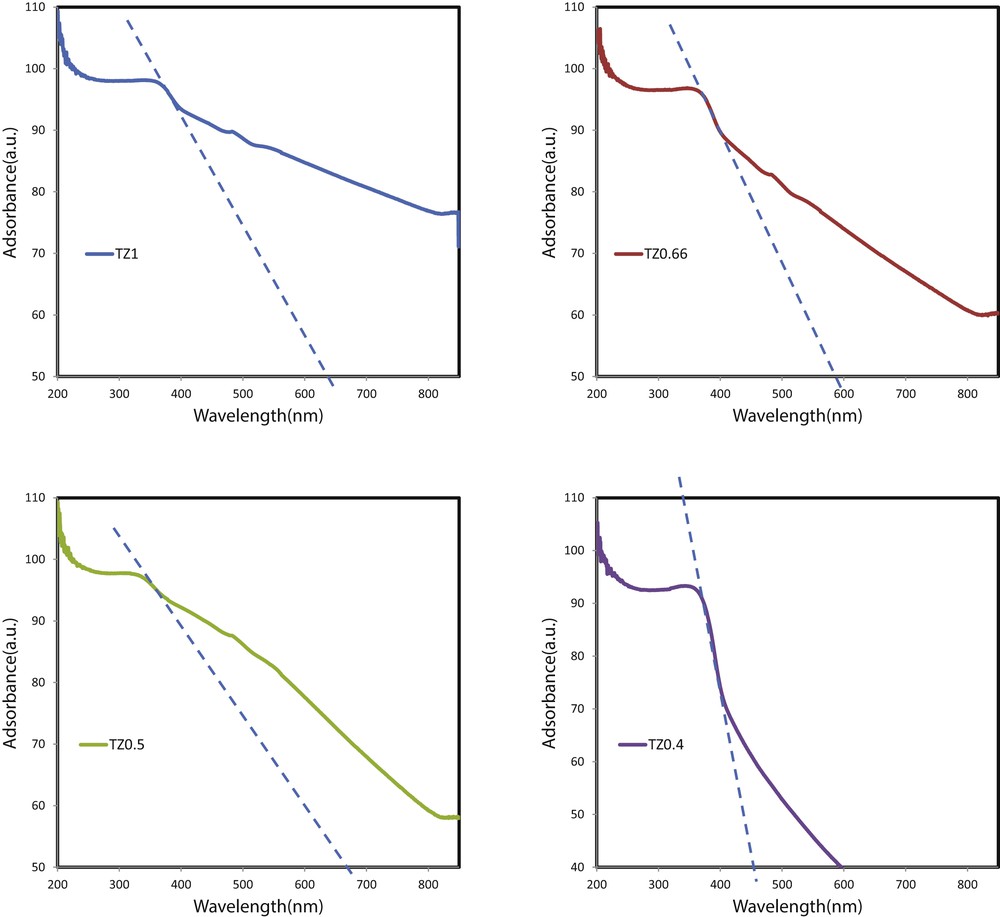
Absorption edges of TiO2–ZnO coatings synthesized from sols with different concentrations.
3.5 Adhesion test of TiO2–ZnO coatings
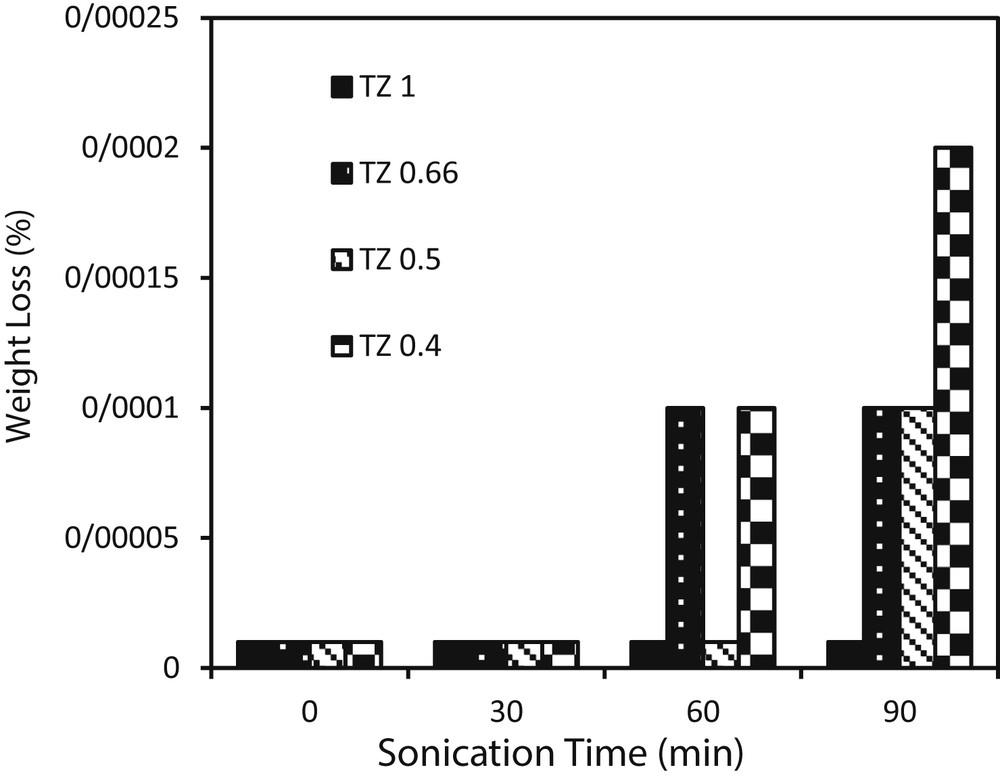
To investigate the effect of sol concentration on adhesion of TiO2–ZnO coatings, ultrasonication vibrations were carried out, and the results are illustrated in Fig. 8. As shown, after 90 min of sonication, TZ1 showed good attachment between the coating and substrate. Decreasing the sol concentration to TZ0.66, TZ0.5, and TZ0.4 led to weaker adhesions. Elemental composition of the substrate and pH of the sol are two important factors in adhesion of the coatings to the substrate [32]. Variation in sol concentration extremely alters the pH of the sol which has a key role in adhesion of the coating layers together and to the substrate. In highly concentrated sol (TZ1), the pH of the sol did not allow the formation of thick coatings, whereas with decreasing sol concentration, the pH changes in such a way that thick layers of TiO2–ZnO can be deposited. The over-increased thickness of TiO2–ZnO films leads to supersaturation of the glass support by the powder, which resulted in a decrease in electrostatic attraction between photocatalyst particles and the substrate [1]. Moreover, as confirmed by FESEM, decreasing the sol concentration caused deep cracks in coatings, which resulted in weak adhesion of the coating layers together and to the substrate.
Adherence test of TiO2–ZnO coatings synthesized from sols with different concentrations.
3.6 EDX analysis of TiO2–ZnO coatings
The results of EDX analysis of TiO2–ZnO coatings of the as-prepared sample from sol TZ1 are shown in Fig. 9. Ti, Zn, O, and Si are detected in this coating, and no impurities are observed. This analysis illustrates the presence of a uniform TiO2–ZnO coating on the glass surface with the existence of a distinct boundary between the coating and the substrate surface. The thickness of the coating is between 1 and 2 μm which is consistent with FESEM cross-section results. EDX images show titanium as the dominant element with dispersed Zn as the dopant element on the substrate surface and also confirm that the glass substrate contains Si and O and, in fact, acid washing dissolved all impurities.
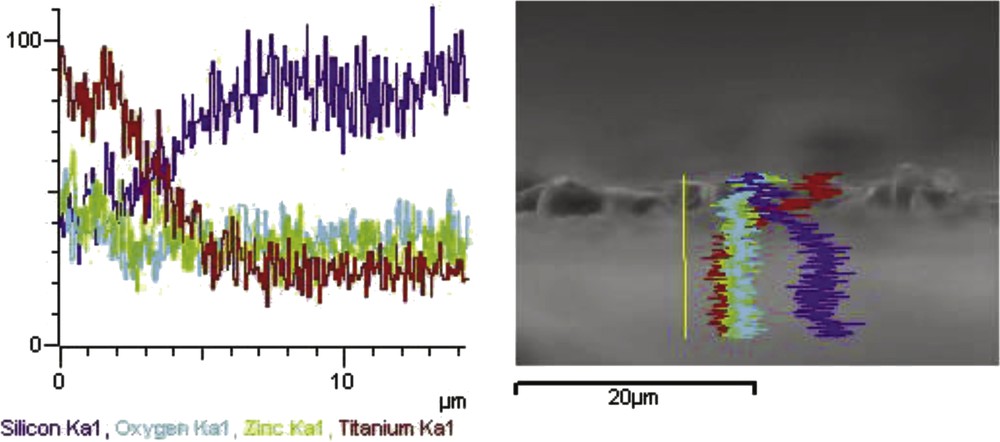
Energy-dispersive X-ray (EDX) line analysis of glass plate coated with TiO2–ZnO synthesized from sol TZ1.
3.7 TEM analysis of TiO2–ZnO coatings
The morphology of TZ1 coating is further characterized by TEM analysis (Fig. 10). As shown, TiO2 particles are spherical with about 10-nm diameter and ZnO appeared as nanorods with approximately 2-nm diameter and 15-nm length. Severe aggregation of particles is not observed. In detail, ZnO nanorods are centered on a TiO2 sphere, which confirms a strong connection between catalyst components. This availability guarantees the easy charge carrier mobility between ZnO and TiO2. Earlier UV-vis DRS and photocatalytic tests confirmed strong absorption of UV and visible light, which could be originated from this unique property in morphology of TZ1. This particular morphology also facilitates the separation of charge carriers, which extends the lifetime of the photocatalyst.
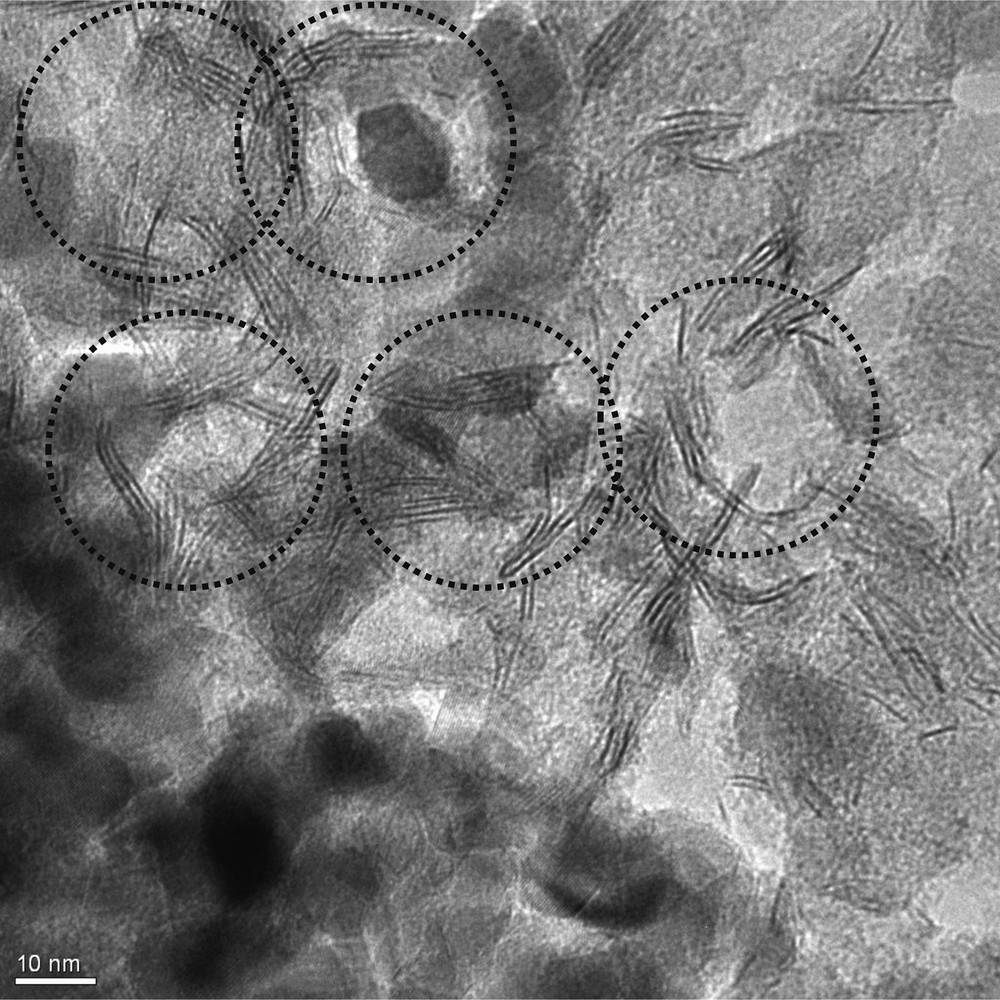
TEM picture of glass plate coated with TiO2–ZnO synthesized from sol TZ1. TEM, transmission electron microscopy.
3.8 Effect of pH of wastewater on photoactivity of TiO2–ZnO coatings
Owing to the influence of wastewater pH on the interaction between dye molecule and surface of the photocatalytic coatings, analyzing the effects of pH is necessary [34]. As shown in Fig. 11, the TiO2–ZnO coatings had the best activity at pH 7 so that the 83.05% of initial dye was photodegraded after 390 min of UV irradiation (whereas at pH 3 and pH 10, the TiO2–ZnO coatings just decomposed 48.69% and 61.38% of the initial dye, respectively). Owing to the relation of pH to the zero point of electrical charge of the coatings, variation in pH leads to change of surface charge in metal oxides [34,35]. The change in surface charge influences the adsorption of dye molecules on the photocatalyst surface of charge carriers and also the production of active radical species and, in conclusion, the photocatalytic activity [35,36]. In accordance with the surface charge theory, the zero points of electrical charge for TiO2 and ZnO are 6.2 and 9, respectively [37]. Owing to the zero point of electric charge of the existing oxides and the doping of TiO2 with 20% mol ZnO, it seems that these factors cause a change in the zero electric charge of TiO2–ZnO coatings to a value between 6.2 and 9 which is reported to be about 7 by Ali İmran Vaizoğulla [38]. It means that in acidic pH, the coating is positively charged. On the other hand, methylene blue is a cationic dye and is dissolved in its protonated form in water [MB+]. Under these conditions, the amount of positive charge (H+, MB+) increases, which prevents the adsorption of methylene blue on the positively charged coating. Furthermore, ZnO dissolves in low pH conditions, which decreases the photoactivity. At higher pH conditions, highly populated OH− anions in the solution neutralize [MB+] and harden the adsorption of dye to the negatively charged coating surface.
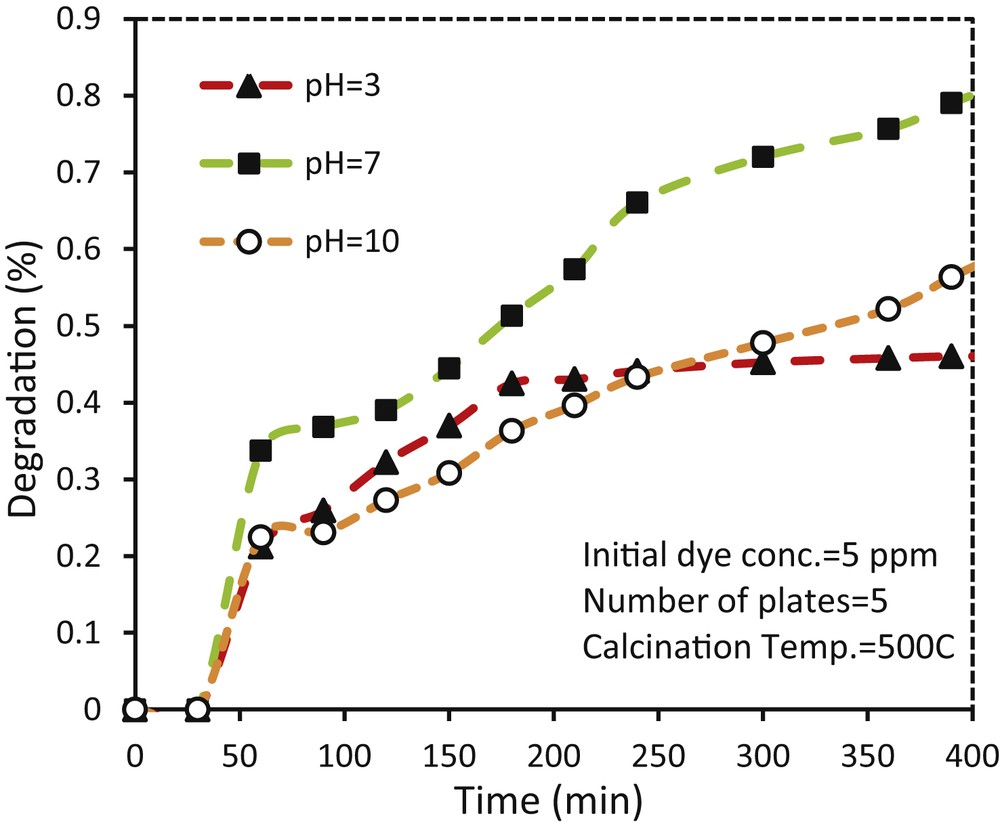
Effect of pH on photodegradation of methylene blue using glass plate coated with TiO2–ZnO synthesized from sol TZ1.
3.9 Effect of initial dye concentration on the photoactivity of TiO2–ZnO coatings
The photocatalytic activity of synthesized coatings was studied in photodecomposition of methylene blue with various initial concentrations. The results shown in Fig. 12 indicate that the highest photodegradation by TiO2–ZnO coatings was observed at 10 ppm dye concentration until 360 min. At this period, the TiO2–ZnO coatings removed 97.3% of methylene blue with an initial dye concentration of 10 ppm, whereas this percentage of dye degradation for 15 ppm has reduced to 94.5%. Increasing the dye concentration leads to the scattering of light in the solution and decreases the absorption of photons by the coatings [39,40]. With reduction of the number of photons, the excitation in the bandgap decreases which subsequently decreases the charge transfer between TiO2–ZnO coatings [40,41].
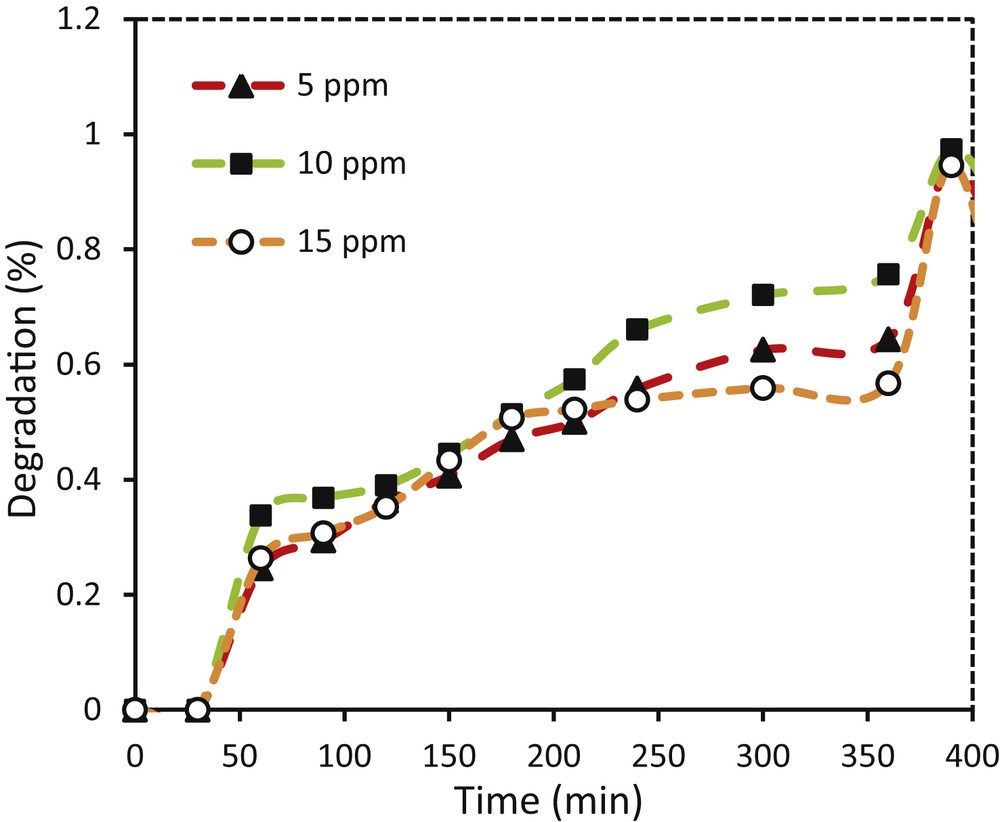
Effect of initial dye concentration on photodegradation of methylene blue using glass plate coated with TiO2–ZnO synthesized from sol TZ1.
3.10 Effect of the number of coated glass plates on the photoactivity of TiO2–ZnO coatings
Applying an optimum amount of photocatalyst enhances the amount of photodegradation of pollutants and minimizes the costs. In this work, for increasing catalyst active sites, the number of photocatalyst-coated glass plates was increased. The results show that increasing the number of coatings enhanced the photodecomposition of methylene blue. The highest degradation rate of methylene blue was achieved by seven plates of TiO2–ZnO coatings (Fig. 13). Results confirm that three, five, and seven plates of TiO2–ZnO coating removed 36.6, 58.1, and 79.03% of the initial dye, respectively. Increasing the concentration of the photocatalyst in the powder form causes catalyst agglomeration [40] and increases the penetration resistance of the holes and scattering of light [42], whereas in the immobilized photocatalyst, increasing the number of coatings enhanced active sites and therefore the light absorptions. Using more than seven glass plates was not possible because of space limitations in the photoreactor cell.
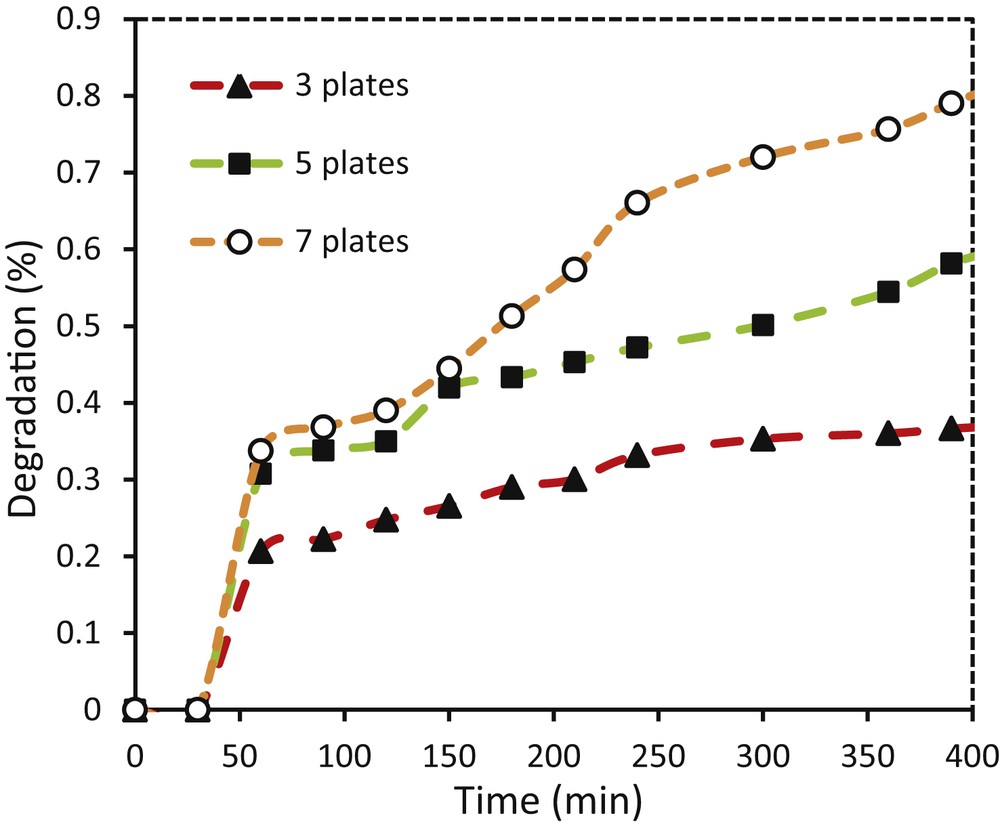
Effect of the number of photocatalyst-coated glass plates on photodegradation of methylene blue using glass plate coated with TiO2–ZnO synthesized from sol TZ1.
3.11 Reusability of TiO2–ZnO coatings
Optical and mechanical stabilities of photocatalytic coatings are important factors in photocatalytic wastewater treatment [43,44]. The reusability test of TiO2–ZnO coating prepared from TZ1 sol indicates that this coating preserved high photocatalytic activity after five cycles and the photoactivity reduces around 3% (Fig. 14). The results prove the stability of the nanostructured TiO2–ZnO coatings in the photodegradation of methylene blue. Earlier adhesion test already confirmed the strong mechanical stability of this coating. The TEM image also indicates the proper attachment of TiO2 and ZnO, which facilitates charge separation and optical stability of the coating. In detail, in the TiO2–ZnO composites, the electron transfers from the conduction b/and of ZnO to the conduction band of TiO2 and, conversely, hole transfers from the valence band of TiO2 to the valence band of ZnO. This charge separation increases when TiO2 and ZnO are in complete physical contact as confirmed by TEM. Charge separation delays the electron–hole recombination, which preserved the optical stability of the sample. Inappropriate structures of the interface in TiO2–ZnO composites limit the interfacial charge-transfer process of photogenerated charge carriers and thus lower the photocatalytic property of the nanocomposite materials [45–48]. Fig. 15 shows thermogravimetric analysis (TG) of TiO2–ZnO synthesized from the TZ1 sol after heating steps. An initial weight loss of 6.66% was observed after thermal treatment, which indicated proper thermal stability of the coating. The morphology of the used coating is shown in Fig. 16, in which no detachment was observed.
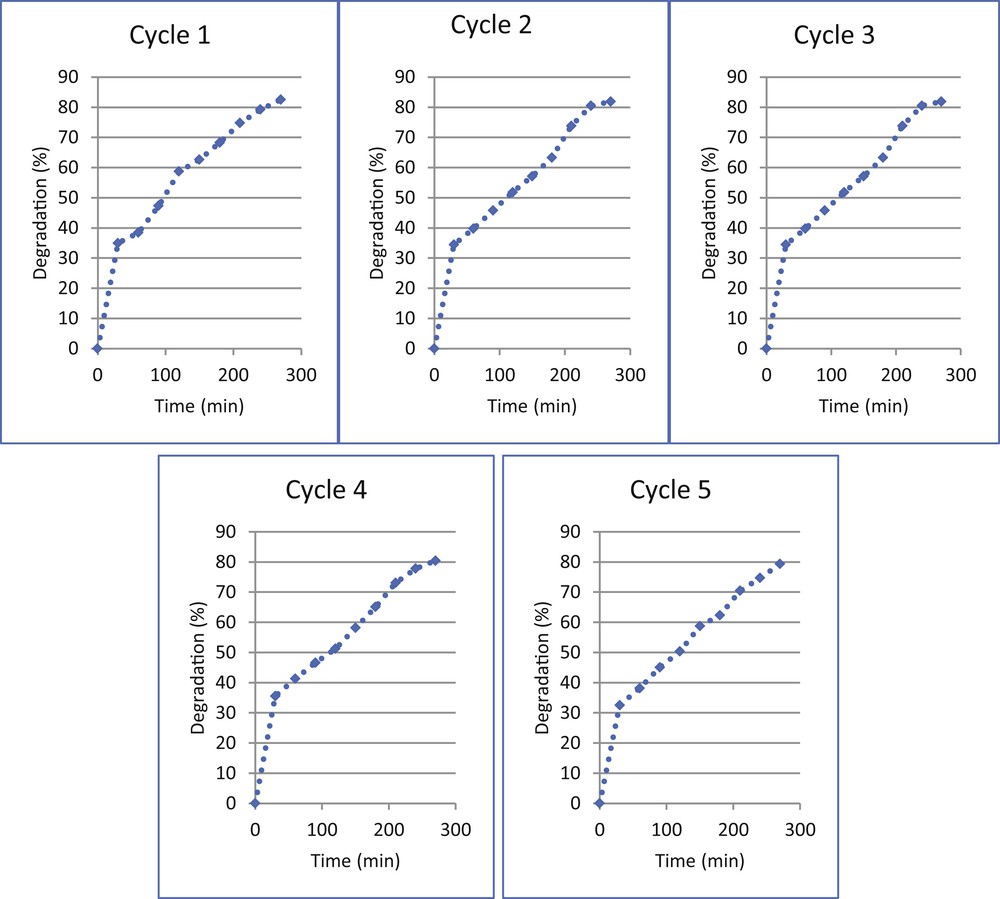
Optical stability of glass plate coated with TiO2–ZnO synthesized from sol TZ1.
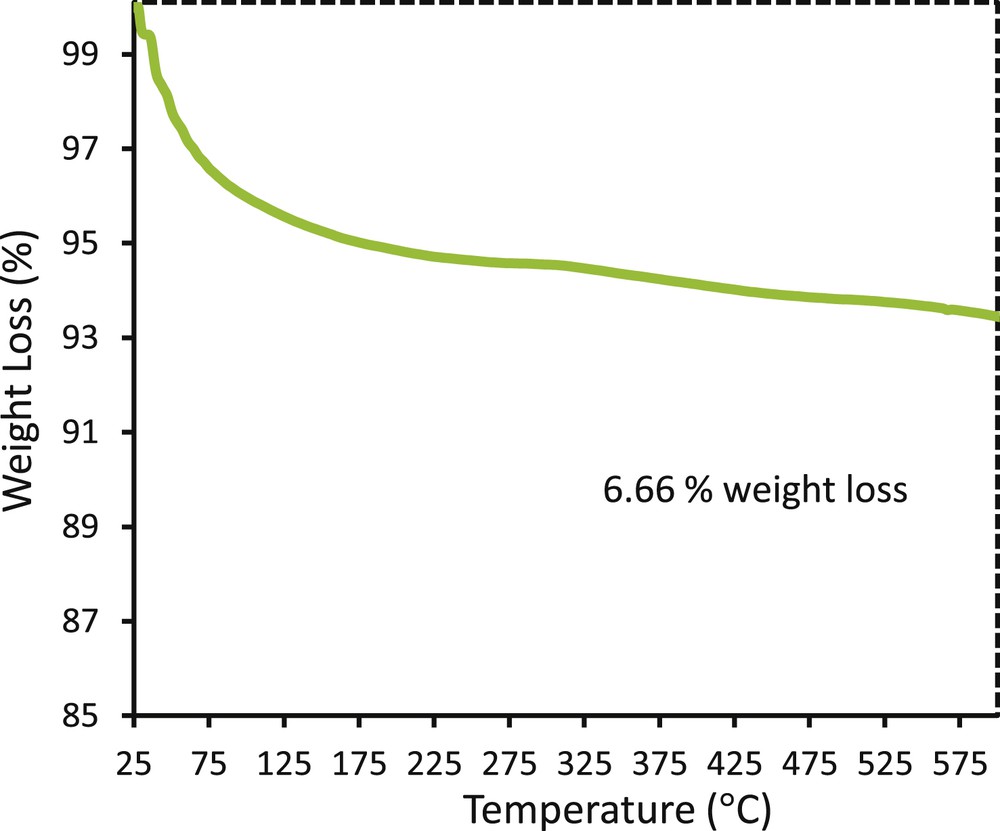
Thermogravimetric analysis (TG) of TiO2–ZnO composite synthesized from sol TZ1.
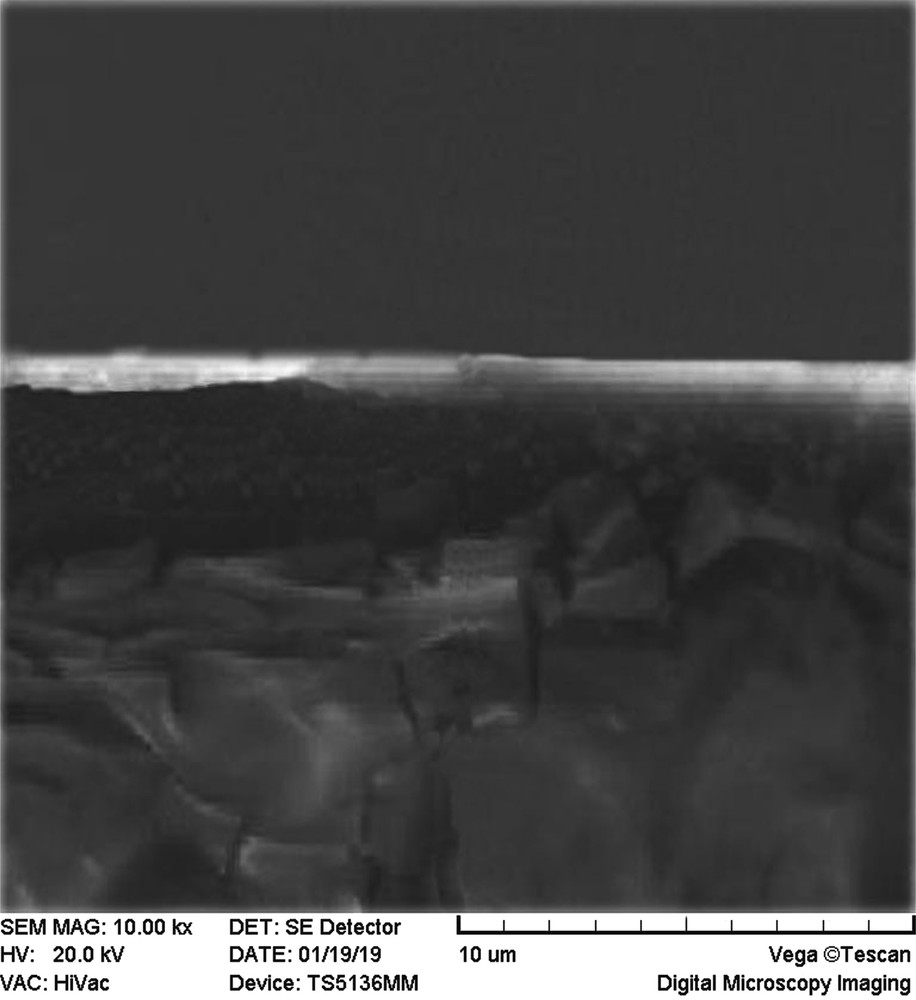
SEM picture of cross cut of used TiO2–ZnO coating synthesized from sol TZ1. SEM, scanning electron microscopy.
4 Conclusions
In this research, TiO2–ZnO nanostructured films originating from different sol concentrations have been deposited on glass plates by the sol–gel dip-coating technique. The results revealed that the photocatalytic activity of coatings decreased by decreasing the sol concentration. Adding extra water than the stoichiometric amount leads to easier wash coating due to the fact that it changes the pH and viscosity of the sol. Furthermore, it changes some parameters during hydrolysis and condensation and results in different crystalline structure, morphology, light absorption, mechanical stability, and topology of coatings. The maximum sol concentration forms TiO2–ZnO coatings with uniform morphology of small particles without any crack, whereas decreasing the sol concentration leads to agglomeration of particles and development of cracks on the surface of coating. The portion of anatase and rutile has been also influenced by the sol concentration. Although the concentrated sol has good absorption of UV and visible light, the coating prepared from dilute sol can be active only in the UV region. The concentrated coating illustrated good mechanical stability, fairly rough surface, and core-shell morphology of TiO2–ZnO. In this morphology, ZnO nanorods have been gathered around a TiO2 sphere that makes a proper interface between TiO2 and ZnO for charge transfer. This coating lost around 3% of its activity in photodegradation of methylene blue after five runs, and its mechanical and thermal stabilities have been confirmed. Neutral pH, moderate dye concentrations, and an increased number of coated glass plates enhance the activity of this coating at photocatalytic degradation of methylene blue.
Acknowledgements
The authors gratefully acknowledge Sahand University of Technology, Iran, for complementary financial supports.