

1 Introduction
Porous and transparent metal oxides have attracted increasing interest because of their wide range of potential applications [1–3]. Transparent glass composed of silica is the most well-studied oxide [4–6]. Other functional porous oxides, including titania, have also attracted considerable attention [7,8]. Titanium dioxide has applications in many areas, such as photocatalysis and electrocatalysis [9], detectors [10,11], energy storage [12], medical applications [13] and solar cells [14]. It has attracted increasing attention and has a very wide range of uses, because of its excellent photonic activity, high stability, nontoxicity and low cost. TiO2 has three different crystalline phases: anatase, rutile and brookite [15]. The anatase phase of TiO2 is characterized by a large bandgap and high electron mobility. This phase of TiO2 is most interesting when it is used in dye-sensitized solar cells [16] and for photodegradation [17]. TiO2 has a very high reactivity and chemical stability upon exposure to ultraviolet (λ <400 nm) or visible light.
Titania xerogel represents one of the most promising classes of porous titania because of the unique properties inherent to these materials, namely, a high porosity and a low density. Different methods have been used to synthesize TiO2. Among these processes, the classic sol–gel method requires less energy and less time, and the materials prepared by this method are very diverse at the nanoscale. Doping with a small quantity of different elements potentially alters the structure and electronic properties of the oxides. The doping species is substituted by atoms in the host metal oxide [18]. Several TiO2 modifications have been proposed: doping with the transition metals Cu, Co, Ni, Fe, Ru, Au, Ag and Pt [19–23], non–metal-doped TiO2 [24], composites of TiO2 [25–27] and TiO2 doped with rare-earth elements [28].
In addition, doping modifies the forbidden band, which positively modulates the process of electron-hole separation and recombination [29]. In addition, the doping process increases the number of adsorbed dyes on the surface by increasing the surface area of the semiconductor.
Several methods have been used to prepare titania wet gels and xerogel monoliths [30,31]. However, very few investigations have obtained transparent titania xerogels [32–37]. Transparent doped titania xerogels have been efficiently used as coatings for antifogging mirrors [38], solar cells and chemical or medical sensors [30].
The present study was divided into two parts. The first was devoted to analyzing the effect of synthesis parameters on the gel time of transparent Fe-, Al- and Sr-doped titanium dioxide and the evolution of transparency as function of the dopant properties. Samples that make the subject of the second part is those that present higher transparency. The second part aimed to study the effects of Fe3+, Sr2+ and Al3+ doping on enhancing the physicochemical properties of selected TiO2 and the optical properties of these photocatalysts. Physicochemical studies focused on the crystallinity, surface morphology and thermal stability of monoliths, while optical properties of doped TiO2 were monitored using an ultraviolet-visible diffuse reflectance spectrophotometer (UV-vis DRS). Finally, the catalytic efficiency of selected doped titanium dioxide monoliths was assessed by monitoring the degradation of methylene blue (MB) upon UV and solar irradiation.
2 Experimental study
2.1 Monolith synthesis
The chemical reagents used in the present study were titanium(IV) tetraisopropoxide (Ti(iOPr)4, 97%; Sigma-Aldrich), glacial acetic acid (99.8%; Panréac), anhydrous aluminium(III) chloride (AlCl3, 97%; Sigma-Aldrich), anhydrous iron(III) chloride (FeCl3, 97%; Sigma-Aldrich), anhydrous strontium nitrate (SrNO3, >99%; Sigma-Aldrich), absolute ethanol (C2H6O, >99.8%; Sigma-Aldrich), absolute isopropanol (C3H8O, 100%; Sigma-Aldrich) and absolute 1-butanol (C4H10O, 99.5%; Sigma-Aldrich).
The synthesis protocol used in this study is shown in Fig. 1 of the supplementary data and was based on the study by El Mir et al. [37]. Seven millilitres of the solvent (alcohol) was mixed with 1.5 ml of glacial acetic acid while stirring. After 1 h of stirring (esterification reaction between acetic acid and alcohol), 5 ml of the precursor was added and a clear and stable solution was obtained. After 30 min of stirring the whole mixture, 0.5 ml of the salt solution was added. The molar ratio between solvent, precursor, glacial acetic acid and metallic salt was 14:10:x:y, where x = 0, 0.5, 1, 1.5 and 2, and y= 0.5, 0.75 and 1.
2.2 Monolith characterization
The crystal structures of the samples were determined using a PANanalytical X'Pert Pro wide-angle X-ray powder diffractometer, equipped with a copper anticathode that produced Cu Kα radiation at 1.5418 Å.
The recorded diffractogram corresponded to as-prepared samples and calcinated xerogels under air flow for 4 h at 773 K and 923 K. The Fourier-transform infrared (FTIR) spectra of all samples were obtained using a SHIMADZU 8400S instrument. The spectra of solids were obtained using KBr pellets. Before the measurements, the xerogel and KBr were mixed at a quality ratio of 1:100.
The PerkinElmer STA 6000 simultaneous thermal analyzer allowed us to record the thermogravimetric and differential thermogravimetric analysis (TGA-DTG) thermographs. The UV-vis absorption spectra were recorded with absorbance and % transmittance using a PerkinElmer LAMBDA 1050 UV/Visible/NIR spectrophotometer. The bandgap energy was calculated using a graphical method by plotting the variation in (αhν)1/n versus (hν) with the Tauc relation: , where
α is the absorption coefficient,
h is the Planck constant,
ν is the wave number.
The textural characteristics were analyzed using an ASAP2020 Micrometrics physical nitrogen adsorption/desorption instrument.
Generally, the thermal analysis aimed to study changes in the behaviour of the material as a function of temperature, including dehydration, enthalpy, weight loss, fusion, decomposition, phase analysis, etc.
The TGA/DTG thermograms of gels were recorded using a PerkinElmer STA 6000 instrument. An alumina crucible was used to heat the powders. This thermal analysis was conducted under an area atmosphere (60 ml/min) with a heating rate of 10 °C/min at temperatures ranging from 32 to 900 °C. The initial weights of the analyzed materials were 17.90 mg of Al–TiO2, 11.32 mg of Fe–TiO2 and 11.44 mg of Sr–TiO2.
2.3 Photocatalytic assay
We evaluated the photocatalytic behaviour of the synthesized xerogels by monitoring the degradation of MB upon UV and solar irradiation in an aqueous solution. The reactor used for the UV degradation is presented in supplementary data Fig. 2 and was the same reactor used by Kachbouri et al. [17]. It comprises two HEROLAB UV 4 SL 8 W emitting two UV wavelengths (254 and 365 nm), an aluminium cover, one 80-ml volumetric cylinder and a magnetic stirrer.
For degradation induced by sunlight, adsorption was performed in the previous assembly, and then the mixture (dye solution and catalyst) was exposed to sunlight under rigorous agitation.
One hundred milligrams of photocatalyst was suspended in 80 ml of a 30-mg/L MB solution. The suspension was stirred for 60 min in dark to ensure an even dispersion of the photocatalyst and an adsorption-desorption equilibrium. The mixture was irradiated with the two lamps at a wavelength of 254 nm. The progress of the reaction was followed by periodic manual sampling. The samples were filtered through a 0.45-μm membrane, and the concentration of MB was measured using a UV-visible spectrophotometer at 664 nm.
3 Results and discussion
3.1 Gel time and transparency
3.1.1 Effect of salts on the gel time
Fig. 1 presents the variation in gel time (GT) as a function of the concentration and type of metallic salts and solvents used. Note that the GT increased as the type of alcohol varied, regardless of the doping metal. This variation is potentially explained by the effect of alcohol type on the esterification reaction that generates water for hydrolysis and condensation of the titanium precursor. The changes in GT as a function of alcohol type are consistent with the results reported by Kesmez et al. [39]. On the other hand, the GT increased as a function of the percentage of the doping reagent, which is explained by two phenomena. The first phenomenon was reported by Hasegawa et al. [40], who presumed that Ti4+ changed its oxidation number from +IV to +VI to enable its hexacoordination with anions (Cl− and NO3–). The formation of these complexes causes competition with the germination of the crystalline lattice. This competition is manifested by an increase in the GT. The second explanation was based on the difference in the acidic capacity of the dopants. FeCl3 is more acidic than AlCl3 [41], which is more acidic than SrNO3, and a decrease in the pH of the medium favours the hydrolysis of the precursor and not polycondensation. The increase in GT as a function of the type of doping metal is consistent with the results of previous studies in this field.
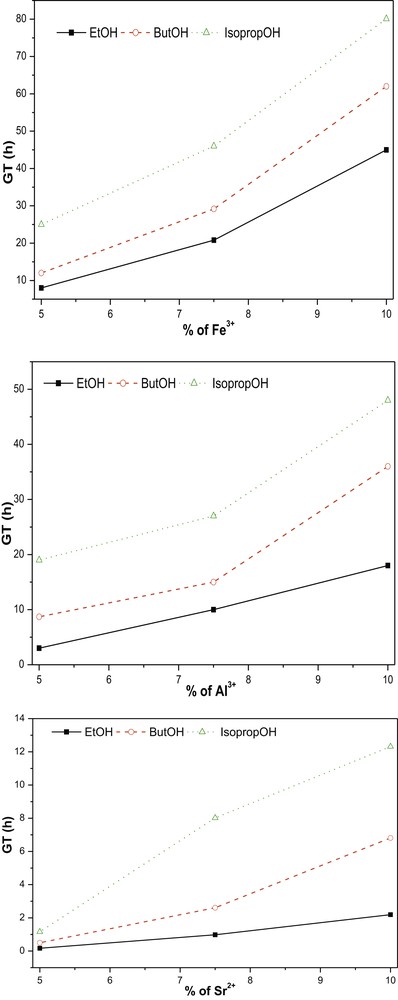
Evolution of the GT according to the nature of dopant, dopant concentration and solvent (with VAcA= 1.5 ml). GT, gel time.
3.1.2 Effect of the amount of acetic acid (Ac.A)
Table 1 shows an increase in the GT with an increase in the molar ratio of added acetic acid (catalyst) in the presence of 10% added metal. This variation was explained as followed by Parra et al. [42]: the acetate anions function as bidentate ligands and are fixed on Ti4+ cations in either a chelating or bridging manner (Eqs. 1 and 2). These two types of bonds inhibit the progression of polycondensation (Fig. 2) which increases the GT of the sol. The variation in the GT was more significant for samples doped with Fe3+ and Al3+, and this difference was due to the increase of the pH of the solution generated by the Lewis acid behaviour of these dopants. Equation 2: Formation reaction in which acetate is chelated [42]. Variation in GT (h) as a function of the Ac.A molar ratio with different solvents (the dopant concentration was fixed at 10%). Germination of gels modified with acetic acid [42].
Ac.A molar ratio GT (h) Ethanol Butanol Isopropanol Fe Sr Al Fe Sr Al Fe Sr Al 0 0 0 0 0 0 0 0 0 0 0.5 23 1.5 15 43 5 18 52 11 30 1 28 1.8 16.4 51 5 27 61 9 33 1.5 45 2 18 62 6 36 80 12 48 2 70 7 38 87 17 37 102 24 64 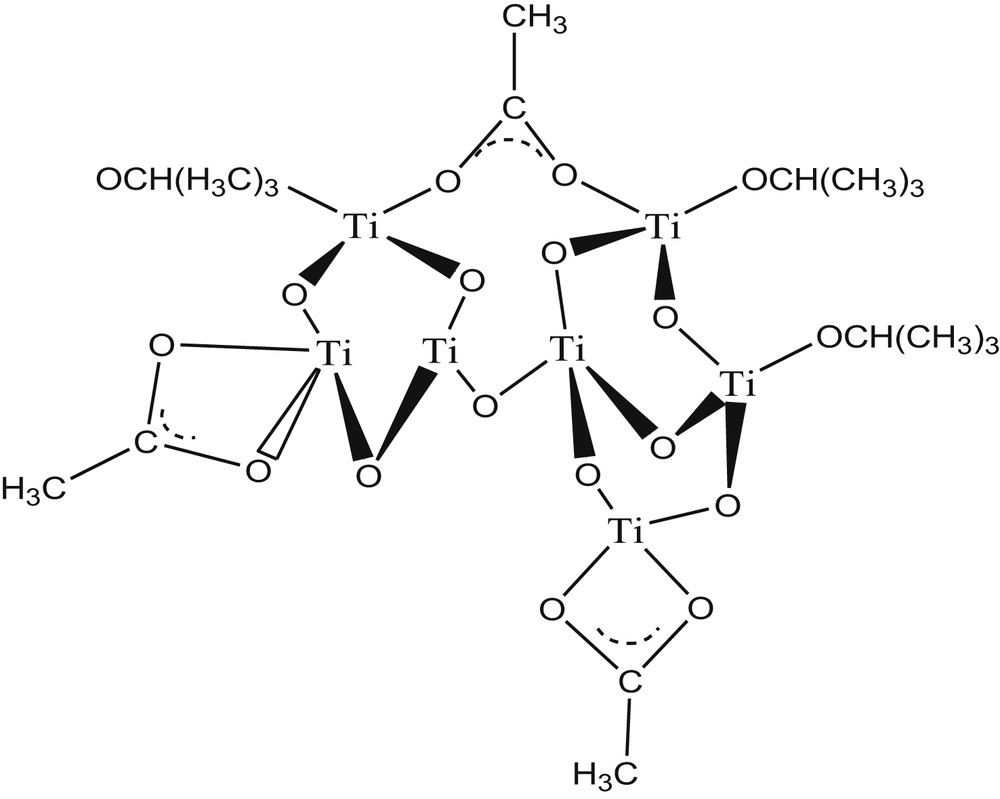
Equation 1: Bridging acetate formation reaction [42].
3.1.3 Transparency of gels
The transparency of samples only depends on the metal type. Using the chosen synthetic route, better transparency was observed under the optimum conditions: ethanol as the solvent, an acetic acid molar ratio of 1.5 and 10% concentration of the dopant. These results are shown in Fig. 3. The results were discussed based only on the nature of the salt.
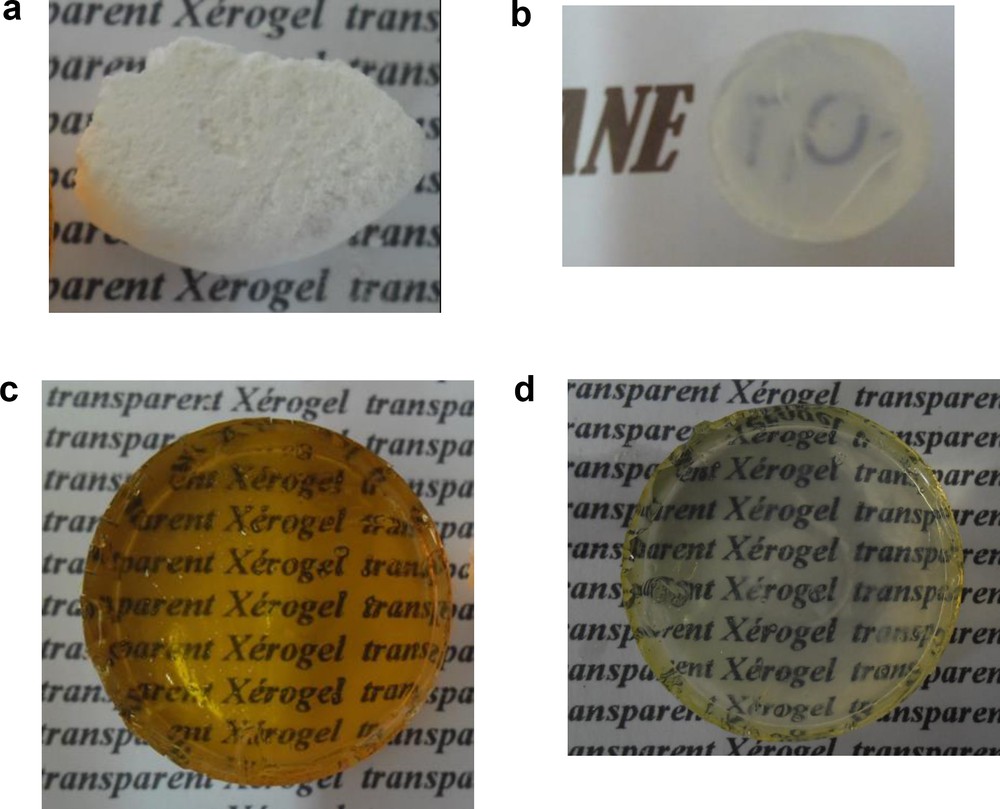
(a) Nondoped TiO2 monolith xerogel. (b) Sr–TiO2 monolith xerogel. (c) Fe–TiO2 monolith xerogel. (d) Al–TiO2 monolith xerogel.
As shown Fig. 3, pure TiO2 was opaque, while Fe–TiO2 and Al–TiO2 were more transparent than Sr–TiO2. The opacity of undoped TiO2 confirmed that acetate anions did not effect the transparency of the samples. This result contradicts the findings reported by Elghniji et al. [36]. Acetate reacts with Ti4+ but does not substantially change the optical property of the gel.
The effect of salts was explained by the function of anions as ligands; they reacted with titanium hydroxide in a nucleophilic substitution reaction (Eq. 3) to form a hexacoordinated titanium complex (Fig. 6 in the supplementary data) [42]. This complexation alters the directions of germination, ensuring the refraction and passage of light within the material. This result was consistent with findings reported by Hasegawa et al. [40]. Researchers have hypothesized that chloride anions participate in the complexation of Ti4+ or act as a Lewis base catalyst for solgel condensation. Here, the partially condensed hydrolysates and Ti atoms became more reactive to nucleophilic attack than the sites. Fewer Ti atoms were hydrolyzed and condensed because the first atom was more deficient in electrons than the latter [43]. Then, the reaction occurs locally and heterogeneously. The hydrolyzed and condensed species react to a greater extent, while unreacted species remain. The difference in transparency between Al3+-, Fe3+- and Sr2+-doped samples was explained by the difference in the electronic forces between Cl− and NO3-, as chloride anions possess a greater nucleophilic component than nitrates [44]. Equation 3:Reaction between the anion of the strong acid and titanium hydroxide.
3.2 Xerogel characterization
3.2.1 Optical characterization
According to the UV-vis-NIR spectra (Fig. 4), all samples were transparent in the visible-NIR range, while they were opaque in the UV range. These results confirm the transparent appearance observed with the naked eye.
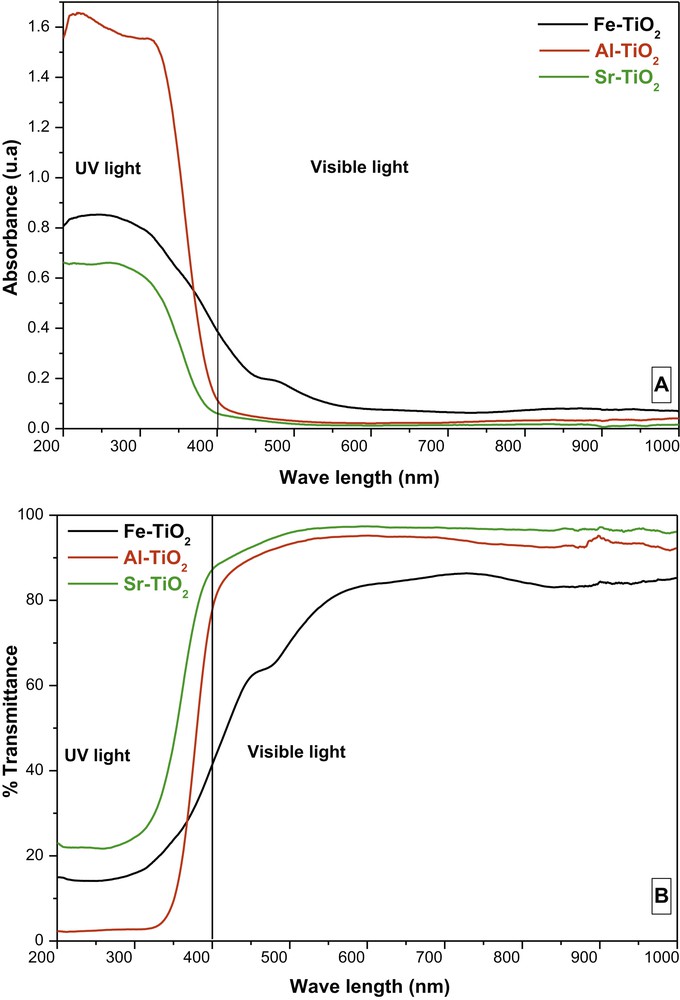
UV-vis spectra showing the absorbance (a) and % transmittance (b).
The determination of the optical bandgap is obtained using the Tauc equation (Fig. 5) [45]
| (1) |
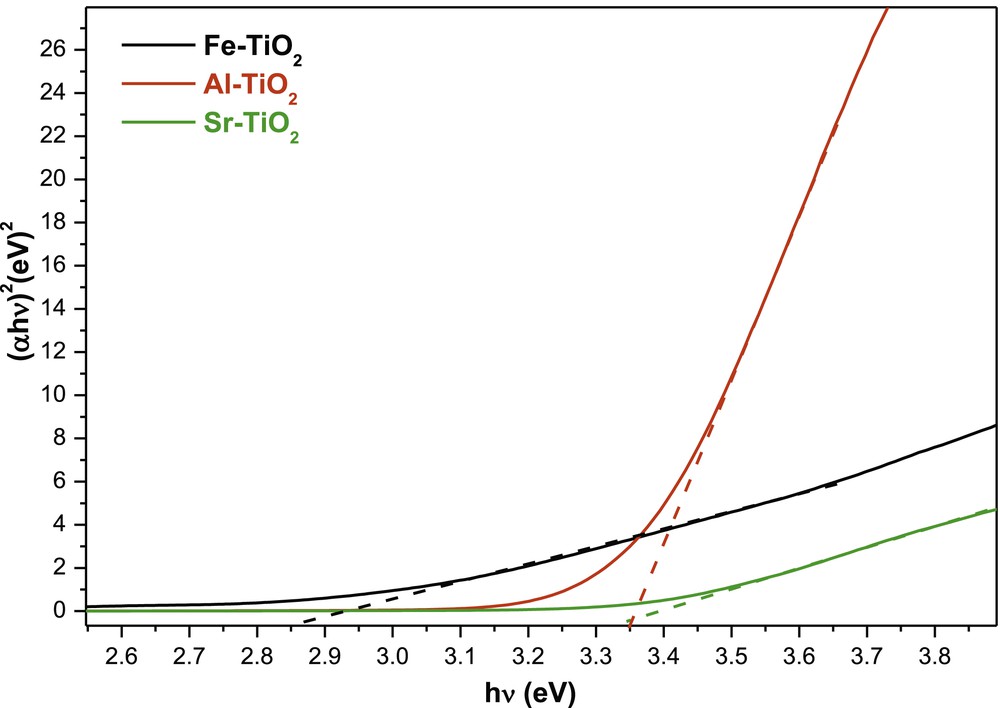
Tauc plot of (αhν)2 versus (hν).
The bandgap energy of titanium dioxide doped with aluminium and strontium remains in coincidence with the UV light and is slightly higher than the bandgap energy of pure TiO2 (Table 2). The increase in the bandgap energy of Al3+-doped TiO2 is consistent with the results presented by Pathak et al. [46]. Al3+ doping creates a nonstoichiometric structure by reducing Ti(IV) to Ti(III). Ti(III) and Al(III) defects induce a shallow energy level below the conduction band that inhibits electron transport and function as electron-trapping sites that cause the slight spreading of the bandgap [47]. On the other hand, the increase in bandgap energy observed for Sr2+-doped TiO2 contradicts the results reported by Hamedani et al. [48]. This contradiction is potentially explained by the difference in the morphology of synthesized TiO2.
Gap energy of M-doped TiO2.
| Sample | Experimental gap (eV) | Reference gaps |
| Fe–TiO2 | 2.85 | 2.50 [49] |
| Al–TiO2 | 3.35 | 3.12 [47] |
| Sr–TiO2 | 3.34 | 5.2 [48] |
| P25 | 3.25 | 3.2 |
For Fe2+-doped TiO2, the bandgap energy was reduced. This reduction results from the presence of Fe(III) species that spread the range of absorbance to the visible region. This shift in absorbance is due to the creation of discrete energetic levels by the electronic transition of the “d” layer of iron, which reduces the forbidden band of the materials [49].
3.2.2 FTIR characterization
The FTIR spectra recorded for the xerogels obtained after drying at 80 °C for 12 h (Fig. 6a) and calcinated at 450 °C for 4 h (Fig. 6b) show the disappearance of many bands after calcination. The bands at a frequency of 661 and 837 cm−1 confirm the hydrolysis of the alkoxide and the formation of Ti–O–Ti and Ti–O bonds [36,37,41,50,51]. The two bands at 1028 and 1143 cm−1 are assigned to Ti–O–C groups [41,51]. The vibrations of the –CH3 groups of the acetates, the solvent and the isopropanol released by the titanium(IV) tetraisopropoxide adsorbed on the surface of the titanium dioxide are responsible for the appearance of the band at approximately 1350 cm−1 [36,41]. The two intense bands observed at 1442 and 1535 cm−1 correspond to the symmetrical and asymmetrical vibrations of the carboxyl group (COO), respectively, and result from the formation of a double bond between acetic acid and titanium [51,52]. The band at approximately 3400 cm−1 corresponds to the vibration of the lattice bond (O–H), unreacted acetic acid and unreacted solvent [17,52]. The calcined TiO2 spectra show the persistence of only three bands: a wide band between 500 and 800 cm−1 that corresponds to the vibration of the Ti–O–Ti and Ti–O bonds [51,52], a band at a frequency of 1626 cm−1 attributed to the vibration of the hydrogen bonds –OH ... O– [17,36,51] and the vibrations of the O–H bonds of the water adsorbed on the surface of the material. The last band located at a frequency of 3400 cm−1 is attributed to the terminal O–H group of the crystalline chain, and it is less important than in xerogels dried at 100 °C.
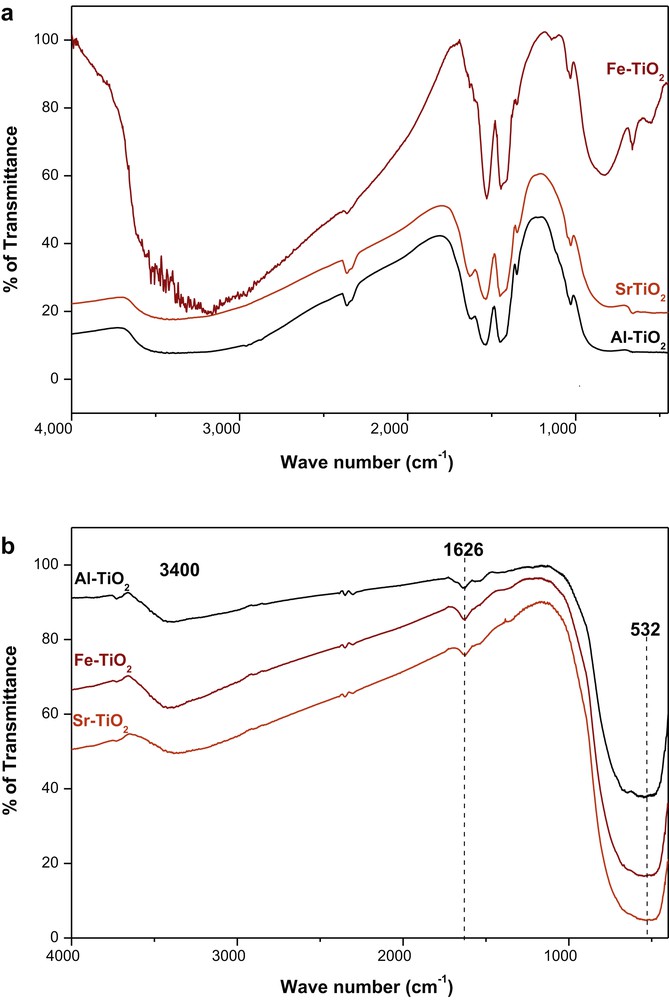
(a) FTIR spectra of xerogels dried at 80 °C for 12 h. (b) FTIR spectra of xerogels calcinated at 450 °C for 4 h. FTIR, Fourier-transform infrared.
3.2.3 Structural characterization
The X-ray diffractograms of the prepared samples (Fig. 7a) show that the Sr–TiO2 sample was amorphous, but Fe–TiO2 and Al–TiO2 samples displayed peaks at 2θ = 26°, 2θ = 38°, 2θ = 48° and 2θ = 54°, which correspond to the reticular planes (101), (004), (200) and (105) characteristic of the anatase (PDF 21–1272; space group I41/amd) phase, respectively [53]. This crystallinity of the as-prepared samples results from the strong acidity of the medium generated by the coexistence of acetic acid and FeCl3 and AlCl3, as the latter are Lewis acids [54,55].
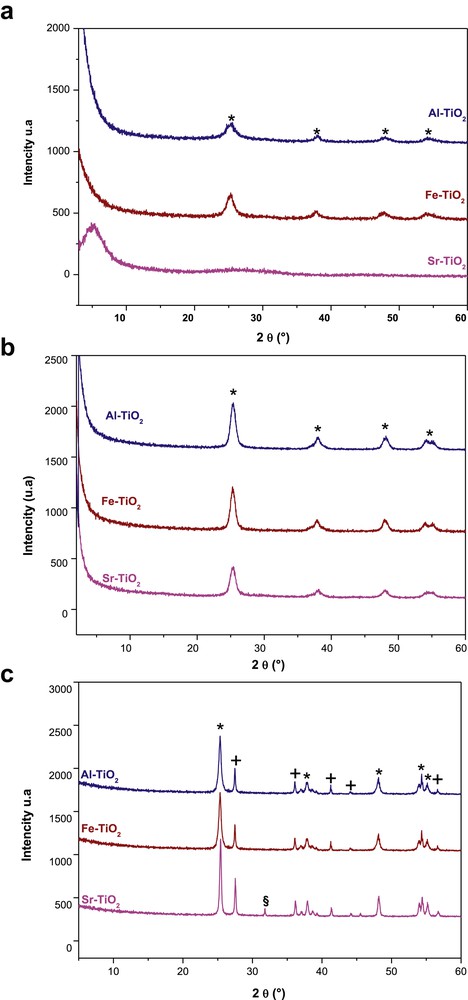
(a) X-ray diffractograms of noncalcined xerogels; (*) characteristic peaks of the anatase phase. (b) X-ray diffractograms of xerogels annealed at 450 °C; (*) characteristic peaks of the anatase phase. (c) X-ray diffractograms of xerogels annealed at 650 °C; (*) characteristic peaks of the anatase, (+) rutile and (§) brookite phases.
After thermal treatment for 2 h at 450 °C, the diffraction patterns (Fig. 7b) only presented characteristic peaks of the anatase phase of TiO2 at 2θ= 26°, 38°, 48° and 54°, which corresponded to the (101), (004), (200) and (105) planes, respectively, and the intensities of characteristic peaks of anatase were increased in the Fe–TiO2 and Al–TiO2 samples. The X-ray diffraction (XRD) spectra of doped titanium dioxide heated at 650 °C (Fig. 7c) displayed the diffraction peaks of the anatase and rutile phases, where 2θ values of 27.58°, 36.30° and 54.42° were attributed to the (110), (101) and (211) planes of the rutile phase (PDF 21–1276; space group P42/mnm), respectively. In Sr-doped TiO2, the characteristic peak of brookite phase was detected at 2θ= 31.8°, corresponding to the (121) lattice plane [56].
3.2.4 Thermal characterization
In Fig. 3.a and 3.b (in the supplementary data), Al–TiO2 and Fe–TiO2 TGA-DTG thermograms showed three stages of weight loss. The first occurred from 30 to 100 °C (weight loss of 13% for Al–TiO2 and 10% for Fe–TiO2), accompanied by an endothermic peak at 100 °C in DTG. This result was probably due to the removal of water and entrapped solvent in the pores of the materials. The second stage was observed between 210 and 440 °C for Al–TiO2 and approximately between 170 and 270 °C for Fe–TiO2. These weight losses (weight loss of 9% for Al–TiO2 and 6% for Fe–TiO2) were accompanied by an exothermic peak. These weight losses were attributed to the destruction of unbound organic matter (alcohol and acetate). The last weight loss stage occurred from 330 to 440 °C for Al–TiO2 and from 270 to 400 °C for Fe–TiO2. The presence of exothermic peak at approximately 400 °C suggest that the weight losses (5.63% for Al–TiO2 and 4% for Fe–TiO2) are associated with the decomposition of chelating and banding acetate groups. The phase transition observed in XRD patterns at up to 500 °C was not detected in DTG curves. We deduced that the energy of the transition from the anatase phase to the rutile phase was undetectable with our instrument. The TGA curve of Sr–TiO2 (Fig. 3.c in supplementary data) shows three weight loss phases. The first occurred between 30 and 150 °C with an endothermic peak in DTG curve. This loss was probably due to the removal of water and entrapped solvent in the pores of the material. The second occurred between 150 and 350 °C and was accompanied by an exothermic peak, due to the decomposition of unbound organic matter. The third weight loss phase was also accompanied by an exothermic peak that is potentially explained by the destruction of bound acetate groups. At 530 °C, another exothermic peak was observed and may result from the appearance of brookite phase detected in XRD analyses.
3.2.5 Textural characterization
The N2 adsorption/desorption isotherms obtained for the Sr–TiO2 and Al–TiO2 samples (presented in supplementary data Fig. 4) are classified as type I. The medium contains only saturated micropores for low values of p/p°. However, no adsorption occurs at higher values that would fill mesopores.
The N2 adsorption/desorption isotherms of P25 and Fe–TiO2 are classified as type IV with a very important loop of hysteresis that corresponds to the capillary condensation of the liquid nitrogen in the mesopores. H2 hysteresis was observed between the adsorption and desorption curves. These hysteresis loops indicate a nonuniform distribution of pore sizes and shapes in our solids. This lack of uniformity may be due to the blockade of pores by the formation of aggregates or bonds between particles [57]. Based on the N2 adsorption/desorption results, the surface increased with the addition of metallic salts (Table 3). The increase in SBET potentially resulted from the decrease in the nanoparticle size and pore volume.
N2 adsorption/desorption results for the samples.
| Sample | SBET (m2·g−1) | SLangmuir (m2·g−1) | SPores (m2.g−1) | VPores (cm3·g−1) | DPores (nm) | Nanoparticle size (nm) |
| Al–TiO2 | 304.70 | 482.24 | 35.94 | 0.022 | 2.46 | 19.69 |
| Sr–TiO2 | 238.82 | 372.26 | 11.00 | 0.006 | 2.28 | 25.12 |
| Fe–TiO2 | 200.96 | 345.39 | 142.04 | 0.109 | 3.07 | 29.85 |
| P25 | 54.62 | 123.26 | 43.71 | 0.181 | 2.82 | 35.32 |
3.3 Photocatalysis activity
The commercial material Degussa P25–TiO2 was used as a reference to evaluate the performance of prepared photocatalysts. The performance of the photocatalysts was evaluated upon UV and solar irradiation Fig. 8. After UV irradiation, the photodegradation rates were 76% for P25–TiO2, 70% for Al–TiO2, 64% for Sr–TiO2 and 54% for Fe–TiO2. The representation of Ln (C0/C) as a function of time (presented in supplementary data Fig. 5) produced affine lines. The correlation coefficient was very close to 1. Thus, the kinetics of the photocatalytic degradation of MB followed the pseudo-first order. The apparent constants Kapp of P25, Al–TiO2, Sr–TiO2 and Fe–TiO2 were 0.74·10−2, 0.61·10−2, 0.64·10−2 and 0.36·10−2 min−1 with R2 = 0.9893, 0.9812, 0.9771, and 0.9725, respectively (Table 4). The catalytic activity during the degradation of MB decreased in the following order: P25 > Al–TiO2 > Sr–TiO2 > Fe–TiO2. The transparent Al–TiO2 xerogel exhibited a rate of MB degradation similar to P25–TiO2. The higher photocatalytic efficiency of Al–TiO2 was attributed to the wide bandgap energy and the highest surface area. For Sr-doped TiO2, the decomposition of BM upon UV irradiation was less effective than P25. However, the degradation rate was still efficient. This difference was attributed to the inhibition of electron-hole recombination owing to the presence of Sr in the TiO2 lattice [58] and the large surface area of the catalyst. On the other hand, the doping of TiO2 by Sr ions did not decrease the catalytic activity, mainly because Sr functions as an electron trap and suppresses electron and hole recombination [17,58,59]. Fe-doped TiO2 was the weakest catalyst upon UV irradiation. A potential explanation for this finding is the low bandgap energy that coincides with visible light and not UV.
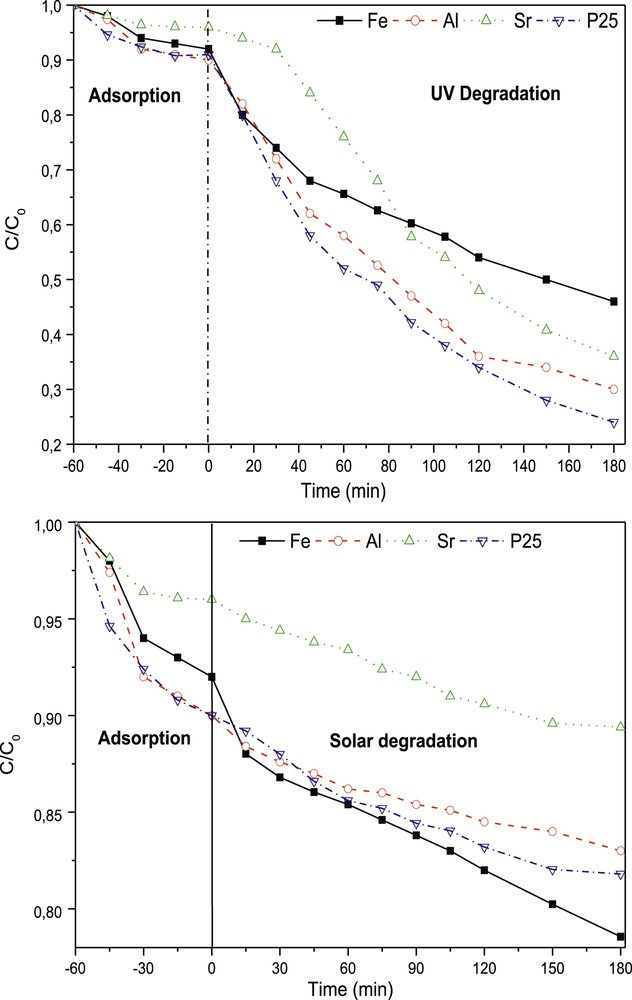
Variations in (C0/C) as a function of irradiation time.
Kinetics of photodegradation reactions.
| Catalyst | UV irradiation | Solar irradiation | ||
| Kapp × 10−2 (min−1) | R2 | Kapp × 10−3 (min−1) | R2 | |
| P25 | 0.74 | 0.9893 | 0.48 | 0.9975 |
| Al–TiO2 | 0.61 | 0.9812 | 0.64 | 0.9509 |
| Sr–TiO2 | 0.64 | 0.9771 | 0.42 | 0.9544 |
| Fe–TiO2 | 0.36 | 0.9725 | 0.7 | 0.9751 |
After solar irradiation, an analysis of the variation in MB concentration as function of irradiation time in the presence of different catalysts revealed that Fe-doped TiO2 was the most efficient catalyst, with a yield of degradation D% = 21.44% after 180 min. This result is consistent with the findings reported by L.L. Costa and A.G.S. Prado [59]. The redshift of the optical absorption spectrum of Fe-doped TiO2 showed a higher photoabsorption capacity than pure TiO2, which improved the photocatalytic activity. Fe3+ in the network functions as an electron-acceptor (Fe3+ Fe2+) and/or hole (Fe3+ Fe4+) facilitating the localization of the charge carriers and thus delaying the recombination of the carriers of the charge by trapping them at the dopant level, which forms energy levels close to the conduction or valence bands [60]. Therefore, Fe3+ doping of TiO2 might effectively retard the electron-hole recombination and increase the lifetime, thus improving the photocatalytic activity under solar irradiation. The pseudo-first-order fit of all degradation tests shown in Fig. 5 in supplementary data produced a correlation coefficient close to one in Table 4. Therefore, the kinetics of MB degradation under solar irradiation follow a pseudo-first-order reaction.
4 Conclusions
Based on the findings of the present study, TiO2-based xerogels are simply synthesized through a succession of hydrolysis and polycondensation reactions of titanium(IV) isopropoxide using the solgel process. Acetic acid was used as the catalyst to generate water through its esterification reaction with the solvent. The most transparent samples are obtained using ethanol as the solvent. According to the DRS analysis, samples are transparent in the visible region. A shift in the bandgap energy towards the visible region for Fe–TiO2 confirms the incorporation of iron into the anatase structure and reveals the potential of these solids to serve as photocatalysts upon solar irradiation. The bandgap energy decreases as a function of dopant (Fe < Sr < Al). XRD patterns only show the anatase structure for noncalcinated materials and for xerogels calcinated at 450 °C. For xerogels calcinated at 650 °C, characteristic peaks of rutile are present in all samples. The synthesized monoliths are mesoporous and have high surface areas. Upon UV irradiation, Al–TiO2 degrades 70% of MB after 180 min. This degradation rate is similar to P25. Fe–TiO2 exhibits greater performance in the solar degradation of MB, with a decomposition yield of 21.44% after 180 min. Theoretical fitting shows that kinetics of the studied decomposition of MB follows a pseudo-first-order model.
Acknowledgements
This study was financially supported by the Tunisian Ministry of Higher Education and Scientific Research and was performed in the Laboratory of Materials, Energy and Environment UR 14/ES 26, University of Gafsa, 2100, Gafsa, Tunisia. The RX analysis was performed at the research centre of the Phosphate Company of Gafsa.