


 CC-BY 4.0
1. Introduction
First described in 1928 by Raman and Krishnan [1] from which it gets its name and predicted theoretically by Smekal in 1923 [2], Raman spectroscopy is an optical spectroscopy which allows the vibrational signatures of probed compounds to be extracted from the scattered light upon illumination of a sample with a monochromatic excitation source (ultraviolet, visible or infrared laser Raman probe) [3, 4]. Raman spectroscopy constitutes a powerful non-destructive and label-free technique widely used for chemical analysis (solid, liquid, gas) that when combined with optical microscopy can provide chemical information at the sub-micrometer scale [5, 6].
As diagnostic tool in medicine, Raman spectroscopy was first applied to stone analysis in the early eighties [7, 8]. Then, it has been applied to complex biological samples, such as fluids [9, 10], cells [11, 12], minerals as physiological [13, 14, 15] and pathological calcifications [16, 17, 18] and tissues [19]. Such versatility explains the numerous applications of Raman spectroscopy in different specialties of medicine [20, 21, 22], among which are nephrology [23, 24, 25, 26, 27, 28, 29, 30], rheumatology [31, 32, 33], hematology [34, 35, 36], gastroenterology [37, 38] or endocrinology [39, 40]. Note that in vivo Raman experiments are also envisaged and proofs of concepts have already been demonstrated in a few domains of applications [41, 42, 43, 44].
The aim of this publication is to gather and present striking results related to pathological calcifications [16, 17, 45, 46, 47, 48, 49, 50, 51] and to introduce the most recent developments of Raman spectroscopy, opening new opportunities in this field of research. After a brief presentation of the underlying theoretical concepts associated with Raman spectroscopy and Raman instrumentation, the performance of the technique will be discussed relatively to the ones of mid-infrared vibrational spectroscopy also largely used in medicine. Then, a literature review focusing on pathological calcifications and featuring the most recent works will be presented.
2. Some important aspects regarding Raman spectroscopy
2.1. Notion of Raman shift
A Raman spectrum depicts the optical transitions between the various rotational–vibrational energy states of molecules, or crystallites and therefore gives access to the precise characterization of a material chemical composition [52, 53]. Raman spectra represent on the x-axis either the wavelength (𝜆: nm) or the energy (𝜈: wavenumber in inverse centimeter cm−1) associated with the optical transitions and on the y-axis their probability of occurrence (number of counts associated with the number of Raman photons reaching the photosensitive detector). Note that as Raman spectroscopy does not rely on light absorption but on inelastic light scattering, which is of higher or lower energy than the incident laser light, the energy of the transition on the abscissa, displayed as Raman shift, is calculated from the difference between the energy of the Raman laser probe 𝜈0 and the energy of the scattered light 𝜈𝜄:
| (1) |
2.2. Vibration modes in Raman and IR spectroscopy
The “Raman active” energy transitions observed on Raman spectra originate from a change in the polarizability of a molecular entity, i.e. the distortion of its electron cloud upon interaction with the incident light (strong oscillating electromagnetic field in the UV, visible, infrared energy domain). These transitions differ from the ones observed in IR spectroscopy based on the variation of the dipolar moment of the molecular entity. Both can be predicted from the symmetry of the molecular entity using mathematical symmetry operations (group theory). From a microscopic point of view, the energy transitions correspond to specific molecular distortions or vibration modes ( rotation) of molecular bounds (as-symmetrical stretching: 𝜈, bending: 𝛿, rocking: 𝜌, wagging: 𝜋, 𝜔 and twisting: 𝜏) triggered upon interaction with photons. Molecules with multiple elements of symmetry can show vibrational modes active both in Raman and in IR spectroscopies. For instance vibration modes and therefore energy transitions associated with specific chemical functional groups like P–O stretching of phosphate PO, C–O stretching of carbonate CO, S–O stretching of sulfate SO groups in organic or inorganic compounds, C–H and C–C stretching or bending in carbohydrate compounds, can be observed both in Raman and IR spectra and around similar energy values. Note however that polarized bonds like C–O, O–H produce strong intensity IR bands (large net dipole moment due to charge motion) but are weaker Raman scatterers since bond length changes consequent on vibrational motion only result in small additional polarization effects. Conversely more neutral bonds (C–C, C =C) are strong Raman scatterers (large changes in polarizability upon atom motions) but produce weaker intensity IR bands (small variation of dipole moment).
2.3. Notion of “virtual” state
In the framework of quantum mechanics, a molecular entity can be described as a sum of discrete accessible energy states upon interaction with photons. Depending on the energy of the incoming radiofrequency perturbation (UV–Vis, infrared), the molecular entities in their initial state will be promoted (excited) to various higher energy states (new ro–vibrational state in the same or different electronic state). As Raman spectroscopy can use energetic probes (UV or Vis), molecular entities can be, under specific conditions, promoted to a superior electronic excited state (Resonance Raman processes,) or in most common cases to a so-called “virtual” state (associated with distorted electron clouds), of which the very existence or physical meaning is still under debate in the community.
2.4. Stokes vs anti-Stokes, right or left?
Upon relaxation from the excited state, the molecular entity is downgraded to a lower energy state while emitting a Raman photon scattered statistically in all possible directions of space [54, 55]. The emitted photon can originate from a relaxation to an energy state higher than the initial state and is therefore of lower energy than the incident photon (“Stokes” photons associated with energy loss) or can be associated with a relaxation to a lower energy state than the initial one (“anti-Stokes” photons associated with energy gain). A same vibration mode will therefore produce both Stokes and “anti-Stokes” photons as depicted in Figures 1a and b. The Raman shifts (𝜈0–𝜈Stokes) and (𝜈0–𝜈anti‐Stokes) are the same in magnitude but of opposite sign and therefore appear on Raman spectra on each side of the Raman probe energy used as the zero energy reference. Raman peaks (bands) associated with Stokes and anti-Stokes photons correspond respectively to positive and negative Raman shifts energy (right and left sides of the spectrum respectively). Note that depending on the nature of laser line rejection filters used (long pass: “edge” filters or stop band: “notch” filters), either only Stokes or both Stokes and anti-Stokes parts of the spectrum can be exploitable as illustrated in Figure 1b. Different energy ranges are covered by the spectrometer (CCD detector/grating) depending on the Raman probe used as also shown in Figure 1b.
(a) Origin of the optical transitions behind elastic Rayleigh scattering, inelastic Stokes and anti-Stokes Raman scattering and Resonance Raman scattering. The difference in energy between the incident photons and the Raman photons (Raman shift) corresponds to the difference in energy of the different vibrational states otherwise accessible by InfraRed spectroscopy. (b) Raman spectra of cystine powder using various Raman probes 633 nm (red spectrum), 532 nm (green spectrum) and 785 nm (blue spectrum). The laser line rejection filter “band-stop notch” used in combination with the 633 nm Raman probe explains the discontinuity of the spectrum around 0 cm−1 (zero intensity) and the possibility to observe both anti-Stokes and Stokes main Raman bands of cystine (±500 cm−1). The long-pass rejection filter used for 532 and 785 nm Raman probes allows detection of Stokes bands only but at low energy at as close as 50 cm−1 to the laser line. Note also, the different energy ranges covered by the spectrometer (CCD detector/grating) at 785 nm and 532 nm (∼1500 cm−1 vs ∼3000 cm−1 on our equipment).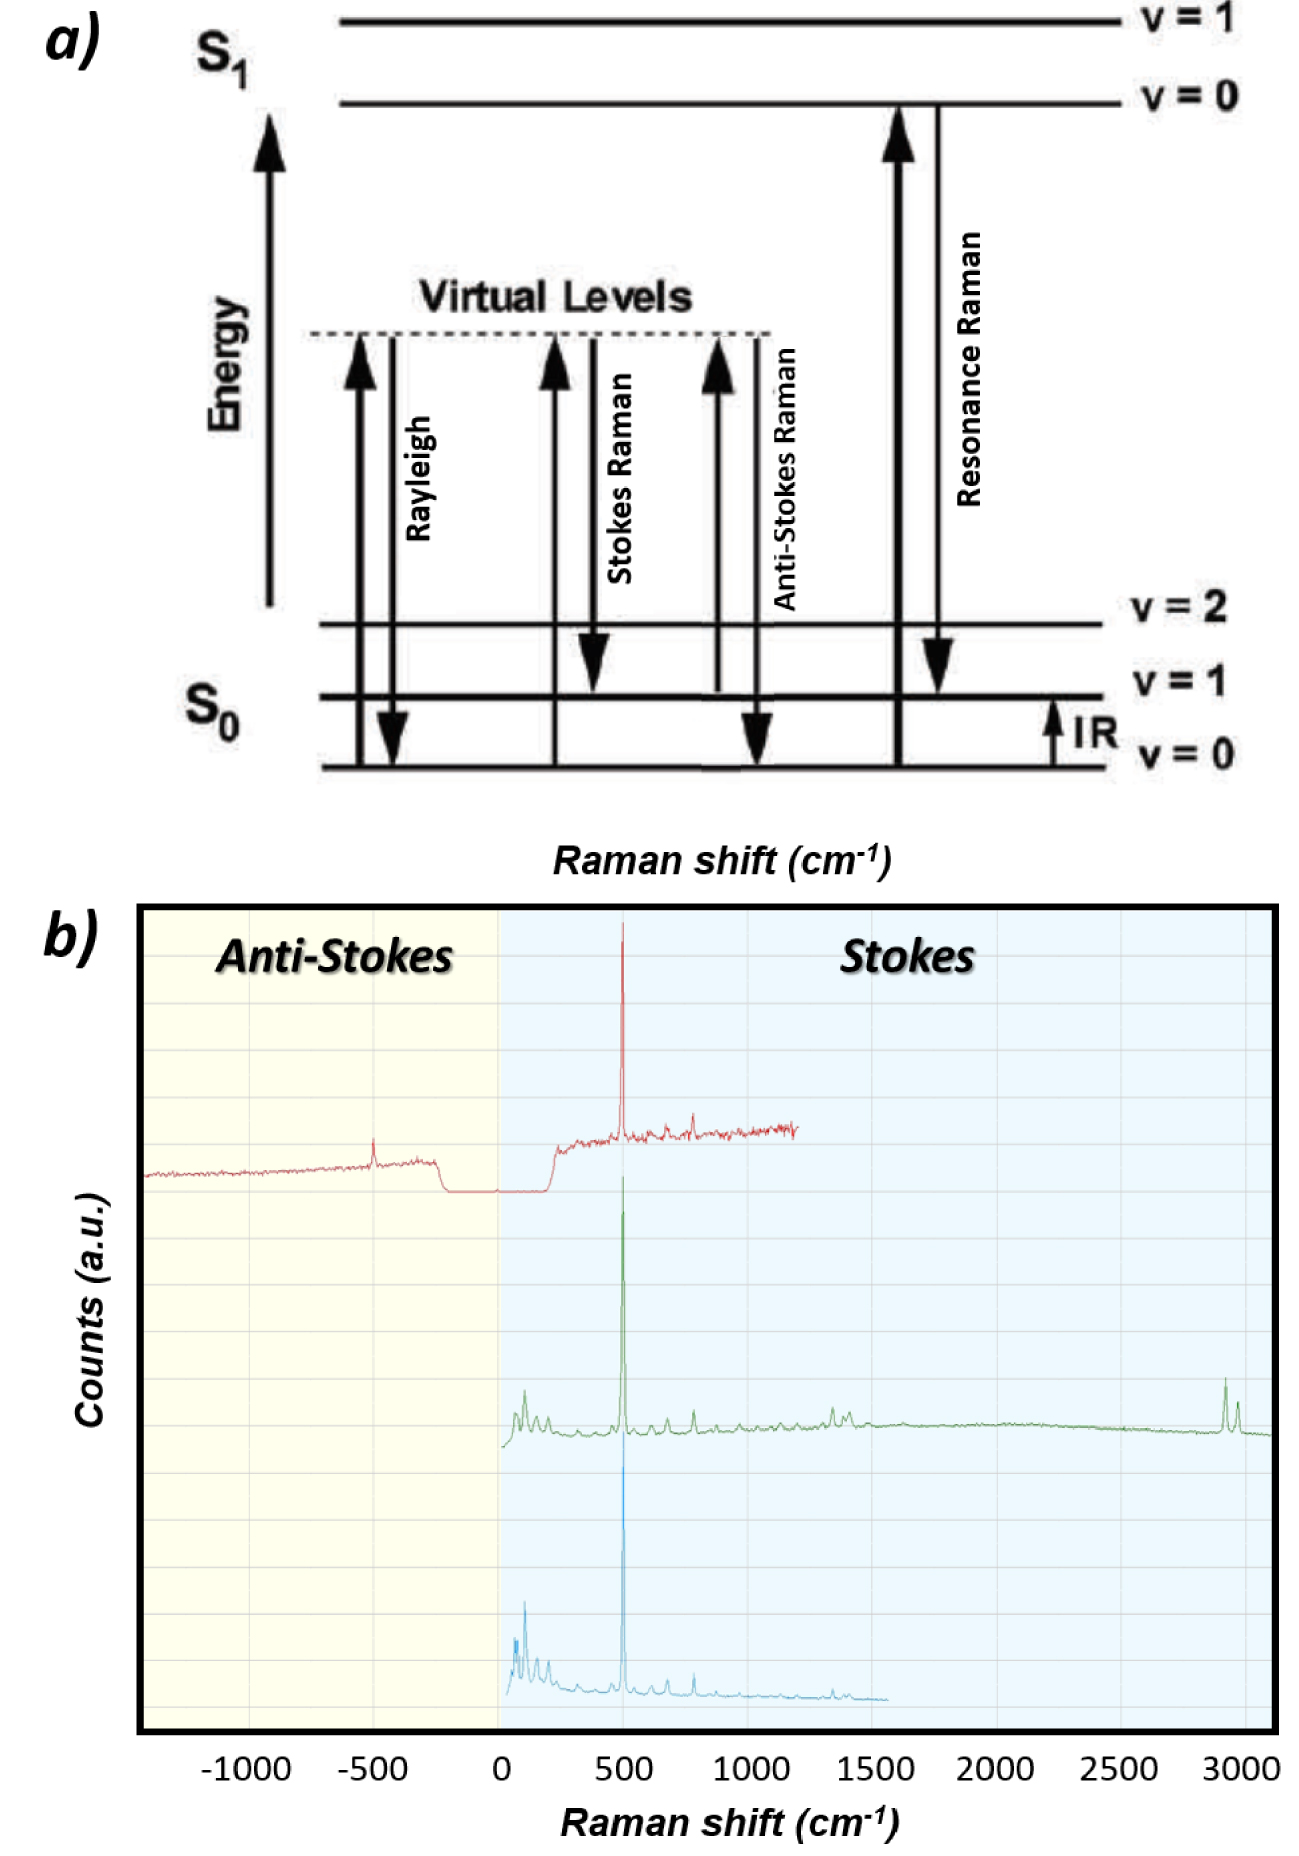
The intensity of the Raman bands associated with a specific vibration mode of the molecular entity is directly proportional to the probability of occurrence of the associated optical transition. This intensity will therefore increase with the number of irradiated entities (concentration in the volume of the sample irradiated) and with the number of incident photons (laser power per surface unit and time of exposure). Note that Raman bands have a characteristic Lorentzian shape (not Gaussian due to the vibrational population relaxation process) and can therefore be easily distinguished from artifacts on spectra (sharp peaks—“glitch”—due for instance to gamma rays hitting randomly the detector). As at room temperature, the population of molecular entities in energy states higher than the ground state is statistically low (Boltzmann distribution), anti-Stokes Raman bands are of lower intensity (zero at zero Kelvin) than the Stokes bands (see Figure 1b) and are therefore not exploited in most cases (except in Coherent anti-Stokes Raman Spectroscopy: CARS).
2.5. Raman efficiency
The Raman process giving rise to inelastically scattered photons (Stokes and anti-Stokes) is extremely inefficient (1 Raman photon 𝜈S or 𝜈A‐S for 107 incident/elastically scattered photon 𝜈0. This efficiency strongly depends on the nature of the compounds analyzed by Raman spectroscopy. Compounds with high “cross-section” for Raman scattering like carbonaceous materials have such high intensity Raman signature than even a single layer of carbon atoms (graphene) and can be easily detected. Most of the other compounds give weak intensity Raman signatures even under strong laser irradiation, which explains why IR spectroscopy was preferred for decades [56]. The cross-section for scattering (elastic and inelastic) depends on the excitation wavelength to the inverse fourth power [57]:
| (2) |
Influence of the laser source (Raman probe) used for Raman signal excitation on the scattering signal intensity: close to three orders of magnitude in Rayleigh and Raman intensities can be observed between deep UV (244 nm) and IR (1064 nm) excitations.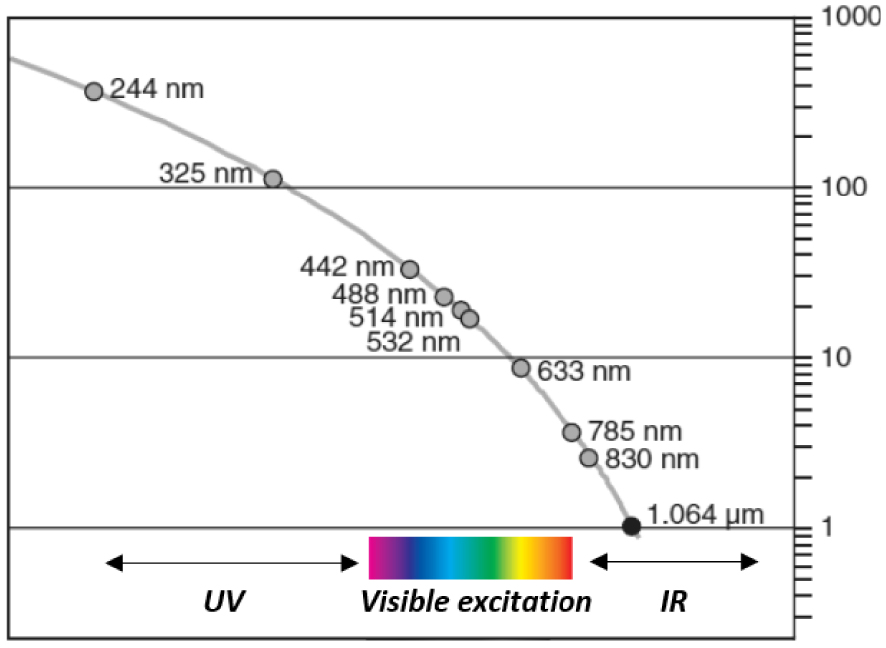
2.6. Some characteristics of Raman spectra
A typical Raman spectrum which covers the energy range 0–4000 cm (from metal oxides M–O vibrational modes at low wavenumbers to O–H stretching modes at high wavenumbers) corresponds to a short range of wavelength 𝜆 (nm), e.g. 30 nm apart from the laser line in deep UV (244 nm) vs ∼200 nm for a 633 nm laser line as illustrated on Figure 3. This has important implications on the lateral resolution of the analysis (see below). Moreover, because of the non-linearity between the wavelength associated with a specific transition and the calculated Raman shift, the characteristics of the excitation wavelength, of the spectrometer (diffraction grating, focal distance) and of the detector size affect considerably the achievable spectral range in cm−1 (decreases when 𝜆exc increases) and therefore the spectral resolutions (increases with 𝜆exc) as illustrated in Figure 1b.
Relation between the wavelength of Stokes Raman scattered photons and their Raman shift expressed as (𝜈0 −𝜈S), as a function of the laser excitation/Raman probe (see (1), with 𝜈0 the energy of the laser excitation and 𝜈S the energy of the scattered photons). The narrow wavelength range associated with a typical vibrational spectrum of 4000 cm−1 (30 nm for 244 nm excitation, ∼200 nm for 633 nm excitation) explains, for instance, the high lateral resolution of Raman imaging on the whole spectral range (4000 cm−1) contrary to infrared spectroscopy for which the wavelength range is typically 2.5–25 μm. As a result of the different energy ranges at 785 nm and 532 nm illustrated in Figure 1b (∼1500 cm−1 vs ∼3000 cm−1 on our equipment), the spectral resolution with 785 nm Raman probe is nearly twice that with 532 nm.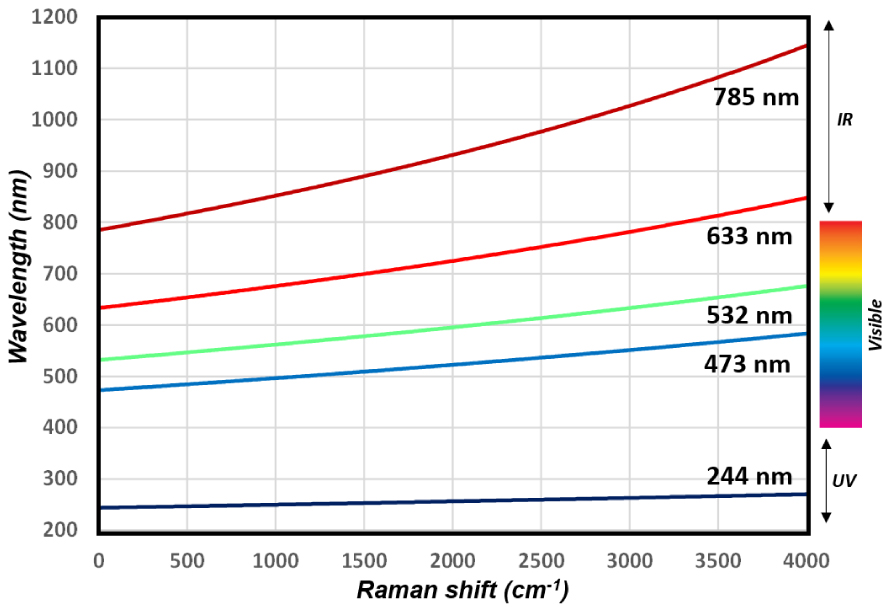
2.7. Confocal Raman microscopy
Raman spectroscopy can be coupled to optical microscopy and piezo stages offering high resolution compositional mapping capabilities (see setup in Figure 4). The lateral (in the XY sample plane) resolution achievable, i.e. the ability to distinguish two surface objects as separate entities, is diffraction limited (Abbe, 1873) and can be defined according to the Abbe, Rayleigh (1896) or Sparrow criteria as roughly half of the wavelength of illumination:
| (3) |
Design of a dispersive Raman confocal microscope (Image: Edinburgh Instruments) equipped with one or several monochromatic laser sources (Raman probe) with cleaning filters to narrow their spectral emission (bandpass filters and intensity attenuation filters not represented here), a rejection filter to suppress the dominant Rayleigh scattering (green beam), a confocal pinhole to selectively collect photons originating only from the sample focal plane (orange beam), a diffraction grating to spread the Raman photons of different energy (optical transition of the various molecular entities in the sample) on the detector (CCD camera).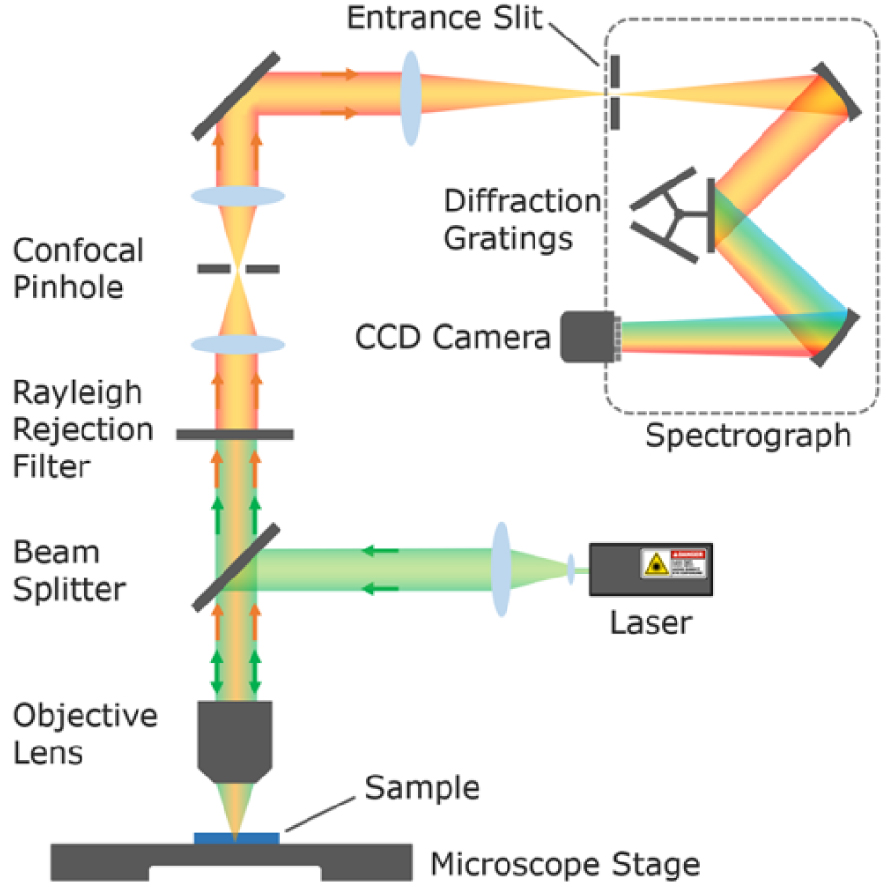
By placing a pinhole aperture (e.g. 2 × 2 blades perpendicular to one another) at the entrance of the spectrometer, it is possible to block the photons which do not originate from the focal plane on the sample (before and after), the so-called confocal Raman microscopy. By selecting objectives with low field depth (high NA objectives with large collection angle) and minimizing the pinhole size, the penetration depth of the analysis (depth resolution along the Z axis of the sample) can be reduced and the lateral resolution increased. Also the contribution of signal originating from the medium between the sample and the objective (atmosphere or liquid) can be minimized. Note that in such confocal configuration, the sensitivity of the analysis (Raman intensity) critically depends on the accuracy of the Raman probe focalization on the sample (and of the optical alignment). Proper focalization of the Raman probe can be difficult to achieve on rough and inhomogeneous samples, compromising the quality of compositional mapping. The depth resolution (Z axis) defined by Abbe is significantly lower than the lateral resolution, in the order of 1–2 μm depending on the wavelength of illumination:
| (4) |
With the development of laser sources with very narrow excitation, photosensitive detectors with high quantum efficiency (PMT, CCD) and high quality optical elements (mirrors, beams separators, filters and gratings), the possibility to couple Raman spectroscopy with highly resolved confocal optical microscopy and to work on high water-content samples (no water absorption using non-infrared laser sources), Raman spectroscopy/microscopy use has been booming in the last twenty years in the academic and industrial communities.
Such high depth resolution which allows the extraction of Raman signature at different focal planes is interesting for optical sectioning of samples. By combining translation stages with sub-micrometer step resolution and Z motion of the objective lens, three-dimensional (3D) sectioning of samples can be obtained. In medicine for instance, numerous studies have been led on skin because in vivo confocal Raman spectroscopy constitutes a non-invasive optical method resolution which allows the skin morphology to be visualized and (subsurface) structures in the skin to be targeted [59]. Without dissection, it is also possible to separate Raman signal originating from the inner layer of skin, namely the dermis, from the Raman signal coming from the outer layer, namely the epidermis, the axial resolution being of a few microns. Several studies dedicated to skin have explored vitiligo [59, 60, 61], atopic and psoriatic skin [62], basal cell carcinoma [63] or psoriasis inflammatory disease [64].
2.8. Fluorescence: the Ramanist’s enemy
As mentioned earlier, Raman spectroscopy can use energetic probes (UV or Vis) and excited molecular entities can therefore be promoted to a superior electronic state. Under such condition, relaxation can also occur through fluorescence emission, giving rise to bell-shaped background on the Stokes spectral side only of the Raman spectra, as the fluorescence photons are of lower energy than the excitation source. For samples with strong auto-fluorescence (case of many biological samples with protein matrix), the Raman signatures can be dominated or even totally masked by the fluorescence background, resulting in their impossible detection and analysis as illustrated in Figure 5.
Influence of the laser source (Raman probe) used for Raman signal excitation on the background signal intensity (fluorescence): the Raman band of a Whewellite kidney stone (highlighted in orange) can be clearly observed with near-infrared laser sources (785 nm) while for blue and green excitations the Raman signal is totally screened by the strong fluorescence signal of the sample [65].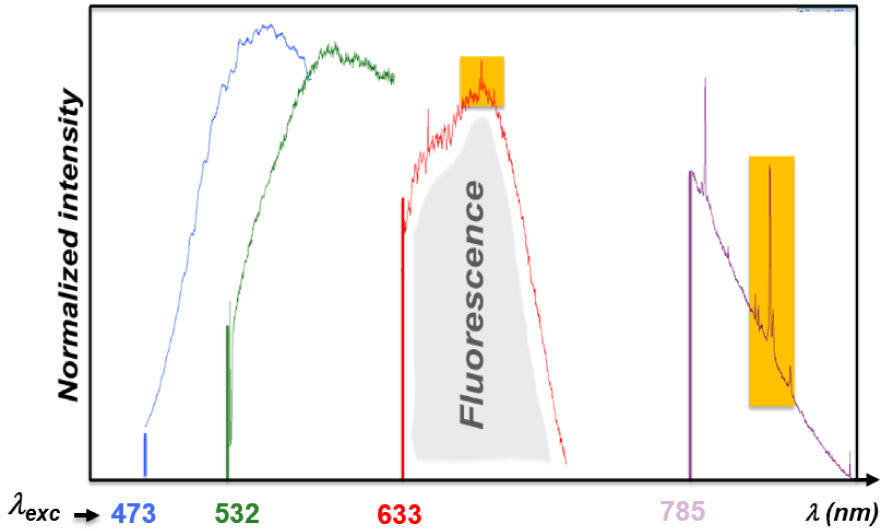
A first alternative is to use deep UV light sources (<250 nm), for which the emission of fluorescence does not interfere with the Raman signal detection, given that at such low wavelength, the two signals are well separated. As mentioned earlier, a typical Raman spectrum (4000 cm−1) in deep UV indeed occurs within only 30 nm apart from the laser line. The main disadvantages of UV illumination for bio-sample characterization are the dominating Raman signal from DNA related to the Raman resonant purine and pyrimidine bases of DNA at excitation wavelengths shorter than 300 nm, and the possible sample damages under such energetic beam (photo/thermal degradation).
A second alternative is to use near-infrared light sources (from 700 nm up to 1064 nm) which induce less sample damages, minimize fluorescence signal as fewer systems absorb in NIR as compared to the ones in visible, but with a price to pay, the dramatic loss of sensitivity (lower Raman efficiency and lower sensitivity of detector in the NIR region). With confocal Raman microscope, the depth of analysis, and therefore the fluorescence signal level, can be reduced by maximizing the confocality of the analysis.
Note that, rough and inhomogeneous (bio)samples can give rise to large backgrounds on Raman spectra, which are not only attributed to auto-fluorescence but also to photons entering the spectrometer in a non-collimated way (stray light possibly due to scattering effect of both the laser source and of the Raman signal [66]).
3. New developments related to Raman spectroscopy
As mentioned earlier, one main limitation associated with Raman spectroscopy is its lack of sensitivity, especially with Raman probes close to the near-infrared. The progress in the fundamental understanding of the Raman process and of its enhancement together with major instrumental technical developments have allowed significant increase of Raman spectroscopy sensitivity and diagnosis capabilities [67].
3.1. Dispersive Raman versus Fourier-transform Raman
One main strength of Raman spectroscopy lies in the fact that the chemical signature is contained in the scattered light (all the inelastic photons associated with the different molecular vibrations) collected upon irradiation with a monochromatic laser source. This means that the Raman spectrum (Raman intensity vs wavelength) can be reconstructed by dispersing the scattered light on a photodetector (e.g. a photomultiplier tube: PMT) using a rotating diffraction grating. Even better the Raman spectrum can be obtained instantly by dispersing the scattered light directly on the multiple photosensors of a Charge Coupled Device (CCD) detector, provided that the Raman signal is intense enough.
This contrasts with IR spectroscopy which uses a broadband excitation source (glowbar) and a signal interferometric detection. In such detection scheme, constructive and destructive interferences of the signal originating from the sample with a reference signal (the excitation source) are generated and modulated by controlling the optical path-length difference between the two signals (moving mirror). The resulting interferogram can be mathematically treated using a Fourier transform to extract the transmitted (or reflected) light intensity at each wavelength of excitation (FTIR). This detection method is extremely sensitive but requires relatively long signal collection times (signal accumulation at each mirror displacement step). Fourier-transform Raman spectroscopy also exists with 1064 nm excitation sources, allowing the collection of fluorescence-free Raman spectra for most of the compounds identified in abnormal deposits as published by Quy Dao and Daudon [68]. However this powerful solution requires long acquisition time to compensate for the very low scattering efficiency at such high wavelength and cannot be implemented on samples with high water content. FT-Raman has since been eclipsed by dispersive Raman system using near-infrared laser source (e.g. 785 nm) and detectors with better sensitivity in the near-IR region. In a recent publication, Yang et al. [69] have studied the laser wavelength dependence of background fluorescence in Raman spectroscopic analysis of synovial fluid from symptomatic joints. They show that both samples coming from asymptomatic and symptomatic patients had significant levels of fluorescence at excitation wavelengths below 700 nm, while experiments performed at 785 nm demonstrate sufficient sensitivity to identify crystals isolated from the synovial fluid.
Many biological samples show, upon illumination with visible laser light sources, strong auto-fluorescence background which tend to dominate/screen their Raman signature. FT-Raman using a monochromatic infrared laser source (1064 nm) has long been the technical solution to circumvent this problem, but is now overthrown by dispersive Raman systems (confocal microscopes) equipped with near-infrared monochromatic light sources (785 or 830 nm).
3.2. How to amplify the Raman signal?
Since the discovery in the 1970s of the properties of metal nanostructures upon illumination to amplify the Raman scattering intensity of objects in close proximity, a whole field of study named “enhanced Raman spectroscopy” (ERS) has opened up. Upon irradiation, the free electrons of the nanostructured metal oscillate at once (plasmon resonance) creating locally a strong enhancement of the electromagnetic field (EMF) and thereby of the incident and scattered light [5, 70]. As the Raman intensity depends on the EMF intensity at the power two, a power four can be expected for the Raman signal enhancement (IRaman ∝|EMF|2 ×|EMF|2). As plasmon absorption at a given wavelength relates directly to the band structure of the metal (and to its color), plasmon resonance and Raman signal enhancement can be observed on aluminum nanostructures upon UV irradiation (also 785 nm although this phenomenon is not currently explained), and upon visible illumination on silver, gold and copper [60]. The size and shape of the metal nanostructures determine the excitation wavelength giving rise to plasmon resonance and signal enhancement ranging from one to three orders of magnitude [71]. Materials to be analyzed can be deposited on a SERS active substrate (surface-enhanced Raman spectroscopy), alternatively colloidal gold nanoparticles coated or not with shells of insulating layers (SiO2, Al2O3: Shell Isolated Nanoparticles Raman Enhanced Spectroscopy SHINERS). Core–shell nanoparticles have been applied on biological systems, for instance Xu’s group utilized SHINERS technique to obtain fingerprint information and investigate the type II microcalcifications in breast tissues [72, 73]. They obtained a series of Raman and SHINERS spectra and detected in tissues Type II microcalcifications using statistical data processing (Multivariate analyses like Principal Component Analysis: PCA). This is the first report of SHINERS used in the diagnosis of breast cancer cells. Since this pioneering work, different reviews dedicated to the use of SERS and SHINERS for investigations in medicine have been published [74, 75, 76].
Another offshoot of ERS called Tip-Enhanced Raman Spectroscopy (TERS) uses Au or Ag tapered tips as scanning probes brought in close contact with the surface of interest [77, 78]. Illumination of the tip apex with a laser through a high-NA objective, generates localized surface plasmons (the so-called hotspot) creating a very strong EMF enhancement at the tip–sample junction and thereby a strong enhancement of the Raman signal of the objects below the tip. Note that the lateral resolution offered by TERS can reach upto a few nanometers in the ambient [79] whatever the chosen excitation wavelength, explaining its designation by nanoRaman; this overcoming of the diffraction limit barrier constitutes a major breakthrough as compared to classical microRaman experiments [80, 81, 82]. Although TERS was developed by the early 2000s, it remained at the conceptual stage for almost a decade, primarily because of the poor reproducibility in the manufacturing of TERS-active probes. TERS is currently booming and has already found numerous applications as the significant decrease in the spatial (lateral and depth) resolution offers new analytical opportunities, like nanoscale chemical analysis or imaging of biological species and structures without the need of chemical labeling. A few recent reviews have been dedicated to the topic [83, 84, 85, 86, 87, 88, 89, 90] reporting TERS analysis of nucleic acids (DNA, RNA) with direct sequencing [91], peptides and proteins, lipids and viruses, bacteria and cell membranes. The group of Lagugne-Labarthet [92] also studied the adsorption of phosphoprotein osteopontin (OPN) on calcium oxalate monohydrate (COM). They found preferential adsorption of OPN on certain COM crystal facets at the origin of inhibition of crystal growth, confirming previous work of Sheng et al. [93] based on SEM and AFM imaging methodology.
Raman signal enhancement techniques (SERS) introduced in the early 1970s have been largely used for the characterization of biological sample. An offshoot using nanoparticles (SHINERS) as signal amplifiers shows great promise for in vivo analyses. Its counterpart, TERS using metal nanoprobes, displays high sensitivity and provides chemical imaging with nanoscale lateral resolution, offering a new opportunity to localize pathological calcifications inside specific organites of cells.
In resonant Raman, by tuning the laser excitation to match an electronic transition of the molecular entity under scrutiny (see Figure 1), a coupling between electronic and vibrational transition occurs, leading to a strong enhancement of the Raman scattering (Resonance Raman: RR), up to 106 times. As visible excitation usually triggers strong fluorescence background especially for biological samples, UV or deep UV is proposed as an alternative. Resonant enhancement associated with TERS analysis enabled, for instance, the detection of cytochrome C in mitochondria [94].
3.3. Fluorescence rejection in time-resolved Raman
In order to investigate reaction mechanisms by capturing the chemical signature of short life time intermediates (radicals, excited states), time-resolved Raman spectroscopies, covering Femtosecond stimulated Raman (FSRS), Kerr-Gated Raman, Coherent-anti-Stokes Raman (CARS), have been developed [95]. The experimental setup combines pumps and probes spectroscopy (which involves two ultrafast laser beams, a pump beam to initialize the Raman transitions and a probe beam to stimulate the Raman transition) with highly efficient spectrometers, and highly sensitive high speed multichannel detectors. Such experimental configuration allows fluorescence-free Raman spectra to be collected with acquisition time ranging between microsecond to picosecond. The pioneering work of Weisberg and co-workers [96] was reported in 1976 and today time-resolved Raman spectroscopy constitutes a mature technique leading to numerous publications, most of them in physics. Note that ultrafast Raman spectroscopic techniques can be combined with the use of plasmonic substrates or scanning probes [97].
3.4. Raman implementation in vivo
Several technical solutions have been proposed to extract Raman signatures in vivo, including Transmission Raman (TRS) which is possible as Raman does not rely on photon absorption and as the light can spread randomly through thick samples. Spatially offset Raman spectroscopy (SORS) developed by Matousek et al. [98] as early as 2005 introduces a spatial separation between the laser excitation and Raman collection (note that TR can be seen as an extreme case of SORS: transmission SORS). SORS relies on the fact that deep penetrating photons tend to migrate laterally, away from the illumination source, while scattered photons (Raman) are less likely to do so when reaching the surface of the sample. TRS and SORS enable analyses through thick and turbid materials (containers, packaging) up to 5 cm in the absence of photon absorption with applications in security, food safety, pharmaceutics and medicine including transcutaneous analysis (diagnosis of osteoporosis, possible bone regrowth monitoring and breast cancer through the detection and distinction of benign or malignant microcalcifications) [99]. SORS can be implemented using optical fibers for both illumination and Raman signal collection. To maximize the collection efficiency and control the offset distance, optical fibers constituted of a central illumination fiber surrounded by multiple collection fibers (or inversely: inverted SORS) organized as a ring at a given offset distance from the central illumination point are often used. Implementation of SORS can be coupled to the use of SERS active gold nanoparticles in targeted tissues (SESORS).
The development of fiber optical Raman probes is crucial for clinical in vivo applications, their association with standard medical endoscopes for instance holds great promise for intra-operative medical diagnosis (lung, brain, digestive and urinary systems, breast cancer, cardiovascular diseases) [100]. The implementation of fiber-optic Raman probe is complex as silica-based optical fibers (core and cladding) generate a strong Raman signal which can screen the Raman signal of the sample. Excitation and signal detection/collections path are then usually separated enabling specific filtration at the distal fiber end, i.e. a narrow-band/short-pass filter to suppress the silica signal background on the excitation fiber and a long-pass filter at the collection entrance to avoid reentry of the laser light into the fiber. Addition of filters usually comes at a high price. Focusing lens can also be added to the design. The design (diameter) of the resulting probe mostly depends on the application, fiber bundle diameters as small as 1 mm in catheters have been reported to be developed to fit into the endoscopic channels of cystoscopes, colonoscopes; fiber optical Raman probes must in any case withstand repeated sterilization processes. Note that the association of endoscopic Raman probes and of SERS-active nanoparticles (120 nm diameter) functionalized with tumor-target contrast agents has been envisaged for the endoscopic detection of small polyps and flat lesions in the colon [101] with no clinical application up to date.
4. Selected applications of Raman spectroscopy
In the following paragraphs a selection of investigations performed on pathological calcifications developed in breast [102, 103, 104, 105, 106, 107, 108, 109, 110, 111, 112, 113], kidney [114, 115, 116, 117, 118, 119, 120, 121, 122, 123, 124, 125, 126, 127, 128, 129, 130, 131, 132, 133, 134, 135, 136, 137, 138, 139], gallbladder [140, 141, 142, 143, 144, 145, 146, 147, 148, 149], prostate [150, 151, 152, 153, 154, 155, 156, 157, 158, 159, 160, 161], skin [162, 163, 164, 165, 166, 167, 168], testicular microlithiasis [169, 170, 171, 172, 173, 174, 175, 176, 177, 178], atherosclerosis [179, 180, 181, 182, 183, 184, 185, 186, 187, 188, 189, 190, 191, 192, 193, 194, 195, 196] and cartilage [197, 198, 199, 200] are presented. Each section is associated with different organs and the related pathologies are preceded with some medical notions presented succinctly. The limitations and advantages of Raman spectroscopy are also discussed.
Left—MicroRaman mapping images of normal breast duct (A–C) with corresponding serial stained section (D). Each image reveals the contribution of a specific morphological element to the region under scrutiny (A) collagen; (B) cell cytoplasm; (C) cell nucleus. They have been produced by ordinary least-squares fitting of each data point in the image with the reference spectra presented to the right. Right—Reference spectra used in the morphological model of the breast: (A) cell cytoplasm; (B) cell nucleus; (C) fat; (D) 𝛽-carotene; (E) collagen; (F) calcium hydroxyapatite; (G) calcium oxalate; (H) cholesterol-like; (I) water. Reprint from Shafer-Peltier et al. [104].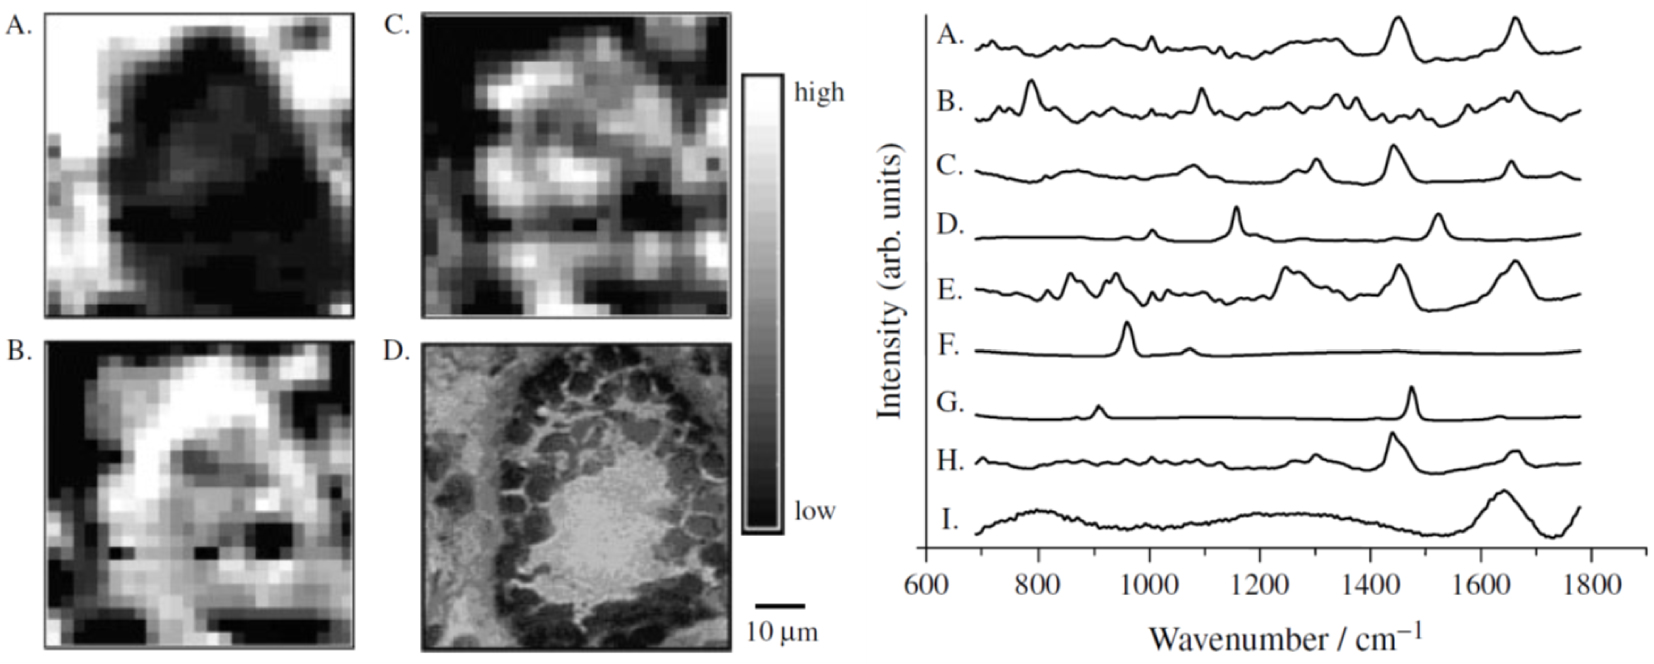
4.1. Breast calcifications
Breast cancer is the most common cancer in Europe [102]. It develops in breast tissues, in which it can be distinguished in the lobules or glands for milk production and ducts that connect the lobules to the nipple. Two types of breast calcifications have been described [103]. The first one composed of calcium oxalate dihydrate is always related to benign conditions [104]. In fact, calcium oxalate dihydrate is not stable and a phase transition may occur, leading to the formation of calcium oxalate monohydrate [105]. Note that such a chemical phase has not been reported in the literature to the best of our knowledge. The second one is composed of carbonated calcium phosphate apatite (or CA) and may be related to either benign or malignant conditions.
An example of Raman maps of a normal breast duct built by fitting of each image pixels with reference Raman spectra of different cell components is shown in Figure 6. The resulting images which the contrast depends on the different component abundance but also on their respective Raman cross-section correlate well with the tissue architecture.
Several works on breast calcifications also point out other chemical phases namely amorphous carbonated calcium phosphate [106] and whitlockite [107]. Recently, Vanna et al. [108] have suggested that the presence of whitlockite is a marker of benignity in benign breast microcalcifications. This is in contradiction with the work of Kunitake et al. [109] which reveals the presence of CA and spheroidal whitlockite particles in invasive cancer within a matrix containing spectroscopic signatures of collagen, non-collagen proteins, cholesterol, carotenoids, and DNA. It seems that the relationship between whitlockite and the severity of breast cancer is quite complex. As underlined by Scott et al. [110], the proportion of magnesium whitlockite increases from benign in situ carcinoma to invasive cancer. Finally, Tsolaki et al. [111] have recently established a strong correlation between the presence of whitlockite particles and the occurrence of malignant tumor by applying nanoanalytical methods to healthy, benign and malignant tumors’ breast tissue biopsies from patients.
The level of carbonate in apatite is another parameter which can be assessed through Raman spectroscopy [112, 113]. Baker et al. [113] report significant correlations between the carbonate composition level of microcalcification mainly composed of CA and pathology grades namely benign, in situ carcinoma and invasive carcinoma. We have also estimated the carbonate content of CA calcifications through 𝜇FTIR spectroscopy [106]. Thanks to the micrometer size of the probe, the data show that the chemical compositions as well as the carbonate level are very inhomogeneous in the case of ductal carcinoma in situ. More precisely, through a precise analysis of the FTIR spectrum, we established that the proportion of amorphous carbonated calcium phosphate as well as the carbonation rate vary from the center to the edge of a large (almost 1 mm) calcification.
4.2. Kidney stones and kidney biopsies
Raman spectroscopy has long been used to determine the chemical composition of kidney stones. Almost forty years ago, Daudon et al. [114] published a study which discussed the advantages and the limitations of this spectroscopy. These authors underlined the fact that Raman, at the opposite of FTIR spectroscopy, allows the characterization of micron-sized crystals. Since that pioneering work, and thanks to the development of commercial Raman microscope setups, many scholars have studied kidney stones by Raman spectroscopy [114, 115, 116, 117, 118, 119, 120, 121, 122, 123, 124, 125, 126, 127]. One example is given in Figure 7. Also, several researchers have shown that it is possible now to predict Raman vibrations from the crystallographic structure [128, 129], therefore easing the interpretation of Raman signatures.
Composition mapping of sliced and milled kidney stone—Left: Raman intensity mapping (step size: 50 μm) of (A) calcium oxalate dihydrate (COD: single Raman band at 1475 cm−1), (B) calcium oxalate monohydrate (COM: double Raman band at 1461 and 1487 cm−1) and (C) apatite (964 cm−1) and their corresponding Raman spectra (right), revealing COD within the peripheral spikes of the stone and COM within its center. The yellow to dark blue scale represents respectively the high density of a given component or its absence. Reprint from Castiglione et al. [125].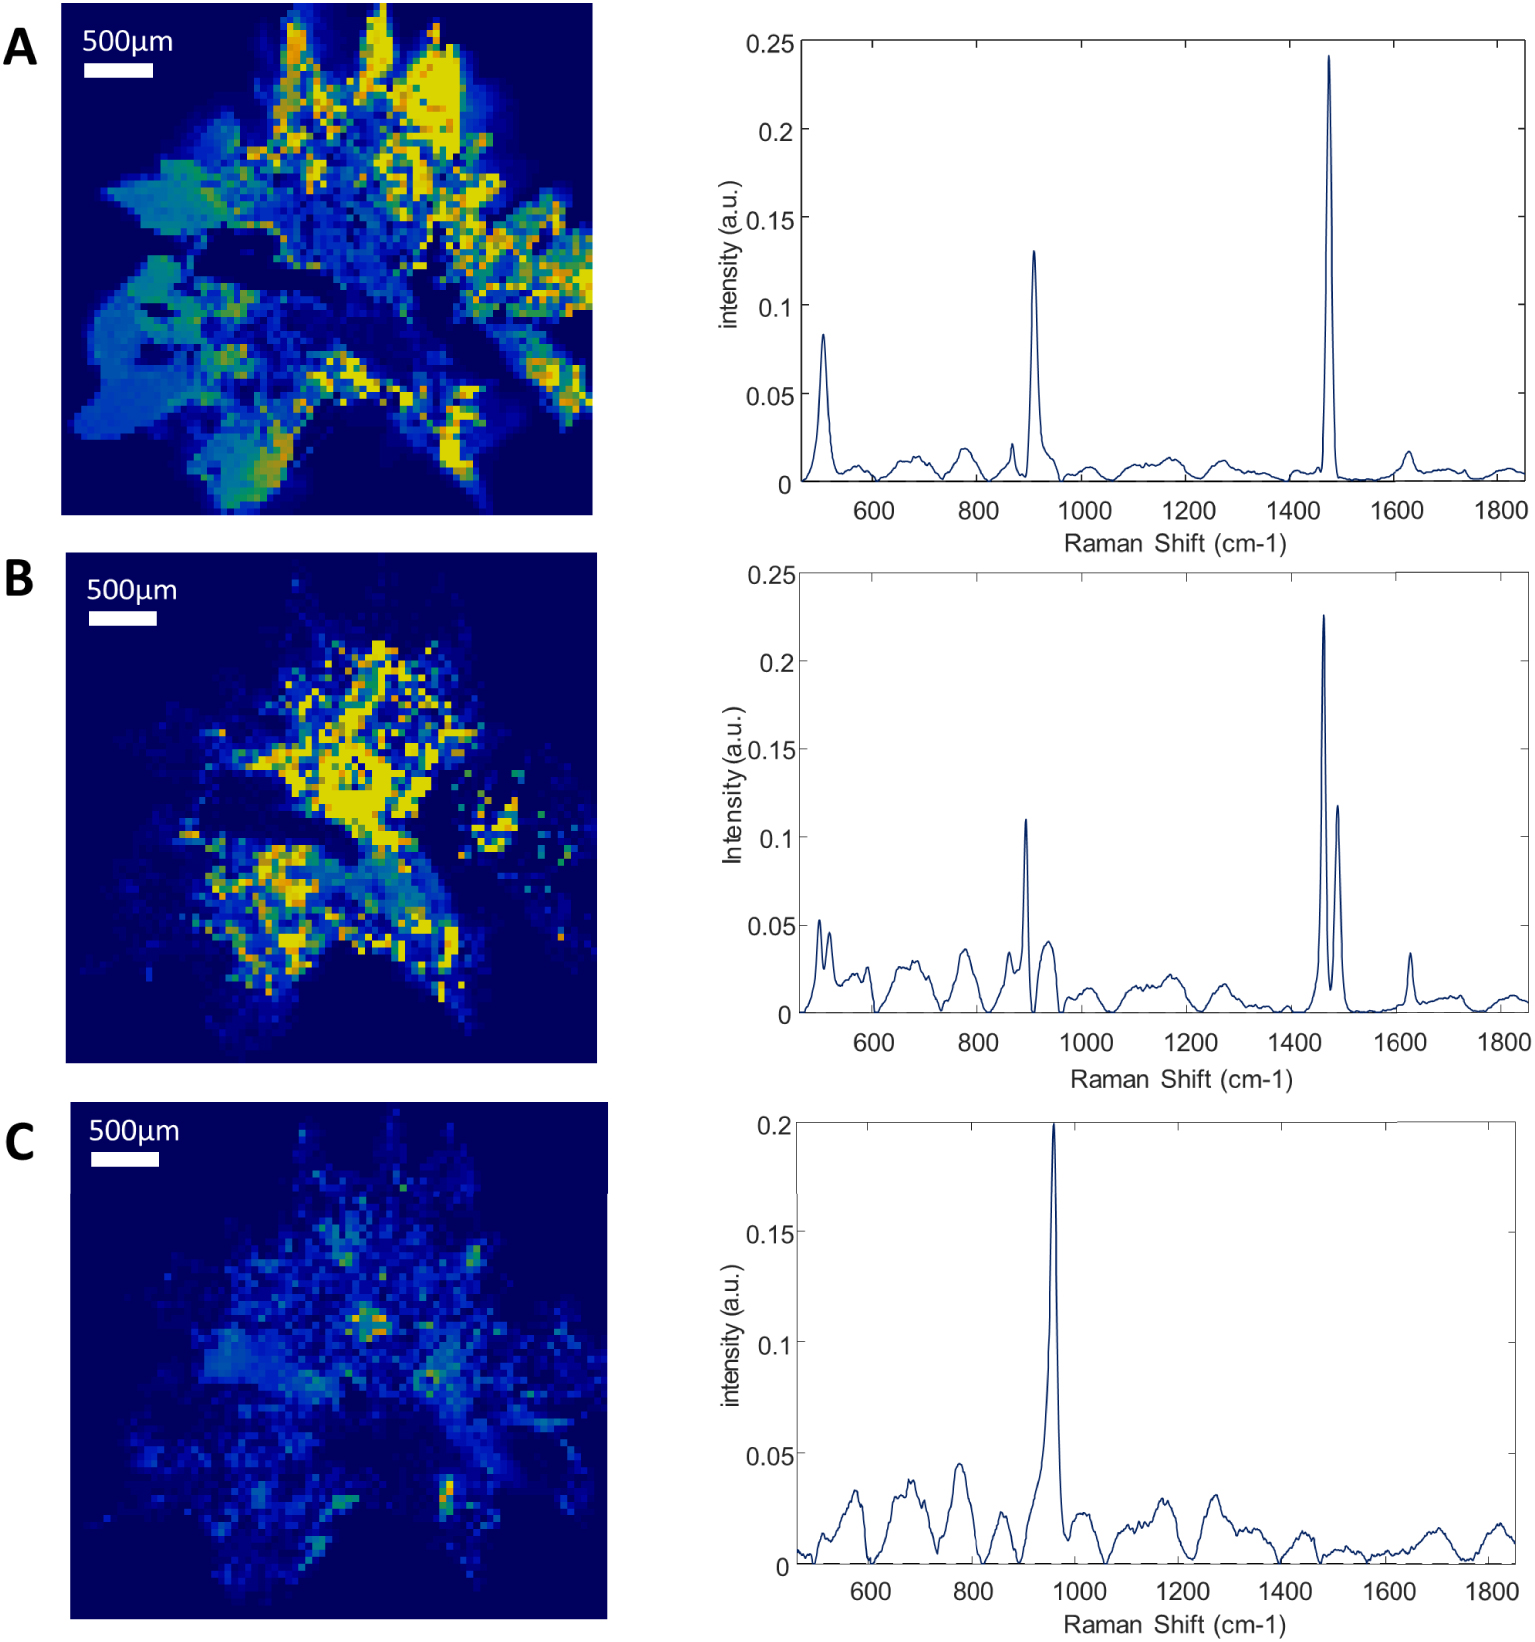
Among the different investigations dedicated to kidney stones, Carmona et al. [116] have extended the application of Raman spectroscopy of human kidney stones to urinary calculi from canine, feline, and equine animal species. More recently, Cui et al. [126] have collected 135 kidney stones and used these data to test a variety of machine learning models to establish a kidney stone classification. At this point, we must recall that the chemical composition is not the only parameter to establish a significant link with the etiology. The morphology of the calculi at the macrometer and micrometer scale is also of relevant importance [130, 131, 132, 133]. The formation of calcium oxalate monohydrate KS can be related for instance to either a severe genetic disease, namely primary hyperoxaluria or a dietary disorder [134, 135].
Regarding the comparison between 𝜇FTIR and Raman spectroscopy, Chang et al. [124] underline the possibility to analyze the stone composition extracted from urine spectroscopy analysis. This experimental configuration developed by Chang offers the opportunity to characterize micrometer scale stones in urine through Raman spectroscopy. More recently, Frochot et al. revealed the presence of several calcium carbonate polymorphs, including the rare vaterite form, in urine sediments of patients [18] following vegetable-rich diets (see Figure 8).
Crystalluria—(a) Optical micrograph (magnification × 100) of urinary sediments, (b) typical Raman spectra of the different variants of calcium carbonate crystals vaterite (daisy-like crystals) and aragonite (sticks and needles) found in urine of patients. A possible association with a diet rich in vegetables has been hypothesized for some subjects whose urine contained daisy-like crystals. Reprint from Frochot et al. [18].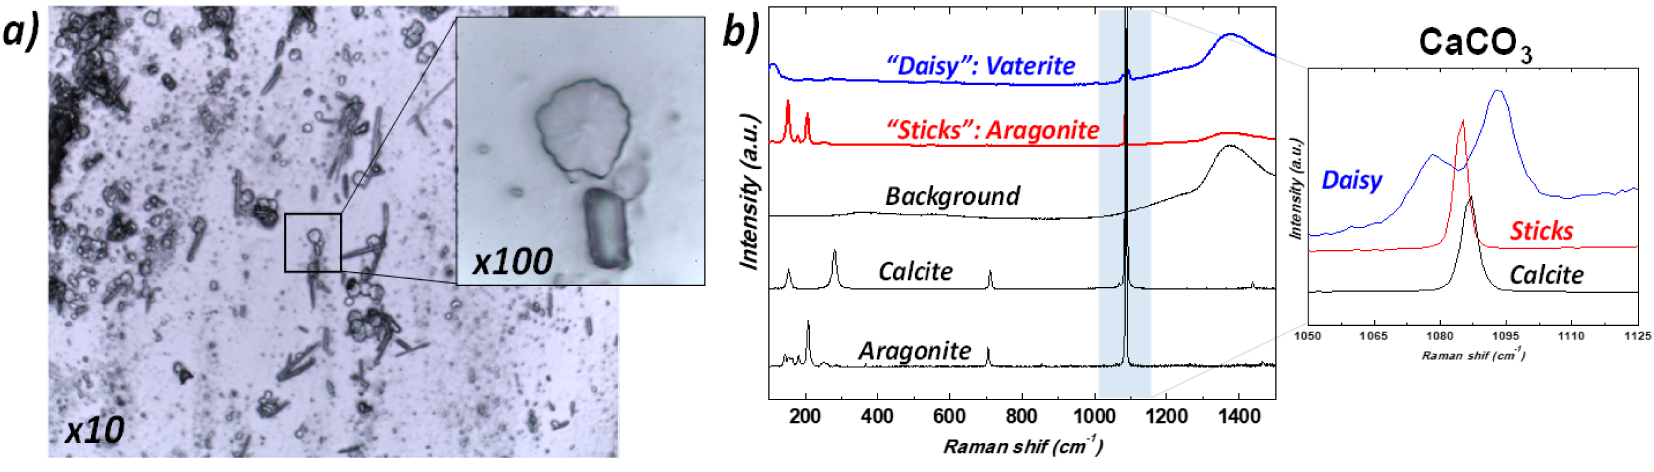
Finally, we would like to emphasize that Raman spectroscopy can be applied to kidney biopsies and soft tissue biopsies in general [136, 137, 138, 139]. Lloyd et al. [136] have for instance considered a severe pathology, namely calciphylaxis, generally seen in patients with kidney failure and which induces the pathogenesis of calcifications in different soft tissues. Their analysis of Raman spectra show that abnormal deposits present in tissues were consistently made of CA. From an experimental point of view [139], we have tried to develop specific supports for kidney biopsy on which a set of characterization techniques namely Raman, 𝜇FTIR spectroscopies as well as scanning electron microscopy and UV spectroscopy can be implemented.
4.3. Gallstones
Most of the papers dedicated to gallstones focus on their chemical composition. Zheng et al. [140] consider three parts, namely the surface of the stone, the subsurface interior, and the center of the stone. Analysis of the Raman spectra shows that these three parts contain bilirubin and that cholesterol was present only at the outer surface of the stone. Some authors underline the presence of other chemical compounds. In the publication of Iordanidis et al. [141] and of Stringer et al. [142], the presence of calcium carbonate has been also pointed out. Finally, other calcium salts namely calcium bilirubinate as well as calcium palmitate have been detected by Kaufman et al. [143].
Regarding the formation of gallstone, as noticed by Bouchier [144] overproduction of cholesterol by the liver is the major metabolic precedent of cholesterol gallstones. Such overproduction of cholesterol is related to obesity, drugs, or other factors. The role of bacteria in the formation of gallstones has been discussed since about forty years [145, 146, 147]. Beta-glucuronidase of bacteria are responsible for the formation of calcium bilirubinate stones through the hydrolysis of bilirubin glucuronide to free bilirubin, which is insoluble in water [148]. Note that Hazrah et al. [149] underline the fact that gallstones from most patients contain live bacteria with the potential to cause infective complications. These data strongly suggest that several mechanisms may be involved in stone formation and that, as reported for kidney stones, an accurate identification of crystalline phases is needed to help the physician identify the cause for the formation of these stones.
4.4. Prostate tissue and prostatic stones
The main type of surgery for prostate cancer is a radical prostatectomy [150]. Such surgical procedure leads to the observation of prostatic calculi which are a very common finding. Almost 99% of surgically removed prostates contain stones which often occur in middle-aged and old men without causing any specific symptoms. These concretions are generally considered clinically insignificant and therefore, only a few papers have investigated these calcifications [151, 152, 153, 154, 155]. Sfanos et al. [151] have identified several chemical compounds in prostatic calculi namely calcium phosphate, CA and calcium oxalate monohydrate. Dessombz et al. [152, 153] have also underlined the presence of brushite (CaHPO4 ⋅ 2H2O), amorphous carbonated calcium phosphate, calcium oxalate dihydrate, octacalcium phosphate pentahydrate (Ca8H2(PO4)6 ⋅ 5H2O) and whitlockite. Recently, Hsu et al. [154] have proposed a portable fiber-optic Raman spectroscope for fast chemical analysis of prostatic stones. Such experimental device has identified the different chemical phases previously reported. Moreover, Kontoyannis et al. [155] have used Raman spectroscopy to identify the chemical compounds present on prostatic stent.
Another research field based on Raman spectroscopy which is very exciting is related to the diagnosis of prostate cancer [156, 157, 158, 159, 160]. For example, it is worthwhile to underline the work of Chen et al. [161]. In that publication, the authors use SERS to point out prostate cancer in patients through the detection of a prostate-specific antigen level of 4–10 ng/mL present in blood serum. Such procedure avoids the biopsy prostate operation.
4.5. Skin
As we have seen previously, Raman spectroscopy offers the possibility to determine in vivo the chemical composition of specific area. This peculiar property has been used in numerous investigations for very different purposes like the penetration of drugs into the skin to the study of skin cancer [162, 163, 164, 165].
Like for other soft tissues, the Raman spectrum of skin is dominated by the vibrational bands of its structural proteins, amino acids and lipids [166]. Such Raman spectra thus contain numerous bands related to the different molecular groups present in skin. For example, in the stratum corneum, we can quote cysteine, tryptophan, hydroxyproline, phenylalanine, etc. It is thus possible to extract from the analysis of Raman spectrum different chemical modifications of the skin. Changes in diseased tissue are driven by changes in cellular biochemistry. For example, the results gathered by Santos et al. [167] show that the Raman bands between 2840 and 2930 cm−1 have increased intensity for melanoma when compared to benign melanocytic lesions, suggesting an increase in lipid content in melanoma.
Another health problem regarding skin is related to tattoos. Several investigations through Raman spectroscopy have been performed [168, 169, 170, 171]. Yakes et al. [168] have created a spectral library of the pigments for each laser wavelength. Such library is proposed to help the identification of all the pigments made by the different manufacturers. Indeed, Darvin et al. [169] have identified through Raman spectroscopy tattoo ink pigments in vivo and their depth dependence in human tattooed skin confirming their presence in the papillary and reticular dermis. Such approach is of primary importance because different pathologies are linked to skin tattoos, such as allergic reactions [170] and cancer (keratoacanthoma) [171]. In our work, we underlined the presence of the same red azo pigment (PR170) in all three keratoacanthoma cases, consistently associated with metal oxide. Generation of primary aromatic amines from azo pigments such as PR170 in humans as the consequence of enzymatic activity, thermal decomposition, or photodegradation after UV light exposure is suspected to be at the origin of the observed cancers [171].
4.6. Testicular microlithiasis
During ultrasonographic investigation of the testis, it is possible to detect the presence of multiple tiny calcifications. Such testicular microlithiasis (TM) appears as 1- to 3-mm-sized multiple foci within the parenchyma of the testis [172, 173, 174]. In a recent epidemiological study, Peterson et al. [175] indicate that testicular microlithiasis occurs in more than 5% of healthy young men. The conclusion of their study indicates that testicular microlithiasis is a common finding in asymptomatic men that may not be related to testicular cancer.
According to Renshaw [176], two types of calcifications exist consisting either of amorphous calcific debris or laminated calcifications. Regarding the chemical characterization of such abnormal deposits, we can quote the work of Smith et al. [177]. These authors have evaluated the use of percutaneous testicular sperm aspiration in the assessment of azoospermia and its association with seminiferous tubule microliths. To obtain the chemical composition of the microliths, X-ray diffraction experiments have been performed. The position of the diffraction peaks is in line with those corresponding of hydroxyapatite. Unfortunately, the width of the diffraction peaks was not measured. Such a parameter may give information regarding the size and the morphology of the chemical crystal phase.
More recently, De Jong et al. [178] have characterized microliths found in different types of benign and malignant gonadal pathologies through Raman spectroscopy. The precise analysis of the data underlines in the chemical composition the presence of calcium phosphate apatite. Also, these authors have noticed the presence of glycogen surrounding the microliths located in each testicular sample adjacent to testicular germ cell tumors and carcinoma in situ as well as gonadoblastoma.
4.7. Atherosclerosis
Cardiovascular disease is now a leading cause of disability and premature mortality globally [179]. Atherosclerosis constitutes the main pathological process of most cardiovascular diseases. As underlined by Hong [180], atherosclerosis can be observed in young people, remain latent and asymptomatic for long periods and then may progress into its advanced stages. The fact that patients with unstable plaques are at great risk for a sudden heart attack (i.e. myocardial infarction) when a plaque suddenly ruptures has motivated numerous investigations (see for example [181, 182, 183]).
Regarding the plaque evolution, three states can be distinguished [184] namely fibrolipid plaques, calcified and ossified plaques, and vulnerable atherosclerotic plaques. These authors have observed a clear correlation between the Raman spectra of plaques in the aortic tunica intimal wall of a human corpse and three states of plaque evolution. More precisely, in the case of highly calcified deposits on the atherosclerotic plaques and ossified lesion, they have measured a sharp peak at 964 cm−1 in the Raman spectra which corresponds to the totally symmetric 𝜈1 stretch of engaged in CA. In Figure 9, Buschman et al. [185] show clearly that it is possible to discriminate different elements of coronary artery morphologic structures with Raman spectroscopy.
Raman spectra of morphologic structures commonly observed in human atherosclerotic coronary artery used as references to assess lesions, plaque instability and disease progression, possibly in vivo using fiber-optic probes. Reprint from Buschman et al. [185].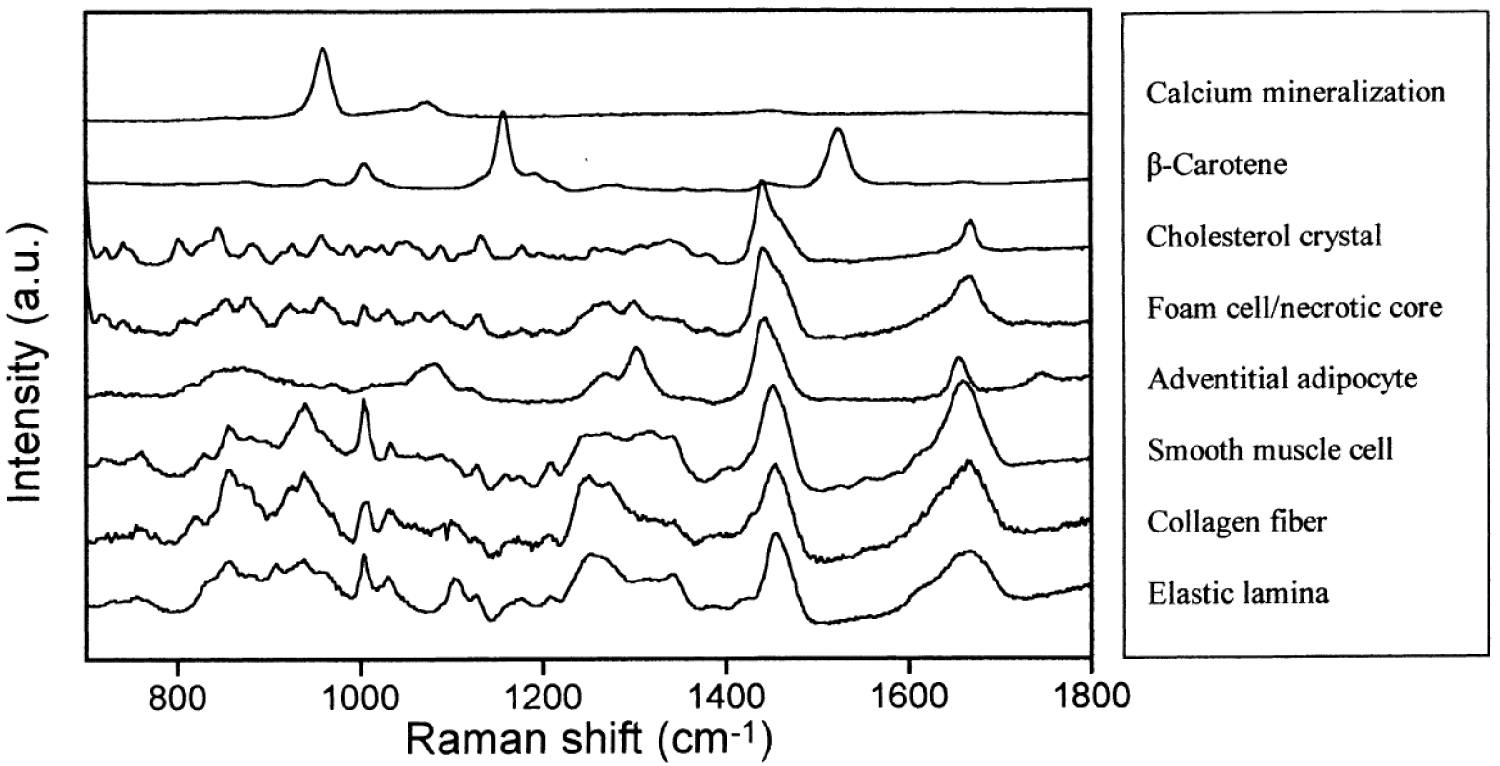
Several publications have already identified this chemical compound in atherosclerotic plaques [186, 187, 188, 189, 190]. Generally, this compound coexists with its amorphous precursor, amorphous calcium phosphate hydroxyapatite and it is worth mentioning that the totally symmetric 𝜈1 stretch constitutes an interesting indicator of the degree of crystallinity. At 955 cm−1, this structure is associated with an amorphous highly carbonated bone. At 963 cm−1 it corresponds to a more ordered non-carbonated phase [191, 192]. Other chemical phases have been identified namely, whitlockite, calcium carbonate, calcium oxalate (in coronary artery calcification in dialysis patients) [193], calcium phosphate and calcium pyrophosphate (Ca2P2O7) [194].
Using FTIR spectroscopy, Coscas et al. [195] have demonstrated that free DNA could be involved in arterial calcification formation by precipitating calcium phosphate apatite crystals in the vessel wall. Moreover, bundles of faceted microrods inserted into the surface of the vessel have been found at the outset of the calcification formation as suggested by Dorfmüller et al. [196].
(A) A schematic representation of the human osteochondral junction highlighting the different regions where multiple Raman microspectroscopic measurements for statistical processing (Principal Component Analysis: PCA) have been made. The measurement step size for the first region (60 μm × 60 μm) where the tidemark is located is 1 μm, a step size of 3 μm was used for all other regions (each region: 60 μm × 90 μm). (B) Mean baseline-corrected vector-normalized Raman spectra (reproduced with 10 principal components) from the deep articular cartilage, calcified cartilage and subchondral bone plate, respectively. The major mineral compounds phosphate and carbonate are annotated with red labels, and the organic counterparts with green labels. Reprinted from Gupta et al. [20].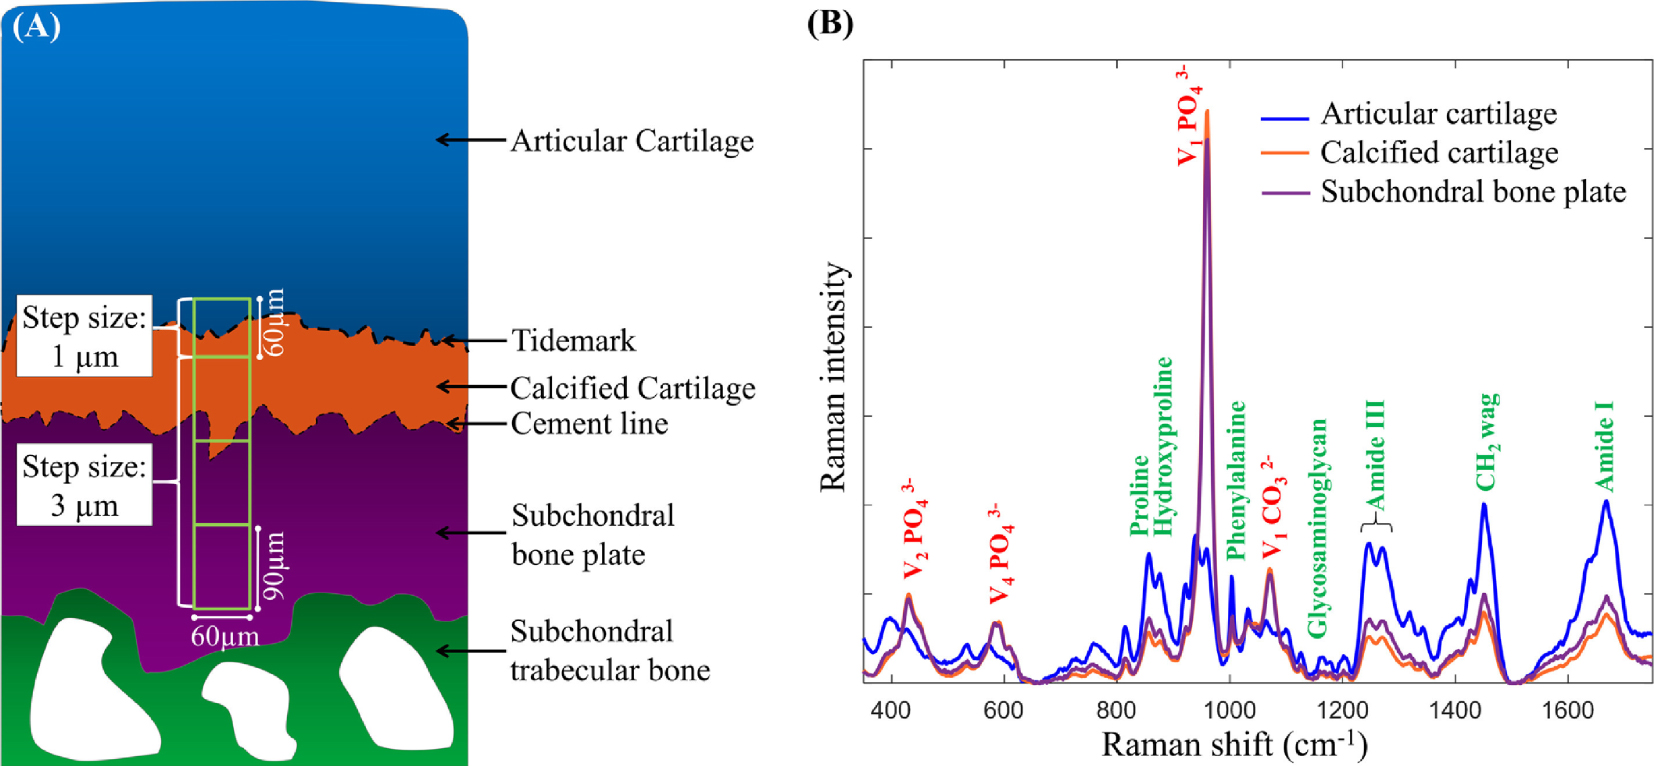
4.8. Cartilage
Regarding cartilage, several investigations attest to the accuracy of Raman spectroscopic imaging measurements to gather information regarding the spatial distribution of biochemical components in a biological tissue [18, 197, 198]. Among them, Albro et al. [197] as well as Bergholt et al. [198] show that Raman spectroscopic imaging can be used to assess the degree of heterogeneities in engineered tissues and their depth dependence. Such information is of prime importance to assess the success of tissue growth strategies. Regarding pathological calcifications, Gupta et al. [20] have analyzed the spatial composition of mineralized osteochondral tissues, i.e. calcified cartilage (CC) and subchondral bone plate (SBP) from unfixed, hydrated specimens. Figure 10 shows that the size of the probe allows a detailed description of the biochemistry related to the tidemark. Among their results, these authors clearly show that in early osteoarthritis, the mineralization tends to increase, and the mineral contains fewer carbonate substitutions.
Another interesting point on cartilage which has been investigated by Fields et al. [199] concerns the high temperature behavior of collagen and collagenous tissue, which is important for surgical procedures and biomaterials. Their Raman experiments reveal the presence of bound water within the collagen component of connective tissue even after freeze-drying and its role in denaturation that is accompanied by or perhaps preceded with breakdown of the primary polypeptide structure. Finally, Shaikh et al. [200] underlines the fact that Raman spectroscopy is able to provide biochemical details regarding potential for scoring the severity of cartilage lesions, which could be useful in determining the optimal treatment strategy during cartilage repair surgery.
5. Conclusion
Although Raman spectroscopy is still scarcely used in the medical community, all the examples shown in this review, taken mostly from recent literature, clearly demonstrate that Raman spectroscopy is a unique diagnostic tool which gives valuable information to the clinician in various medical specialties encompassing breast cancer, nephrology, cardiology and dermatology without much difficulties in implementation. With the development of fiber optical probes integrating spectroscopic analysis (Raman but also fluorescence multimodal probes) in addition to classical imaging and treatment (i.e. laser lithotripsy), great diagnostic perspectives can be anticipated per-operating or in vivo.
Acknowledgments
This work was supported by the Physics and Chemistry Institutes of Centre National de la Recherche Scientifique and by contracts ANR-09-BLAN-0120-02, ANR-12-BS080022, ANR-13-JSV-10010-01, convergence UPMC CVG1205 and CORDDIM-2013-COD130042.