


 CC-BY 4.0
1. Introduction
Urinary stone disease is a common condition, and its prevalence is increasing worldwide. Current incidence varies among different countries from 1% to 20% and can constitute major costs for health care systems as well as significantly decrease the quality of life for people with the disease [1, 2]. Early diagnosis could aid in prescribing treatment that prevents urinary stone growth and avoid more expensive and, in severe cases, invasive stone removal procedures [3].
Urinary stone formation processes are believed to be caused by urinary saturation with typical urinary stone forming materials such as calcium oxalate, uric acid, various urates, calcium phosphates, amorphous phosphates, and magnesium ammonium phosphate hexahydrate (struvite). This leads to formation of urinary deposits (or sediments) that are indicative of urolithiasis [4, 5, 6]. Less commonly, urinary deposits can also be constituted from cystine [7], various lipids [8], and metabolites of some drugs [9, 10] that contribute to the stone formation processes. Qualitative chemical analysis of chemical composition of urinary sediments plays an important role in taking early preventive measures to stop urinary stones from forming or growing [4, 6, 11]. Such analysis is usually challenging because of their small size, brittleness and inhomogeneity [12]. Optical microscopy is currently considered the gold standard for this purpose, and it is the only method used in clinical practice [10, 13]. Visual morphology-based inspection of urinary sediments is, however, not precise enough, since it is based on the examination of the shapes of sediments and cannot be reliable when the structure of these sediments is atypical or amorphous or consists of multiple components.
Alternative methods to optical microscopy are still in high demand in the medical field for qualitative and quantitative chemical analysis of urinary deposits. The chemical composition of urinary stones is routinely analysed using vibrational spectroscopy [12, 14, 15, 16, 17, 18, 19, 20], X-ray diffraction [19, 21], and scanning electron microscopy with element distribution analysis (SEM-EDAX) [22]. For urinary sediments, SEM-EDAX experiments have also been carried out, but information about the chemical composition of the sample provided by such experiments are not accurate enough [23]. More reliable results have been obtained by means of infrared (IR) microspectroscopy, but the quality of the results is very dependent on the size of the sediment under study, which is also limited to approximately 10 μm [12, 24, 25]. In addition, IR spectra of urinary deposits can be significantly affected by Mie scattering, which seriously obstructs analysis [24]. Finally, larger crystals cannot be measured in the transmission mode of the IR microscope without additional sample preparation, and the specular reflection signal that could be used instead suffers from spectral distortions that are difficult to correct for [14]. Raman spectroscopy is a method complementary to IR microspectroscopy, but it offers higher spatial resolution, meaning that smaller samples can be analysed [25, 26]. It also allows the challenges posed by analyzing Mie scattering or reflectance IR spectra to be overcome. The main disadvantage of the method, fluorescence that can overwhelm the Raman scattering signal, can be suppressed or even eliminated by using a Fourier transform (FT) Raman spectrometer that employs a near-IR (NIR) laser for excitation of Raman scattering.
In Raman spectroscopy experiments [27], a monochromatic light source, usually a laser, is employed to excite the molecules of a sample. Fluorescence that interferes with the Raman signal originates when a molecule is excited to higher electronic energy states. It happens when the energy of the laser photons exceeds the gap between the electronic energy levels of the molecule. This is especially critical issue for “real life” samples the molecular compounds of which might not possess electronic transition in the visible spectral region but very often are contaminated with fluorescent impurities such as various pigments. Such impurities cannot always be removed from the sample, as is the case for urinary sediments [28, 29]. Using lasers of longer wavelength reduces the probability of such electronic excitation and, in turn, occurrence of fluorescence. Since over the past decades NIR laser sources have become widely available, their implementation in Raman spectroscopy experiments has been gaining popularity in various fields, especially in biology and medicine [30]. It has been used in a few case studies for identification of unrecognized crystals in the urine of patients suffering from gout [31] and psoriatic arthritis [32]. It has also been recently shown that a dispersive Raman spectroscopy system using 785 nm excitation can be useful for the identification of small urinary crystals in patients with urolithiasis [33, 34]. Automatic analysis of single-component deposits has also proven to be possible [33]. In this work, we specifically examined the potential of FT–Raman spectroscopy with 1064 nm laser excitation to explore the chemical composition of urinary sediments. This approach can further improve the sensitivity for identifying such sediments by reducing fluorescence background. Importantly, we investigated the chemical composition of urinary stones from the same patients with urolithiasis to determine whether direct correlation between the composition of the corresponding stones and the deposits exists.
2. Material and methods
For the duration of one year of the project described here, urine samples of every patient with acute uronephrolithiasis hospitalised at the Urology Centre of Vilnius University Santaros Clinics were collected—fifteen in total. The samples were investigated with NIR Raman spectroscopy. The chemical composition of the urinary stones removed from the same patients was also checked by means of FTIR spectroscopy. For the stones, this bulk analysis technique allows better identification of overall composition than Raman spectroscopy, which yields information on micrometer-sized areas that are analysed.
Urine samples were centrifuged in order to separate the urinary crystals. The precipitates were filtered on Whatman ashless grade 542 filters for 24 h at room temperature to remove the remaining liquid. All particles larger than 2.7 μm in diameter remained on the surface of the filter, but only the larger ones (typically >100 μm in size) were collected with the aid of a small needle. Those particles were transferred to the surface of a silver mirror, a typical substrate in spectroscopic analysis that does not produce any Raman signal of its own [35]. This procedure is suitable to collect single crystallites for Raman spectroscopic analysis. The use of artificially synthesised magnetic nanoparticles which adhere to the crystallites in urine solution has been shown to provide possibility to automatically detect, hold and release them for Raman analysis [33], which provides potential for fast identification of many urinary deposits in the future.
Spectra were recorded with a MultiRAM (Bruker Optik GmbH, Ettlingen, Germany) FT–Raman spectrometer equipped with microscope stage and a gold-plated mirror objective (focal length 33 mm) which yields the diameter of the focused laser beam on the sample equal to 100 μm. Samples were excited with a Nd:YAG laser having a wavelength of 1064 nm to produce Raman scattered radiation, which was collected by a liquid-nitrogen–cooled Ge diode detector. The spectra were collected at a resolution of 5 cm−1. Depending on the size and morphology of the urinary deposits, 200 to 170,000 scans were acquired and averaged for a single resultant spectrum. Also, the power of the excitation laser was varied between 5 and 600 mW in order to avoid thermal damage caused by focused NIR laser radiation in the samples more sensitive to heating. The effects of heating in such samples were observed in the spectra as a broad band of black-body radiation in the wavenumber region above 2500 cm−1. Reference spectra of pure chemical compounds (Sigma Aldrich) typically constituting urinary sediments were recorded for the qualitative evaluation of the spectra allowing us to identify all constituents in the analysed deposits with high chemical sensitivity. Spectral analysis was performed on raw spectra with no pre-processing procedures applied. Optical images of the urinary crystals were recorded using the visible mode of the same instrument, which includes a visible light source and a CCD camera for this purpose.
For the FTIR studies, the urinary stones were ground with an agate mortar, mixed with IR-transparent KBr powder (ratio 1:100) and pressed into a pellet using a hydraulic press. The KBr pellets were analysed with a Vertex 70 IR spectrometer (Bruker Optik GmbH, Ettlingen, Germany) equipped with a liquid nitrogen cool mercury cadmium telluride (MCT) detector. The spectra were recorded with 4 cm−1 spectral resolution. One hundred twenty-eight (128) interferograms were obtained, averaged, and converted into a resulting spectrum using the three-term Blackman–Harris apodization function and a zero-filling factor of 2. The spectra were analysed by comparing them with pure chemical component reference spectra recorded in the same way.
3. Results
The chemical composition of the urinary sediments of fifteen patients suffering from urolithiasis was investigated by means of Raman spectroscopy. The characteristic Raman spectra and optical images of the sediments are shown in Figures 1–4. In the spectra that are presented in the figures, the spectral region varies depending on the valuable spectral information of interest. The most characteristic spectral bands are also indicated in the spectra. Although the samples in some cases also contained cells, all the analysed deposits yielded clear signal of the constituting minerals. This could be explained by the fact that the Raman scattering cross-section of minerals is typically much higher while also predominantly containing spectral bands in lower wavenumber region compared to organic compounds constituting cells.
Analysis of the Raman spectra of urinary sediments confirmed that the main urinary stone forming materials were present at elevated concentrations in the urine of patients with urolithiasis: (i) calcium oxalate monohydrate CaC2O4⋅H2O (n = 5, 33%); (ii) urates: uric acid C5H4N4O3, uric acid dihydrate C5H4N4O3⋅2H2O, and ammonium acid urate C5H7N5O3 (n = 4, 27%); (iii) brushite CaHPO4⋅2H2O (n = 4, 27%); (iv) struvite (NH4)MgPO4⋅6H2O (n = 1, 7%). Those were single-component sediments. One of the urinary deposits was composed of three different components: calcium oxalate monohydrate, hydroxyapatite, and calcite. We did not find crystals of calcium oxalate dehydrate nor the rare compounds, such as N-acetylsulfametoxazole or other drugs, in any of the analysed sediments. Since Raman spectra of sediment constituting materials are distinct, this likely due to the small size of the sample set limited by the duration of the project and the low prevalence of acute neprolithiasis patients in Lithuania, and not due to limitations of the technique.
Table 1 summarizes the 15 cases of the chemical composition of urinary sediments and chemical composition of urinary stones from the same patients. At least one molecular compound was the same among samples coming from the same patient. However, oxalate stones were always accompanied by phosphatic additives, amorphous phosphates and hydroxyapatite being the most common. The phosphates were not found in corresponding urinary sediments. Instead, brushite and struvite were found in five urinary sediment samples. Particularly in the case of brushite sediments, low correlation was observed with the composition of corresponding urinary stones, which were constituted from amorphous phosphates, hydroxyapatite and calcium oxalate instead. Different urates were found in the urinary sediments, but the urinary stones of all those patients were composed of uric acid anhydrous. In this case, we still consider that the chemical composition of urinary deposits correlates since uric acid dihydrate and ammonium acid urate are less stable forms of urates and can recrystallize into uric acid anhydrous under decrease in urine pH [36, 37].
Presence of chemical components in urinary sediments and urinary stones among 15 patients suffering from urinary stone disease
| Chemical composition of urinary sediments | Chemical composition of urinary stones | Number of cases |
|---|---|---|
| Calcium oxalate monohydrate | Calcium oxalate monohydrate + amorphous phosphates | 3 |
| Calcium oxalate monohydrate | Calcium oxalate monohydrate + hydroxyapatite | 2 |
| Uric acid anhydrous | Uric acid anhydrous | 1 |
| Uric acid dihydrate | Uric acid anhydrous | 2 |
| Ammonium acid urate | Uric acid anhydrous | 1 |
| Brushite | Calcium oxalate monohydrate + amorphous phosphates | 3 |
| Brushite | Calcium oxalate monohydrate + hydroxyapatite | 1 |
| Struvite | Struvite | 1 |
| Calcium oxalate monohydrate + calcite + hydroxyapatite | Struvite + hydroxyapatite + calcium oxalate monohydrate | 1 |
4. Discussion
Urine saturation with some specific chemical elements—usually oxalates, phosphates, ammonium ions, and magnesium—is a primary and required factor for increased risk of urinary stone formation [38]. Nevertheless, initial crystallisation resulting in 10–12 μm single urinary crystals does not necessarily lead to the formation of a urinary stones and is common for healthy people [39, 40]. Precipitation of significant amounts of crystals and/or suitable conditions in the urinary tract is, however, very likely to lead to the aggregation of small crystals typically bound by a protein matrix. Such sediments, which are made of small crystals or are mixed with an organic matrix, are larger and usually have an obscure morphology [40]. In addition, some aggregates can consist of several chemical compounds. Urinary stone formation is much more frequent in patients with larger size crystals and aggregates in their urine [41]. Particular attention should be paid when investigating the chemical composition of such larger crystals and aggregates. Here we used a FT–Raman spectrometer that allowed us analysing urinary crystals and aggregates approximately 100 μm in size. However, even smaller sediments as small as 1 μm could and should in the future be analysed using the method by employing objectives of higher magnification and numerical aperture for tighter focusing of laser radiation.
Optical microscopy, which is nowadays used in laboratory medicine, is unable to recognize large single or multi-chemical aggregates because of their unusual morphology [10, 13, 41]. The crystals having the most clinical significance are often left unidentified or incorrectly identified during routine urinalysis.
FT–Raman spectroscopy proved to be a suitable method to determine the exact molecular compounds of urinary sediments independent of their morphology. Figures 1 and 2 illustrate cases when both typical and atypical crystals of brushite and struvite were found in samples. Brushite tends to form crystals shaped as long prisms with one sharp end and combine into spiky star-like formations as shown in the upper image of Figure 1. The bottom image, however, reveals morphologically indescribable sediment. Raman spectra were found to be the same for both and the sediments were identified as brushite. A very similar situation was encountered for atypical sediments and sediments having a defined morphology, both corresponding to struvite when investigated by means of Raman scattering spectroscopy.
FT–Raman spectrum of brushite urinary sediments (laser power: 180 mW, number of averaged spectra: 2000) (left) and optical images of typical (top) and atypical (bottom) urinary deposits composed of brushite.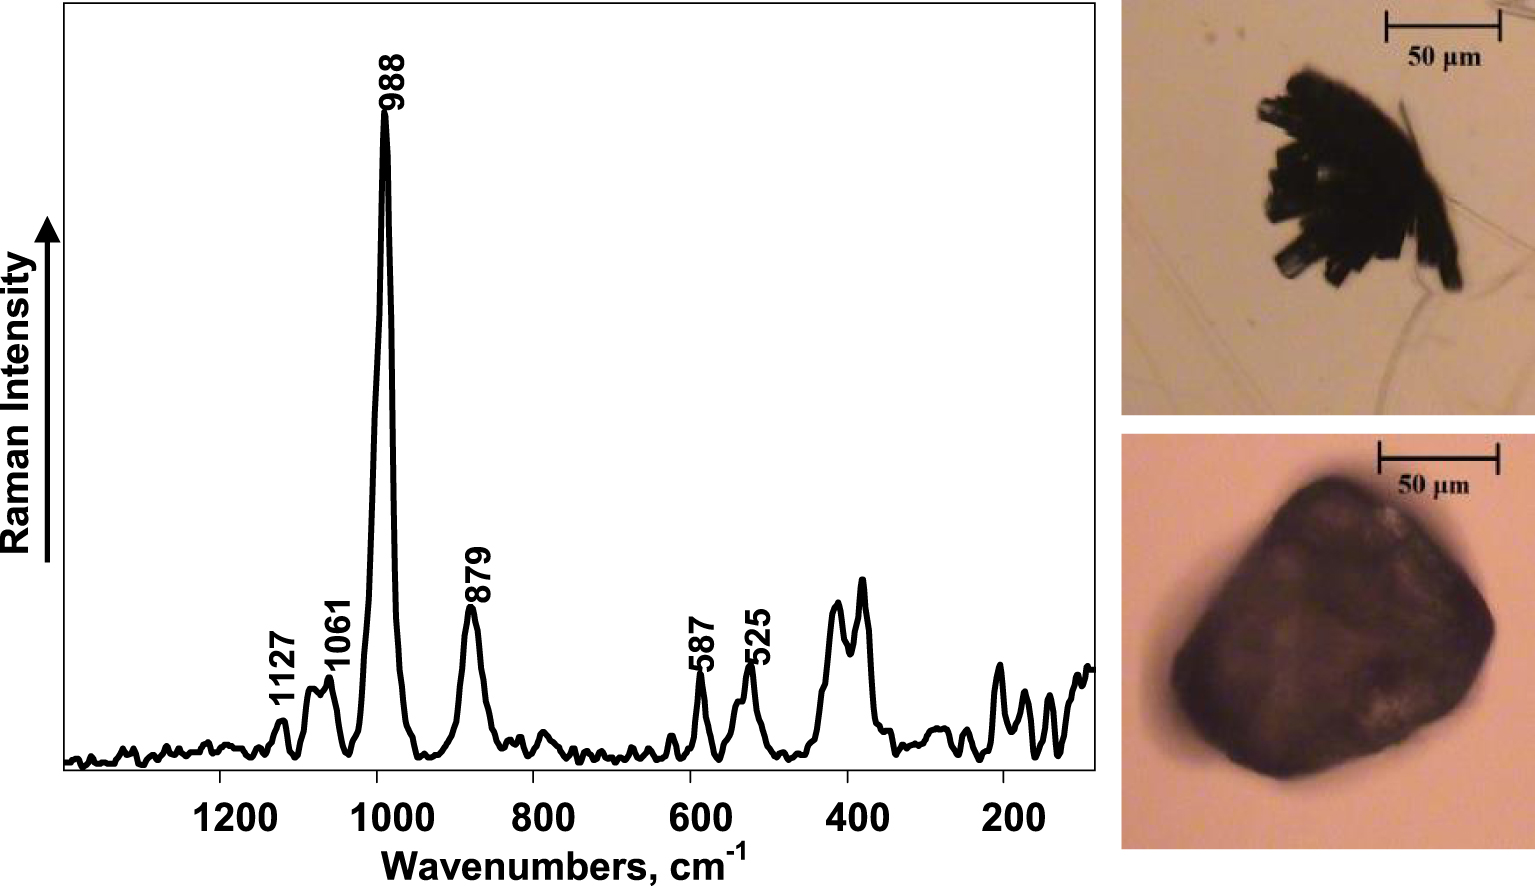
FT–Raman spectrum of struvite urinary sediments (laser power: 180 mW, number of averaged spectra: 2000) (left) and optical images of typical (top) and atypical (bottom) urinary deposits composed of struvite.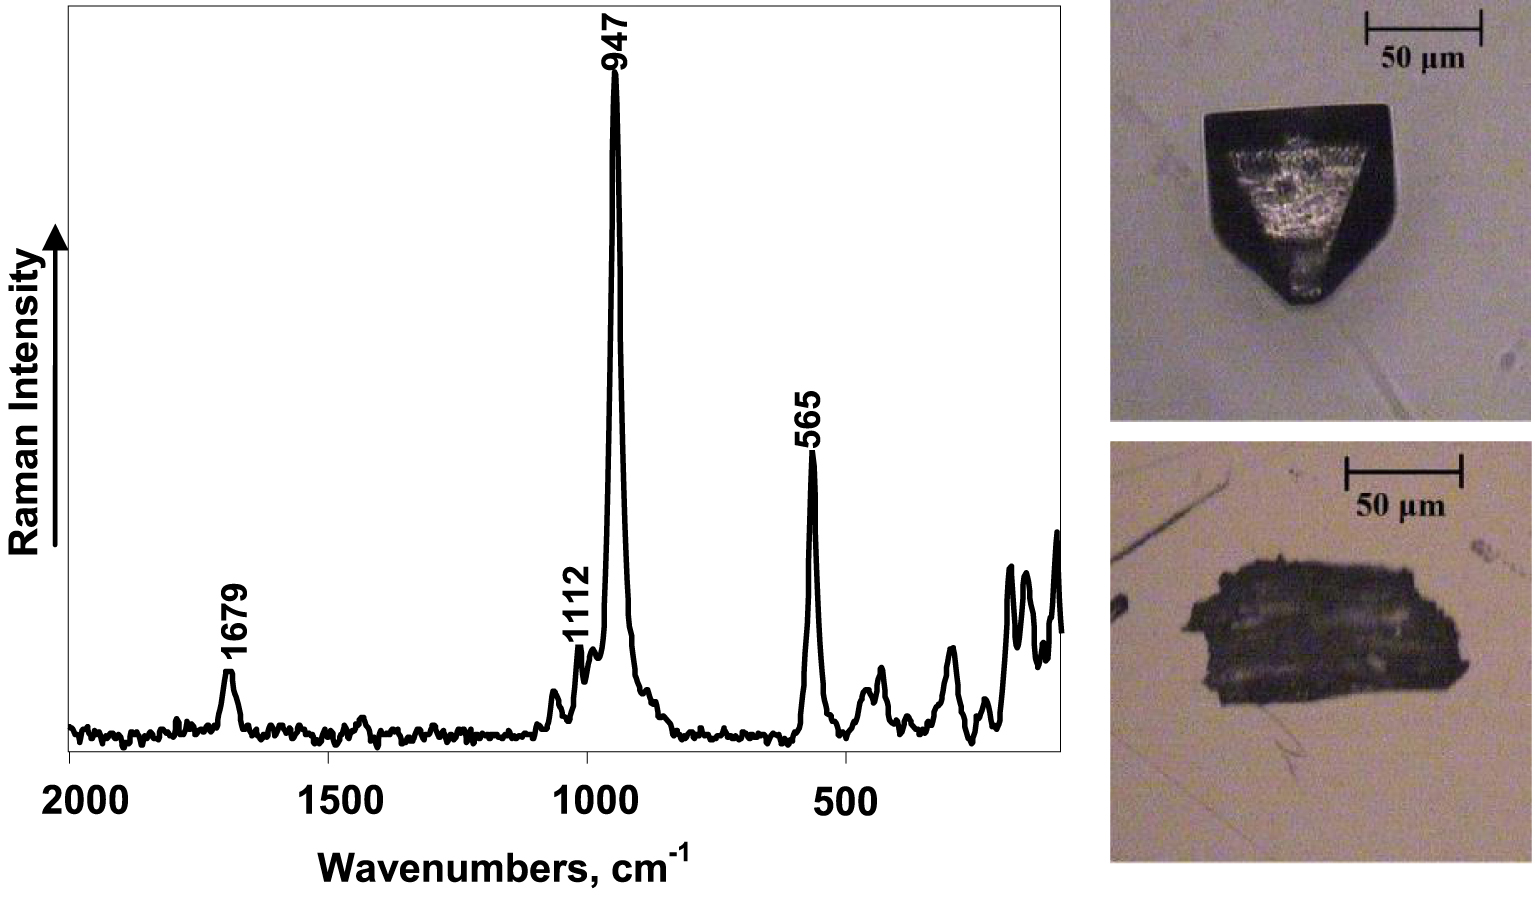
It turned out to be challenging to record Raman spectrum of high quality in terms of signal-to-noise ratio for deposits of calcium oxalate, which were heated when exposed to the laser radiation and subsequently thermally damaged. The heating could be caused by a typically brown colour of the larger calcium oxalate crystals suggesting presence of pigments or other types of organic contaminants, which increase the absorption of the laser radiation and makes them more susceptible to heating. Therefore, the power of the laser had to be low and the number of spectra averaged had to be increased substantially to achieve a signal-to-noise ratio sufficient for spectral analysis. This in turn increased the time required for the experiment. Importantly, Raman spectroscopy allows one to distinguish different hydrates of calcium oxalate, which can be indicative of the different aetiology of the urinary stone and provide important information for subsequent treatment [20]. The most intense spectral bands of calcium oxalate monohydrate are a doublet at 1490 cm−1 and 1463 cm−1 assigned to symmetrical 𝜈s (COO−) stretch vibrations. On the other hand, calcium oxalate dihydrate yields only one spectral band in this spectral region near 1477 cm−1 [16]. The Raman spectrum in Figure 3 clearly shows the urinary sediment to be calcium oxalate monohydrate. It is not possible to obtain such information from the optical image, since the large, likely aggregated deposit does not appear in the typical shape of calcium oxalate crystals.
FT–Raman spectrum (laser power: 9 mW, number of averaged spectra: 170,000) (left) and optical image (right) of calcium oxalate monohydrate urinary sediment.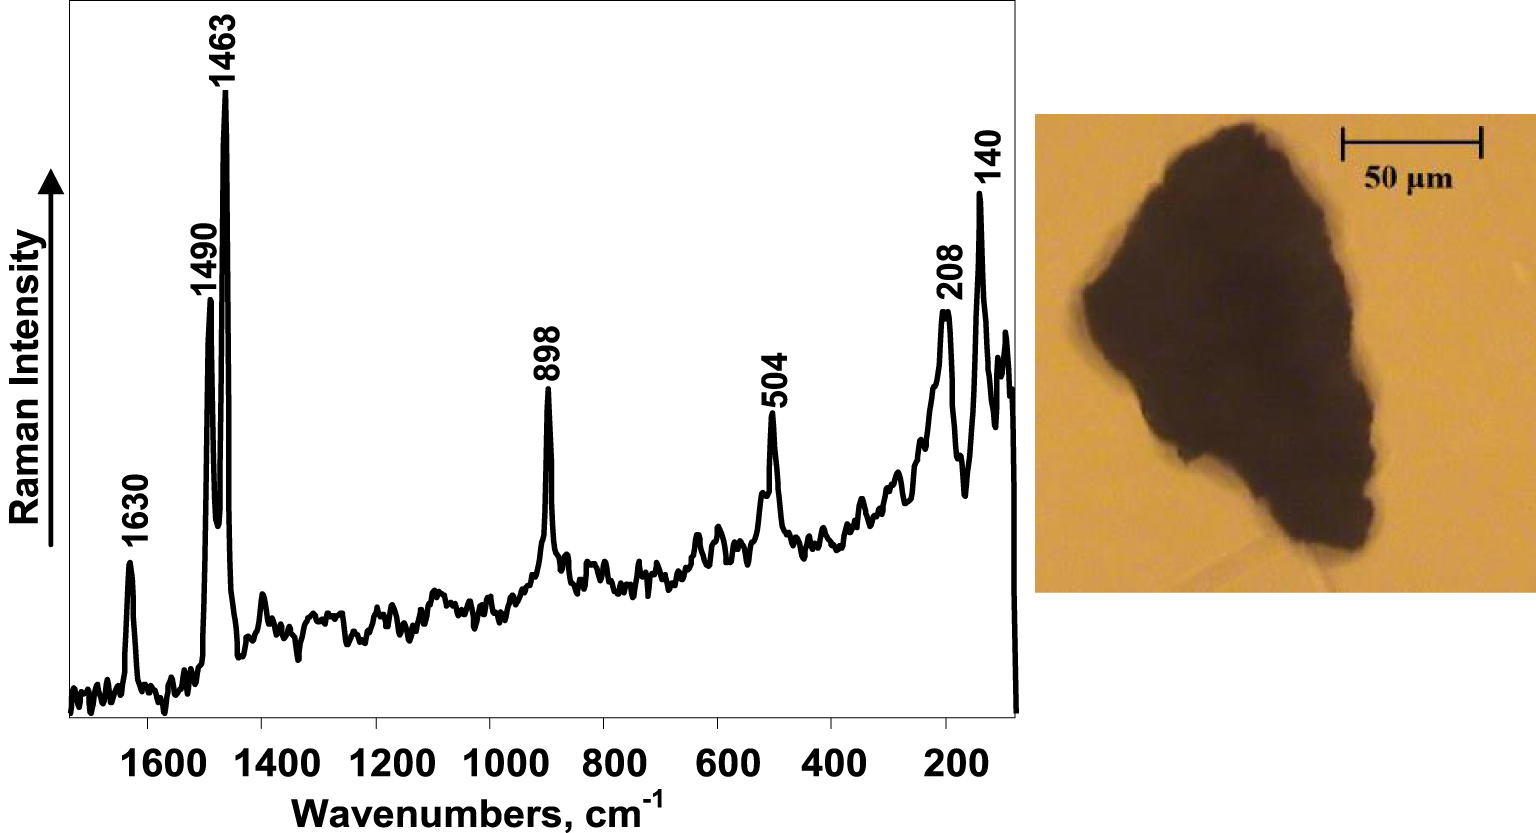
Raman spectra are also useful for distinguishing various types of urates. Uric acid anhydrous and uric acid dihydrate are the most common urates constituting urinary stones and urinary sediments. Uric acid monohydrate is also reported as a possible constituent [42]. Of note, both hydrates are rarely found in urinary stones, with the hydration possibly lost during stone growth. We have, however, discerned the presence of uric acid dihydrate in urinary deposits. An example of the atypical morphological structure of a uric acid dihydrate urinary deposit is shown in Figure 4 together with the Raman spectrum of the deposit. Uric acid anhydrous and ammonium acid urate were also identified as constituents of urinary sediments in this work. The varying intensities and Raman shifts of the spectral bands related to the in-plane bending motions of purine rings can be used as spectral markers for recognition of various urates.
FT–Raman spectrum (laser power: 80 mW, number of averaged spectra: 20,000) (left) and optical image (right) of uric acid urinary sediment.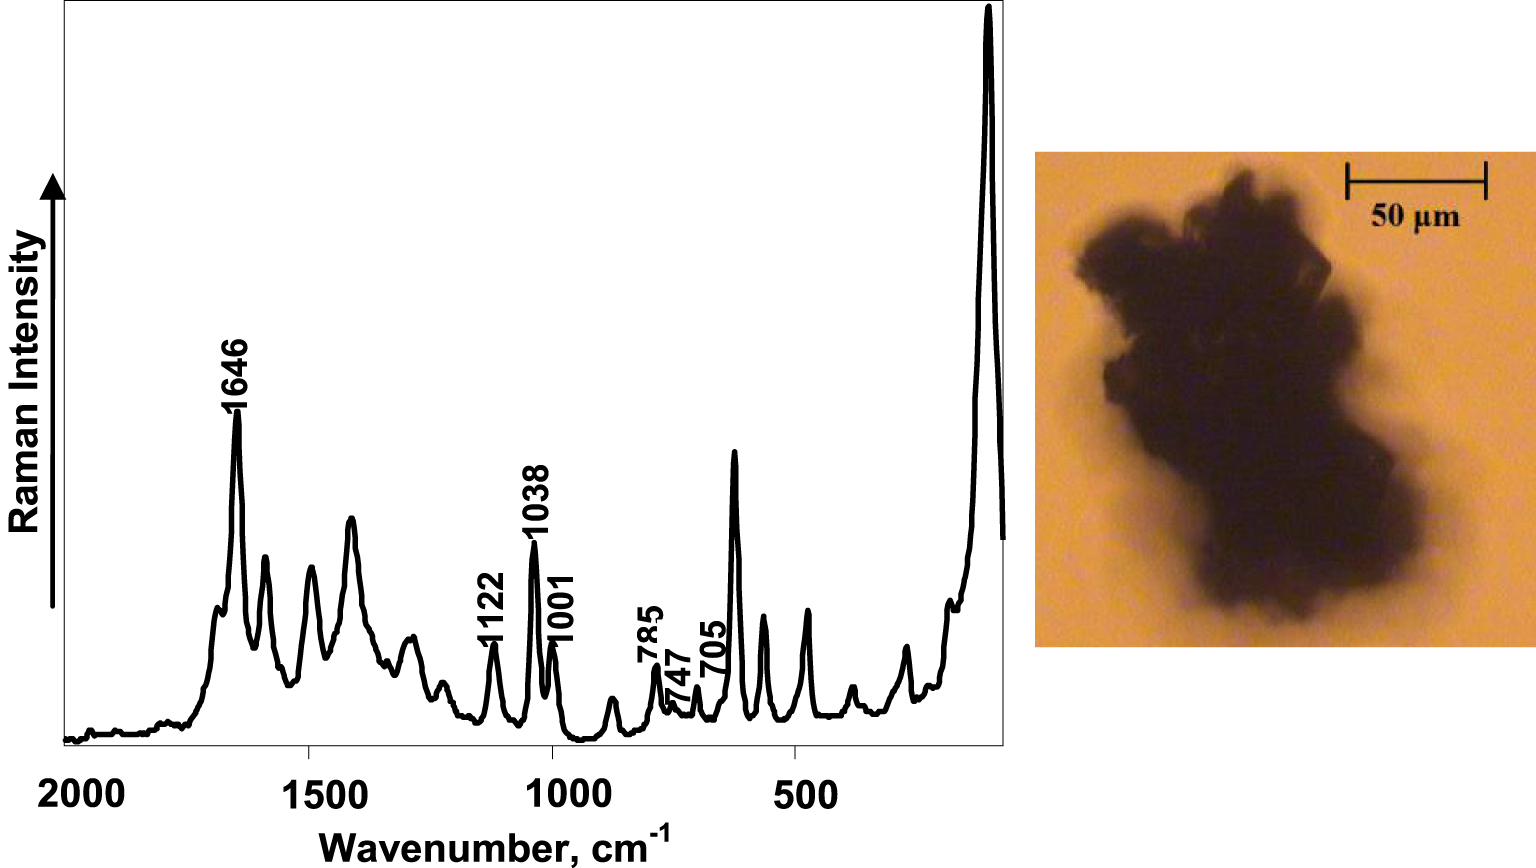
FT–Raman scattering spectroscopy proved to be a reliable method to determine the chemical composition of multi-component urinary sediments. As can be seen from the optical image of the urinary deposit in Figure 5, it has irregular morphology and no crystal structure, which makes it very difficult to determine its chemical composition. On the contrary, the Raman spectrum of this deposit indicates the three different chemical compounds: calcium oxalate monohydrate, hydroxyapatite, and calcite. The most intensive spectral band, which is at 1085 cm−1 and is characteristic of the vibrations of the group, and the one at 280 cm−1 represent CaCO3 (calcite) in the sample [43]. A spectral band at 960 cm−1 characteristic of hydroxyapatite can also be observed. All other spectral bands in the Raman spectrum of this urinary deposit are assigned to calcium oxalate monohydrate.
Optical image of urinary deposit (top left corner), Raman spectra of the deposit (bottom), and reference chemical compounds indicating calcium oxalate monohydrate, calcite, and hydroxyapatite Raman spectra.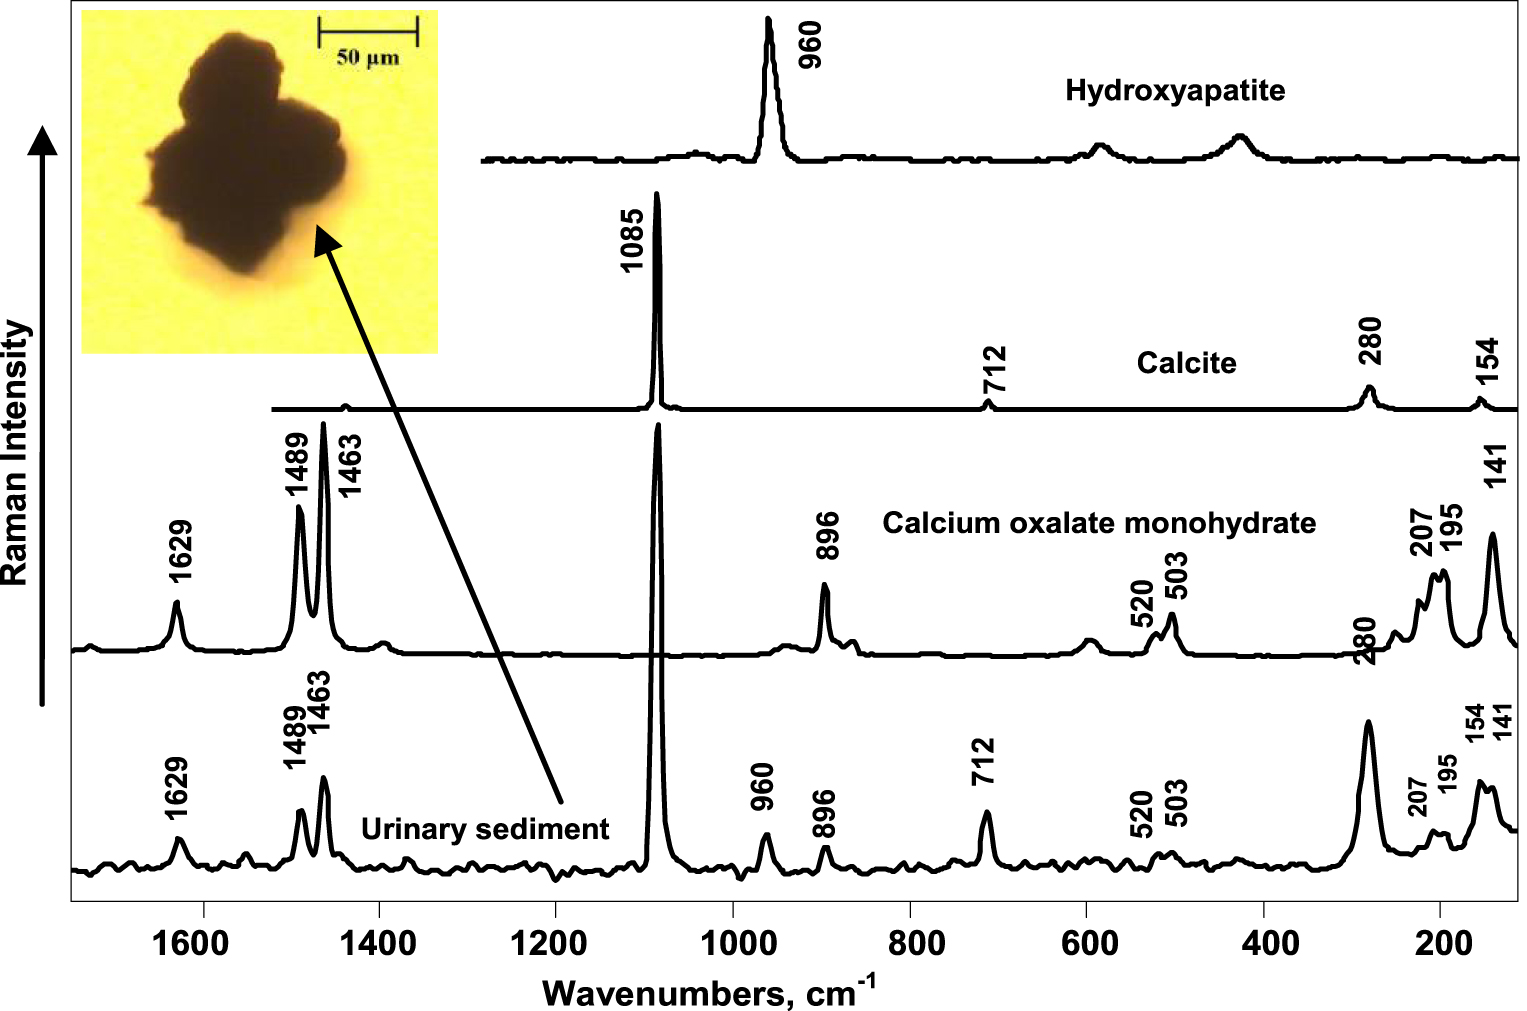
The close similarity of the chemical composition of urinary sediments of patients with the same urinary stone disease indicates that saturation of urine with specific chemical elements can result in urinary stone formation. For patients in the risk group, such as those with increased possibility of recurrence or with a family history of urinary stones, the exact evaluation of the chemical components in urinary sediments could be crucial for prevention purposes.
The differences between the chemical composition of urinary sediments and urinary stones can also provide valuable information concerning the processes of urinary stone formation. In our study, uric acid urinary stones were composed of uric acid anhydrous, but the urinary deposits of the same patients were also found to be uric acid dihydrate or ammonium acid urate. This suggests the occurrence of dehydration and ion separation processes at the time of stone formation.
The most significant differences were found in the patients having urinary sediments of brushite and stones having a mixture of calcium oxalate monohydrate with amorphous phosphates or with hydroxyapatite. Brushite and amorphous phosphates, as well as calcium oxalate, are formed in high calcium concentrations. Hydroxyapatite can occur via phase transformation from brushite [44]. Thus, the existence of brushite in urine can suggest the existence of hypercalciuria and formation of calcium oxalate-phosphate stones. On the other hand, as a constituent in multicomponent urinary stones, pure brushite occurrence varies from less than 1% to about 20% according to various authors [12, 45], and in general it is considered a rare component [16]. For single component calcium oxalate stones, only calcium oxalate urinary sediments were found.
In this work we provide pilot evidence for the correlation between the chemical composition of urinary sediments and stones, but more patients need to be included in the study for the results to be statistically reliable. We show that FT–Raman spectroscopy is suitable for reliably identifying urinary deposits larger than 100 μm in size with no significant influence of fluorescence as observed in previous studies [31, 33]. The long spectral acquisition time is the main limiting factor for the method to be used in a routine way in clinical practice. This can be alleviated in the future by using high magnification and numerical aperture objectives (which would also result in ability to analyse samples as small as 1 μm) or applying mathematical noise reduction procedures for low signal-to-noise spectra [46, 47, 48].
Urinary stones are usually diagnosed in an already late stage of their formation, e.g., only when the patient starts feeling pain. Regular tests of urinary sediments to determine its exact chemical composition could be key to early prevention of urinary stone disease. In this work, Raman spectroscopy proved to be informative for the chemical identification of both typical and atypical urinary crystals and crystal clusters. Although this is a pilot study and more patient cases need to be investigated for the results to be statistically reliable, spectral analysis of the deposits could help in prescribing the appropriate preventive measures, such as diet and lifestyle changes, for people at risk of urinary stones. In addition, distinguishing chemical compounds of even the smallest chemical differences can be of high value in determining the causes and conditions of the initial formation and growth processes of urinary stones.
5. Conclusions
FT–Raman spectroscopy is an effective and very sensitive method to determine the chemical composition of urinary sediments no matter their morphological structure and is especially useful for the investigation of unusual crystals and amorphous clusters, which cannot be identified by optical microscopy widely used in standard medical practice. Use of 1064 nm NIR laser for excitation of Raman scattering ensures suppression of fluorescence background common in biological samples. In contrast to optical microscopy, the method does not rely on the skills of laboratory personnel since the Raman spectra provides direct chemical information at molecular level. We found correlation between the chemical composition of urinary stones and urinary sediments, which suggests that the examination of the sediments by FT–Raman spectroscopy can be considered a relevant approach for early diagnosis of urinary stone formation and determination of appropriate action to prevent this process.