


 CC-BY 4.0
1. Introduction
Leather industry plays a prominent role in the world’s economy, with an estimated global trade value of approximately US$100 billion per year [1]. Leather making consists of the transformation of animal skins and hides into valuable materials used in the manufacture of products such as shoes, leather goods, etc … requiring a series of chemical and mechanical processes [2]. During the leather process a large amount of solid wastes are generated such as hides and skins, fats, shavings and trimmings, buffing dust, process effluents, and sludge [3]. The most common way to manage solid wastes is by disposing of them on landfill sites [4]. Fleshing wastes are considered as major solid wastes (around 60%) generated from tannery and finite leather production [5]. The utilization of the same fleshings for glue manufacture is not economically viable. Similarly, fleshings obtained from hides treated with a high percentage of sodium sulfide are found to be unfit for the production of glue. They are at best disposed through landfill. Disposal of such fleshings is currently a serious problem and new ways for the disposal of tannery fleshing waste (TFW) need to be found.
Besides, in tannery manufacturing, a large amount of wastewater is generated through all tannery stages [6]. A great deal of dye wastewater is discharged during the tanning process, constituting about 30% of the total tannery wastewater [7]. Dyes have a critical impact on human health due to their toxicity and carcinogenicity [8] and therefore must be removed before their discharge into the water body. Various technologies such as coagulation, solvent extraction, and advanced oxidation process have been developed for removing these dye wastewaters in the past decades. However, these methods have some drawbacks such as high energy consumption, incomplete dye removal and toxic sludge generation. Among them, the adsorption process has been reported to be economical and easy to apply as well as effective in removing color from wastewater. Activated carbon is the most widely used adsorbent in various industrial sectors due to their highly porous structure, extremely large surface area to volume ratio and high degree of surface reactivity. However, especially due to its production and regeneration cost, the use of adsorption in industrial processes, as tanneries, is limited [5]. According to several researchers the concept of “circular economy” was proposed to be an idea of reducing environmental impact caused by discharged waste products and to increase the effective recycling system in order to minimize the wasted resources. Therefore, the use of industrial waste as alternative adsorbents has been considered, and solid waste generated in the leather processing operation has been used as alternative adsorbents for the removal of dyes, metals, oils, and surfactants [9, 10, 11]. Adsorbents are generally the key points of the adsorption method, which directly affect the adsorption capacity of pollutants and cost. Therefore, adsorbents with a high surface area and a simple preparation process attract considerable attention. Biochar [12] is the byproduct of biomass pyrolysis and is widely used in catalysis [13], storage material, [14] soil remediation, [15] and environmental pollution control [16]. Therefore, biochar especially is attracting attention as a low-cost adsorbent because it can be used as a substitute for activated carbon, which is used as a conventional adsorbent due to its ability to adsorb high levels of pollutants. The use of biochar as being eco-friendly for the removal of dye from wastewater has been examined in the past by several researchers [17, 18, 19, 20, 21]. However, in literature, there are few studies related to the production of biochars from tannery solid wastes and their application to wastewater treatment. Tang et al. [3] produced a modified biochar from non-tanned hide wastes which showed a remarkable potential to eliminate dye from effluent. Huang et al. [22] examined the capacity of biochar derived from leather shavings for Congo red removal. Payel et al. [23] produced biochar from the tannery liming sludge for in-house chromium adsorption from tannery wastewater. To date, there is still no study on dye removal by the biochar from TFW. Hence, this work aims to validate a new circular economy model based on the conversion of tannery solid wastes into biochar which will be applied for industrial dye removal from tannery wastewater. The novelty of the present study is to investigate the removal of industrial dyes used for leather tanning using biochar produced by the waste generated by the same tannery. In this context, the production of biochar using tannery fleshing solid waste represents a new alternative sorbent to remove leather dyes from wastewaters. The new proposed adsorbent was characterized by elemental composition, SEM, optical microscopy, FTIR, and zeta potential. The adsorbent was used for the treatment of dye aqueous solutions and real tannery wastewater.
2. Materials and methods
2.1. Biochar preparation
TFW were collected from a Tunisian Leather Tannery factory (TMM Tannerie Megisserie du Maghreb), located in Grombalia region, Northern Tunisia. TFW were sampled directly at the end of the beamhouse production line and before the chrome tanning leather manufacturing process, in order to prevent TFW saponification. TFW samples were first finely crushed to small pieces (2 to 4 mm) and then air-dried for five days. Pre-dried TFW samples were stocked in glass bottles for further characterization and pyrolysis experiments. Afterwards, the pre-dried TFW was pyrolyzed in a fixed bed stainless reactor with a length of 30 cm and a diameter of 15 cm. During the pyrolysis tests, 300 g of TFW were placed in the reactor and heated by an electric furnace from room temperature until the desired temperature (400 °C; 500 °C and 600 °C) at a rate of 5 °C/min under 0.5 L⋅min−1 nitrogen flow. The generated biochars at pyrolysis temperatures of 400 °C; 500 °C and 600 °C were labeled BTFW-400, BTFW-500, and BTFW-600, respectively and used for the study of dye wastewater adsorption from aqueous solutions.
2.2. Biochar characterization
The biochar production yield (Ychar) was determined as the ratio between the weight of collected biochar (Mchar (g)) and the weight of pre-dried TFW waste (MTFW (g)) as follows:
| (1) |
Proximate analyzes were realized in triplicate using thermogravimetric analyzer (Mettler TGA/DSC 1) according to ASTM method. The pH of zero point charge (pHZPC) values of the studied biochars were determined according to the solid addition method using 0.01 M NaCl solutions, 1 g of solid matrix for initial pH values varying between 2 and 12. The particle size distribution of the two used solid matrixes was achieved using a Malvern Mastersizer STD06 laser granulometer. The mineral element contents of the different chars were measured by Atomic Absorption Spectrometry (AAS). The surface chemistry of biochars was provided through Fourier Transform Infrared spectroscopic (FTIR) analyzes using the KBr method with an IFTR-BX, Perkin Elmer apparatus. All biochar samples were carefully dried before mixing with KBr to avoid any additional effect due to the presence of water. The related spectral resolution is 1 cm−1 measured between 400 and 4000 cm−1. The possible existence of any crystallographic structure in the tested biochars was assessed thanks to X-ray diffraction analysis (PW 1710). The morphologic and surface elemental composition of the biochars were characterized with a scanning electron microscopy (SEM) and energy dispersive EDX (X-ray spectrometry) (Philips XL30 FEG). Finally, biochar’s textural properties were measured by carbon dioxide (CO_2) adsorption isotherms at 273 K.
2.3. Dye adsorbate preparation
SELLA Fast Red (SFR) RTN provided by TFL company is a mixture of direct and acid dyes. This was used as the dye adsorbate for the batch adsorption study. The formula and the complete structure diagram are not available. This dye solution showed a maximum absorbance at a wavelength of 465 nm. Distilled water was used for the preparation of dye solution throughout the study. The stock solution of 1000 ppm of SFR dye was prepared by dissolving 1 g of the dye powder in 1 L of distilled water in the volumetric flask. The desired concentrations of dye adsorbate were prepared by dilution with distilled water.
2.4. Batch sorption experiment
The assessment of SFR dye adsorption capacities of the elaborated biochars was performed through batch experiments. During this work, the impacts of contact time, initial SFR dye concentrations, solution pH, biochar dosages and temperature on SFR removal by the three tested biochars (BTFW-400, BTFW-500 and BTFW-600) were quantified. All these experiments were performed at 20 ± 02 °C in 120 mL capped flasks. For each run, a given biochar mass was added into 50 mL solutions of a desired dye concentration and shaken at 400 rpm using a magnetic stirrer (Figure 1). After the stirring time, the liquid phase was separated from the adsorbent particles by a laboratory centrifuge type NEOFUGE 1600R at a speed of 4000 rpm for 20 min. SFR color removal was evaluated by measuring absorbance decrease at 465 nm using an UV–Vis spectrophotometer (T80+).
Setup of the flow sheet of the batch adsorption experiment.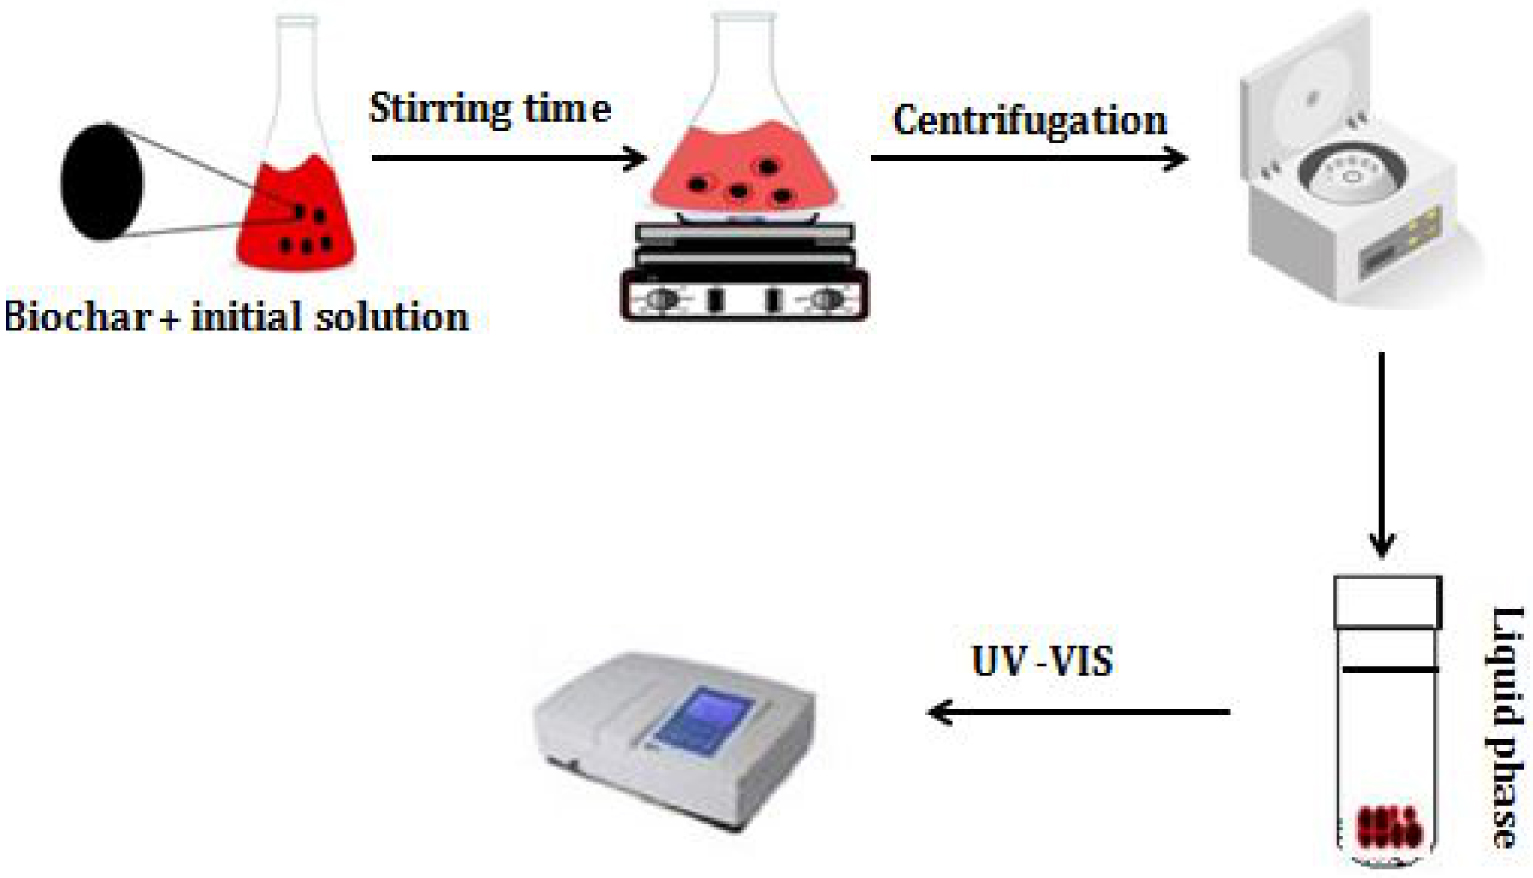
The adsorbed SFR dye amount at a given time, t, (qt,P: mg⋅g−1) by the three tested biochars was calculated as below:
| (2) |
2.5. Kinetic and isotherm studies
Kinetic studies were carried out in order to establish the effect of contact time on the dye adsorption process by the three tested biochars. Kinetics were monitored at various times between 1 and 360 min. The initial SFR dye concentration, the biochar dosages, the aqueous pH and temperature were fixed to 75 mg⋅L−1, 2 g⋅L−1, 6 (natural: without adjustment) and 20 °C, respectively. The equilibrium adsorption data were assessed for the three studied biochars for initial SFR concentrations varying between 50 and 100 mg⋅L−1 and a constant contact time of 240 min. This time was determined on the basis of preliminary assays and judged to be sufficient to ensure an equilibrium state between dye molecules and the adsorbent particles. These experiments were performed for fixed adsorbent dosages, aqueous pH and temperature of 2 g⋅L−1, 6 and 20 °C, respectively. Several models have been used in scientific literature to fit the kinetic and equilibrium adsorption experiments [24, 25]. In the present study, we used the most common kinetic and equilibrium models namely, the pseudo-first-order, pseudo-second-order, intra-particle and film diffusion; and Freundlich and Langmuir models, respectively. The SFR kinetics of BTFW was fitted with the pseudo-first- and pseudo-second-order models. The related kinetic constant values of each model (K1 and K2), the correlation coefficients, R2, the predicted removal dye amounts at equilibrium in comparison with the experimental ones are given in Table 3. Furthermore, in order to compare the applicability of these two kinetic models and their goodness of fit to the experimental data, the average percentage errors (APE) between the predicted removal of dye amounts “qt,calc (mg⋅g−1)” and the experimental ones “qt,exp (mg⋅g−1)” for each used biochar were assessed as follows:
| (3) |
2.6. Effect of pH, biochar dosages and temperature
During these experiments, the default values of the tested parameters were fixed to 75 mg/L, 6.0, 2 g/L, 240 min, and 20 °C for initial aqueous SFR concentration, pH, contact time and temperature, respectively. The influence of the initial aqueous pH solutions on SFR removal from the synthetic solutions by the three tested biochars were investigated in a series of experiments for initial pH values of 3, 6, 9, and 12. The impact of the adsorbent dosages on SFR removal was assessed for the three biochar doses of 0.5, 1, 2, 4, 6, 12 g/L respectively. Finally, the effect of temperature on SFR removal was studied at four different temperatures, 20, 30, 40, and 50 °C. For all the assays cited previously, pH adjustment was carried out using small volumes (lower than 1 mL) of 0.1 M HNO3, and NaOH solutions. Moreover, each analysis point reported in this study is an average of at least three independent parallel sample solutions. The standard deviation of the results was 3%.
2.7. Desorption test
The SFR desorption from preloaded BTFW-600 °C at concentrations of 39.8 mg/g was performed using distilled water. During these experiments, 0.1 g of the dye-loaded adsorbents was shaken in 100 mL of distilled water at different initial pH values of 5, 7, 9, and 11, adjusted with NaOH (analytical grade) at 20 °C for 2 h. As for adsorption studies, the aqueous phase of the triplicate samples were separated from the solid ones by centrifugation before analysis with UV–Vis spectroscopy. The mass of desorbed SFR by unit of adsorbent weight at equilibrium, qd (mg/g), and percent dye desorption (Y (%)) were determined based on the common equations given by Jain et al. [26].
2.8. Batch experiments for SFR dye removal from real wastewaters
BTFW-600 °C has been used to carry out additional assays regarding SFR dye removal from real wastewater. The main aim of this kind of experiment is to check the BTFW-600 °C efficiency for relatively complex solution compositions. The used wastewater has been collected from a Tunisian Leather Tannery factory (TMM Tanneries Megisserie du Maghreb), located in Grombalia region, Northern Tunisia. During these experiments, in order to compare the dye efficiencies observed for synthetic solutions, the initial aqueous pH was fixed to 6 for the used wastewater. The tested BTFW-600 °C doses were fixed to 1, 4, and 10 g⋅L−1. As for the synthetic solutions, triplicate experiments were performed for a contact time of 240 min.
3. Results and discussion
3.1. Effect of pyrolysis temperature on biochars properties
3.1.1. Biochars yields
The pyrolysis of the TFW demonstrated that the biochar yields were dependent on the used temperature (Table 1). Indeed, they decreased from about 52.5% to 33.3% when the temperature increased from 400 °C to 600 °C. This behavior is attributed to the fact that at low pyrolysis temperatures, lower condensation yields of aliphatic compounds and smaller transformations of fleshing waste components to CH4, H2 and CO were achieved [27]. Several researchers [28, 29] reported that the decrease in yield of biochar is due to moisture evaporation, devolatilization and char combustion. Similar observations were reported by Younis et al. [30] and Gil et al. [31] when studying the pyrolysis of tannery solid waste and wastes of vegetable tanning under different temperatures, respectively.
3.1.2. Biochars characterization
Physicochemical characterization of the three tested biochars, is shown in Table 1. As expected, the pyrolysis step produces an increase in fixed carbon content, a decrease in volatile matter and an increase in the ash concentration. The volatile matter contents of the biochars significantly decreased from about 46.29% to 12.3% when the applied pyrolysis temperature was increased from 400 to 600 °C. The relatively low concentration of volatile matter present in the char indicates that the material has been totally pyrolyzed and the volatile solid loss is primarily dependent on the quantitative share of protein, lipid and carbohydrates in the wastes and its thermal stability differences. The fixed carbon contents increased from 16.08% to 37.24% when the temperature was raised from 400 °C to 600 °C. On the other hand, ash content increased from 30.21% to 43.84% as the pyrolysis temperature increased from 400 °C to 600 °C. Ash contents was high due to the presence of salts and inorganic substances used in the pre-tanning process. A similar result was obtained by Velusamy et al. [32] when quantifying the impact of pyrolysis process on the characteristics of biochars produced from leather finished trimmings and chrome shavings from tanneries at a temperature of 500 °C. Results show a significant reduction in the volatile solids of the two tested materials from 75.7 and 74.7% in raw wastes to 27.4 and 32.1% in the char, respectively. Researchers also reported that pyrolysis process increased the ash content of this waste from 7.9–10.5% to 15.8–25.2%.
Main properties of the biochars pyrolyzed under temperature of 400–600 °C
| BTFW-400 | BTFW-500 | BTFW-600 | |
|---|---|---|---|
| Yields (%) | 70.59 | 52.7 | 39.47 |
| Ash content percentage (%) | 30.21 | 40.61 | 43.84 |
| Volatile matter (%) | 46.29 | 20.98 | 12.30 |
| Fixed carbon (%) | 16.08 | 31.39 | 37.24 |
| pHZC | 8.5 | 9.25 | 10.3 |
| Mean diameter d50 (mm) | 16.5 | 18.6 | 33.7 |
| Uniformity coefficient (UC) | 6.42 | 5.95 | 6.22 |
| Specific area (m2⋅g−1) | 70.54 | 101.3 | 140.98 |
| Volume micropore (cm3⋅g−1) | 0.067 | 0.072 | 0.098 |
Element content in the biochar in three tested biochars (mg/kg)
| Cu | Cr | Cd | Zn | Fe | K | Mg | |
|---|---|---|---|---|---|---|---|
| BTFW-400 | 37 | 200 | 50 | 700 | 4120 | 23.37 | 3458 |
| BTFW-500 | 101 | 300 | 190 | 1630 | 4710 | 26.56 | 5610 |
| BTFW-600 | 324 | 500 | 70 | 1500 | 5205 | 77.21 | 6521 |
It is important to underline that the pyrolysis temperature has increased the pHZPC from 8.5 to 10.3. (Figure 2). This behavior could be probably due to the separation of alkali salts from the TFW at high temperatures. This means that the surface of biochars behaves as positively charged for solutions lower than these values. This finding is very promising since these biochars could contribute to the elimination of anionic dyes. These results agree with the overall literature about biochars that typically indicate basic properties [33, 34] for this type of materials.
pH of zero point charge of the three tested biochars.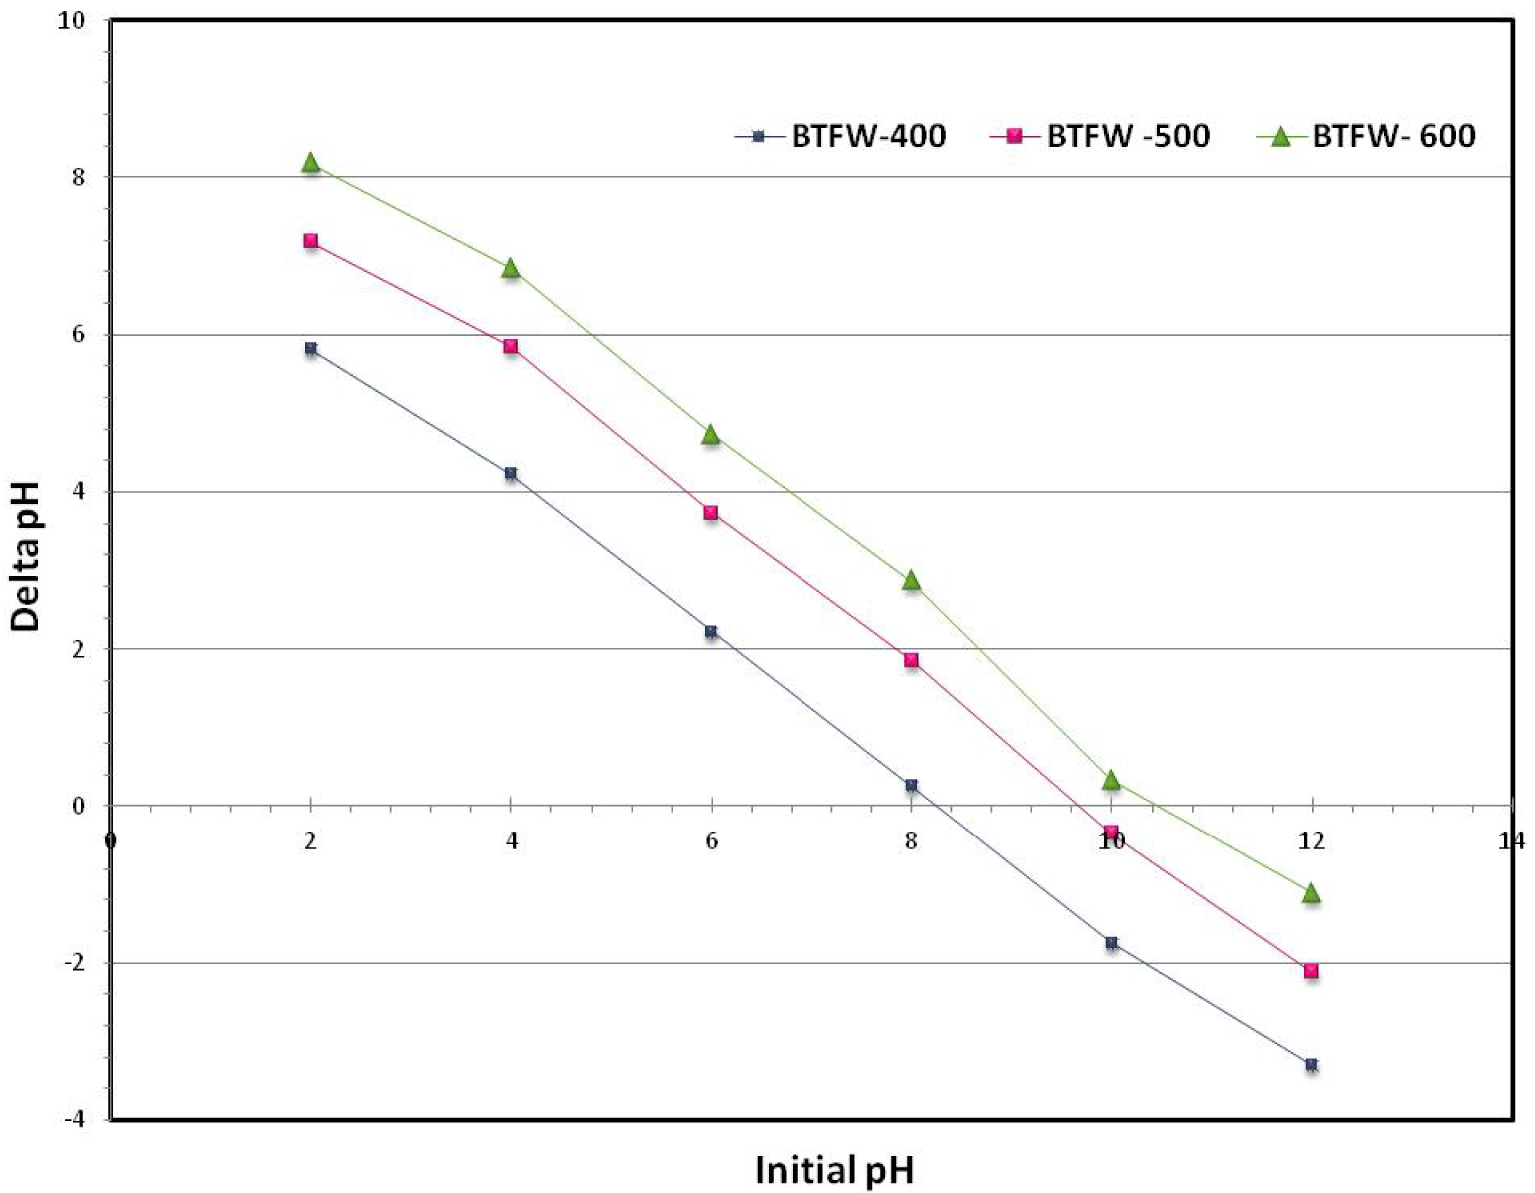
The particle size distribution of the three tested biochars shows that they are heterogeneous porous media since uniformity coefficient was higher than two. Indeed, their mean diameters are evaluated at about 16.5, 18.6 and 33.7 μm for BTFW-400, BTFW-500 and BTFW-600 respectively. The presence of relatively small sized particles in the used biochars should play an important role in physicochemical reactions with the tested dye. On the other hand, it can be noticed that the specific surface area of the biochars was increased from 70.54 to 140.98 when the used temperature was increased from 400 °C to 600 °C (Table 1). Hence these biochars can be used as an adsorbent for treating dye contaminated wastewater. This result most likely is due to more decomposition of polymeric network and organic moieties [35]. A similar result was obtained by Younis et al. [30] when studying the impact of pyrolysis process on tannery solid waste. The surface area of biochar was 134.9 m2⋅g−1, which indicates the presence of fewer tiny pores. Suliman et al. [36] observed that the maximum surface area was in the range of 145–500 m2⋅g−1 from different biochars prepared at 400–600 °C. The extra volatile release, caused by higher temperatures, explains also the generation of higher microporosity, as the micropores get larger by 58% (from 0.062 to 0.098 cm3⋅g−1). The inorganic contents of the three studied biochars were determined thanks to AAS analyzes (Table 2). The tested biochars produced from TFW contained the heavy metals Cr, Cd, Zn, Cu, and Fe along with, K and Mg, with Fe being the highest as compared to all others. Among the essential metals, Mg was the highest followed by Fe and Zn (Table 2). The high metal content in the three biochars produced from TFW might be due to chemicals used in beamhouse treatment and tanning process This is in line with Younas et al. [37] who reported high concentration of Cr, Zn, Cu, and Pb due to the tanning process and bioaccumulation of fumes of burnt tannery solid waste. Furthermore we can see from Table 2 that the contents of K, Cr, Zn, Mg, Cd, Fe, and Cu increased by about 230%, 150%, 114%, 88% and 40%, 26% and 7.75% respectively, when the pyrolysis temperature was increased from 400 to 600 °C. The same trend was observed by Haddad et al. [38] when they explored the effect of pyrolysis temperature on biochar production yields from selected lignocellulosic biomasses. They suggested that temperature increase upgrades ash elemental concentrations relative to its yield.
3.1.3. Surface functionalities
The adsorption capacity of biochar produced from TFW depends on the chemical reactivity of functional groups at the surface. The FTIR spectra of three used biochars were compared and are given in Figure 3. The biochar peaks obtained were: The O–H symmetric stretching at 3230 cm−1 showed the presence of alcohol and carboxylic acid. An aliphatic asymmetric and symmetric stretching of C–H bond in CH2 and CH3 was observed at wavelength 2920.23 cm−1. The peak formed at 1616.35 cm−1, assigned to carboxyl C=N stretching, shows that amine groups stick to the surface of biochar [39]. The peak at 1519.91 cm−1 wavelength attributed to aromatic C=C bonds indicates the presence of unsaturated aryl substituent alkenes. The peak at 1404.18 cm−1 assigned to C–H bond confirms the aliphatic nature of biochar. The peaks at 1107 cm−1 formed due to C–O and C–C ring indicate the presence of alcohol and esters [40]. The spectra of all the studied biochars were relatively similar and no significant differences were noticed. The remaining peaks were 997.20 cm−1 C–H in plane bending, 871.82 cm−1 amines H–N, 746.45 cm−1 alkyl halide C–Cl, 673.45 cm−1 alkynes bend and 555.50 cm−1 alkyl halide C–Br. The resulting groups might enhance the adsorption process during the dye removal process and thus offer more fixation sites for dye molecule adsorption. Similar results were obtained by Palani et al. [41]. It was found that activated carbon derived from tannery fleshing compared to commercial activated carbon has more functional groups on the surface to trap the dye on the surface of adsorbent, which leads to higher adsorption capacity.
FTIR spectra of three tested biochar produced at different temperature.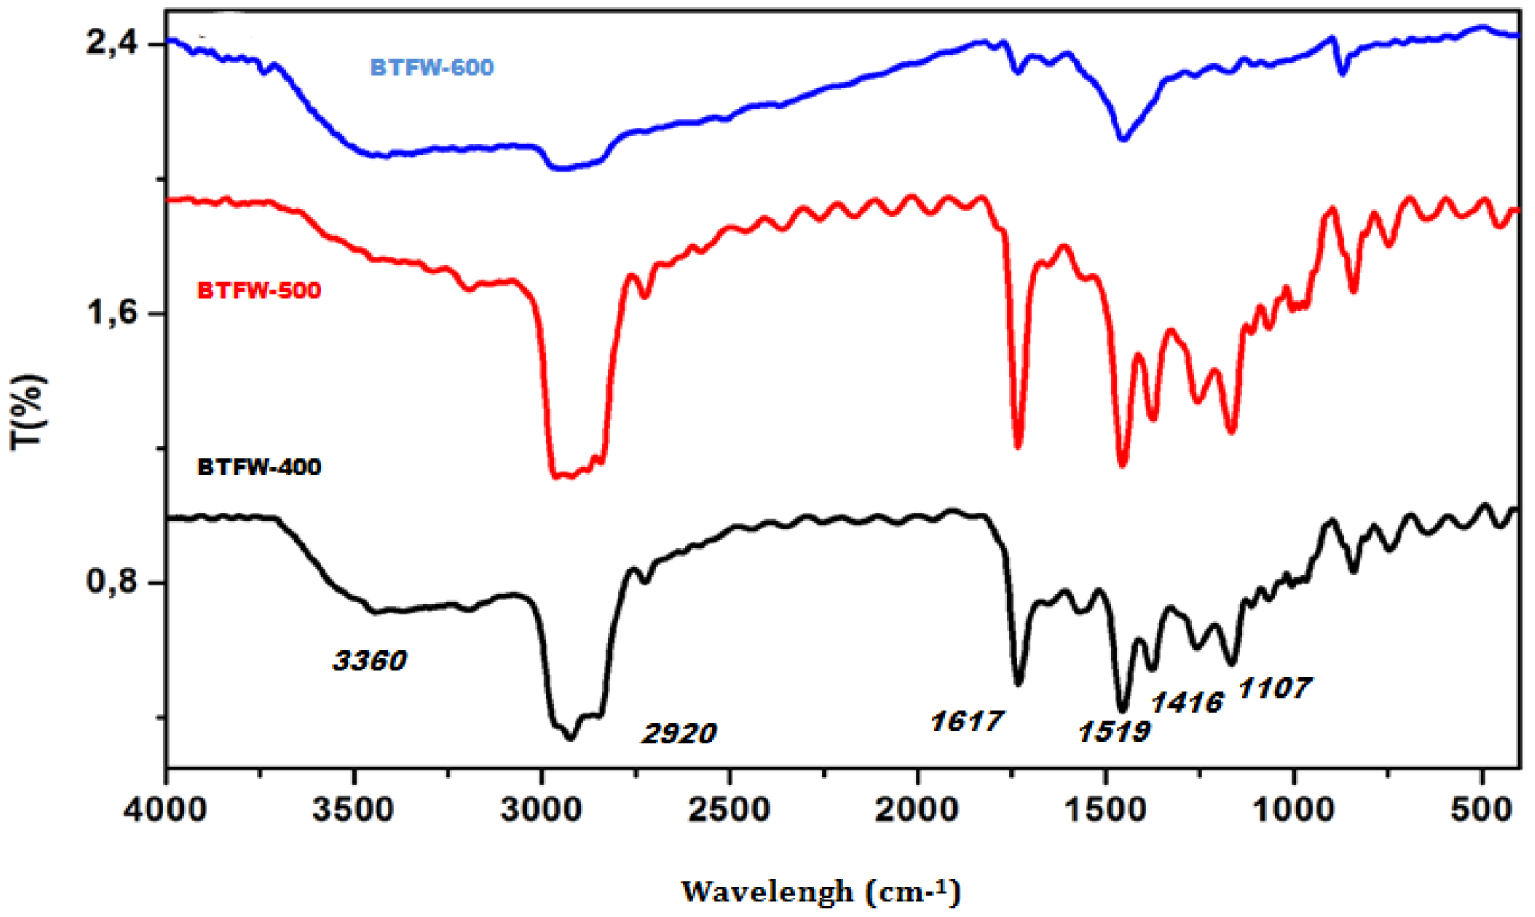
3.1.4. SEM analyzes
SEM analysis was employed to perceive the surface morphologies of the prepared biochars produced from TFW (Figure 4). The SEM image showed that BTFW has a homogenized surface mainly composed of spherical particles of 10 μm size that may be explained by the presence of high content of mineral deposited on the surface of biochars. Furthermore, Figure 4 reveals the presence of pores with different sizes. This high number of pores is expected to improve the rate of dye adsorption.
SEM observations of tested biochars produced at temperature of 500 °C.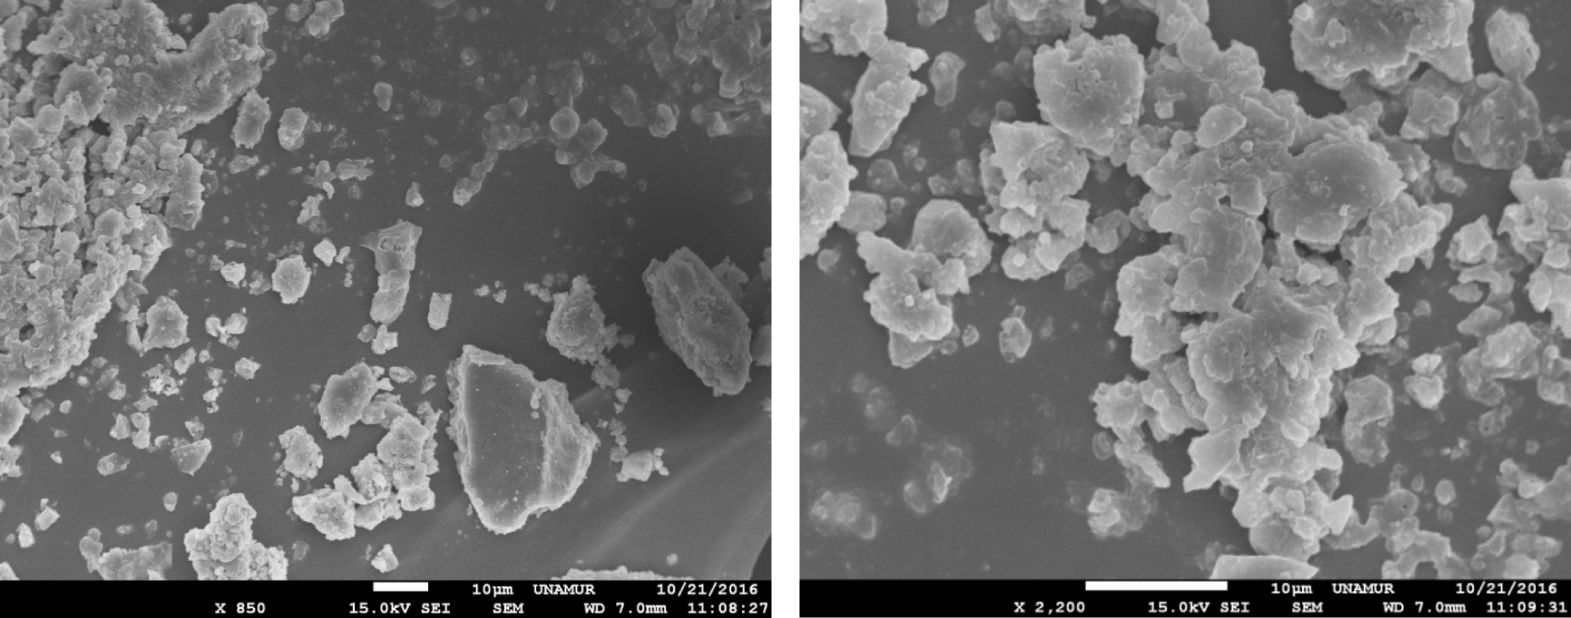
3.2. Batch sorption experiments
3.2.1. Kinetic studies of SFR dye removal
In order to determine the required adsorption equilibrium time of SFR onto three tested biochars as well as the probable involved mechanisms, a kinetic study was elaborated for contact times varying from 1 to 360 min at an initial dye concentration of 75 mg⋅L−1 for three tested biochars. As illustrated in Figure 5, experimental results showed that SFR adsorption process is clearly time dependent.
Effect of contact time on SFR dye adsorption by three tested biochars (C0 = 75 mg⋅L−1 pH = 6; dosage = 2 g⋅L−1; T = 20 °C).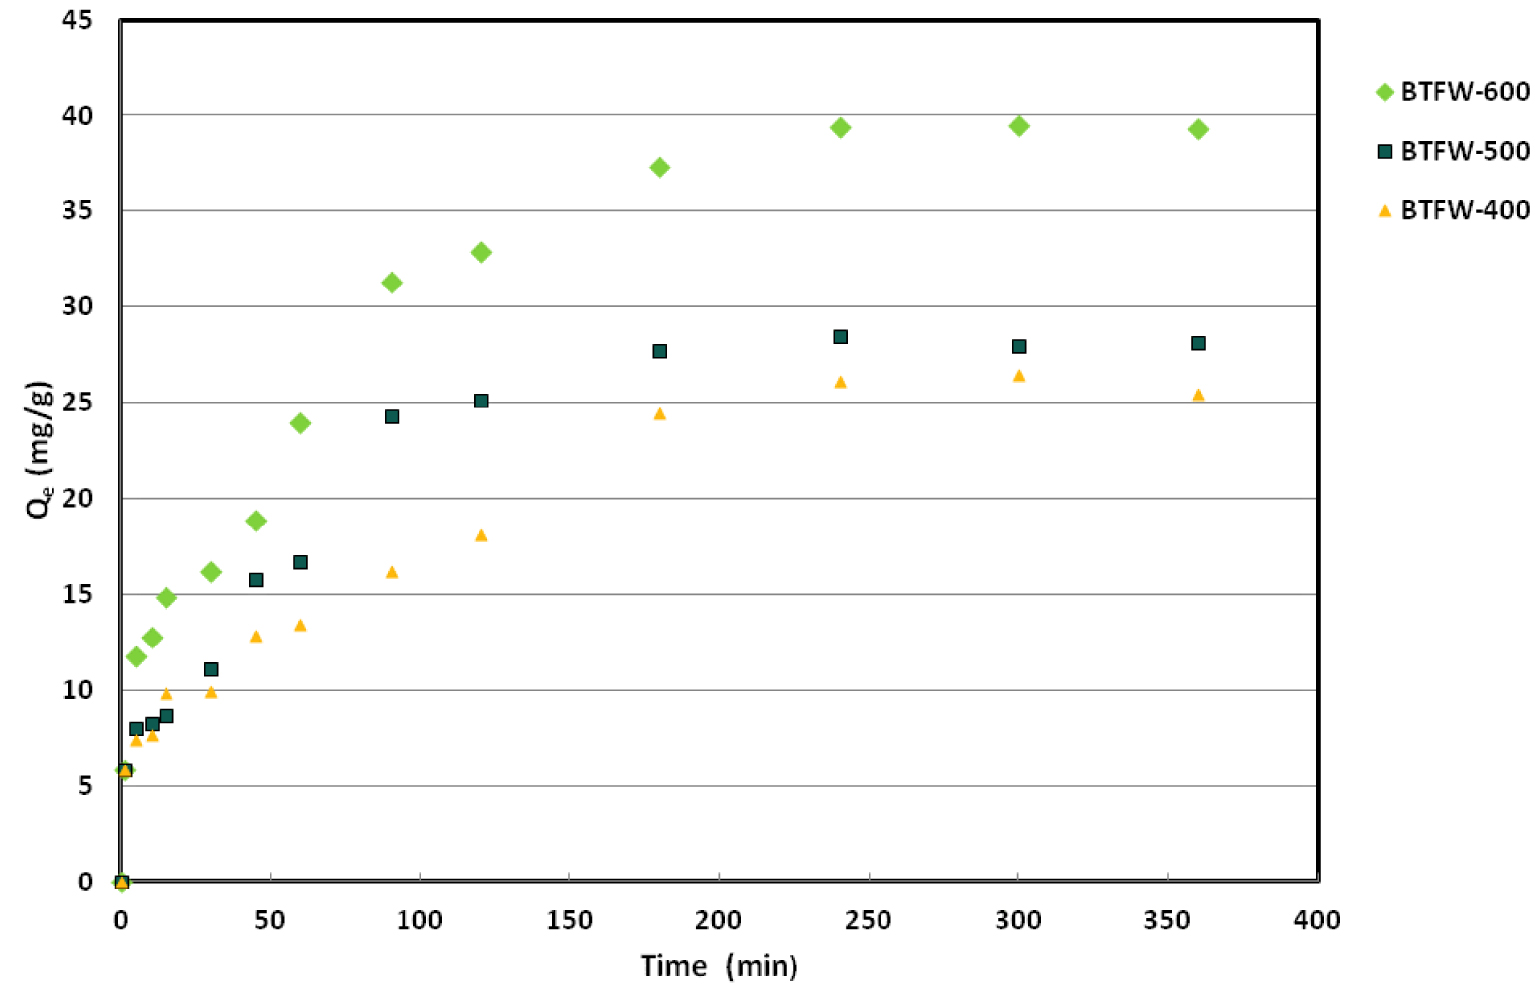
FTIR analyzes of BFTW-600 °C before and after SFR dye removal.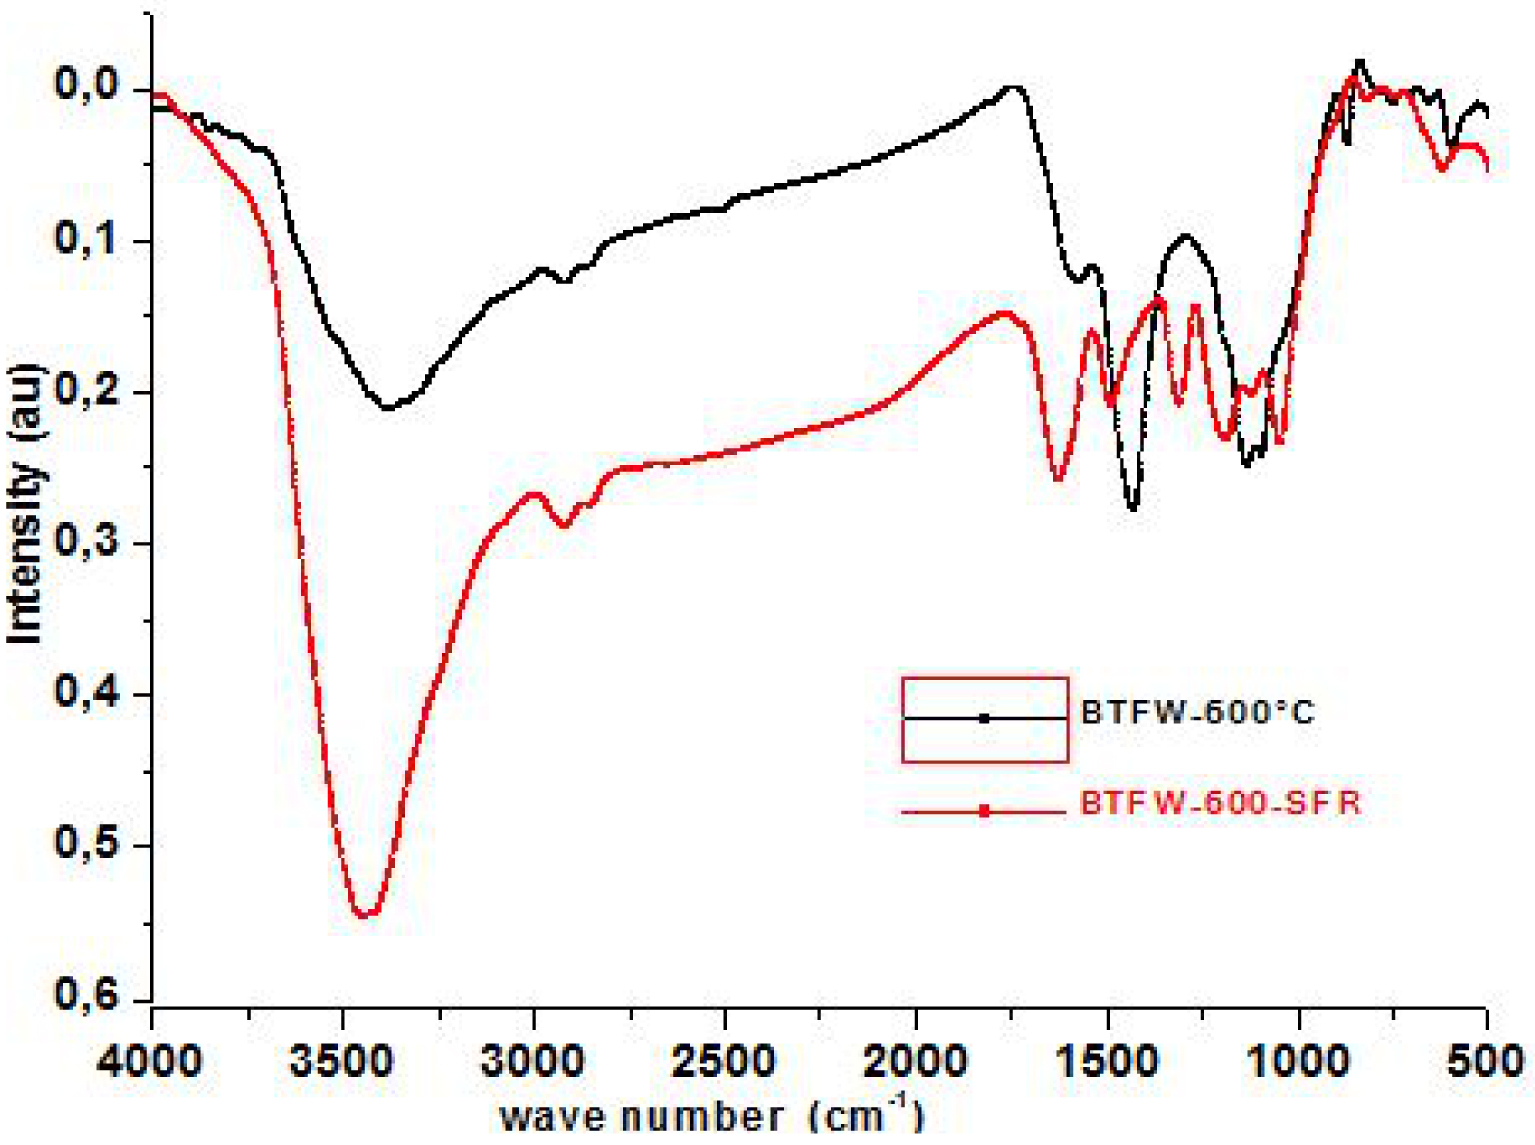
Indeed, the amounts of adsorbed SFR dye (qt) rapidly rose for contact times lesser than 90 min. At this moment, they attained about 63%; 79% and 86% of the whole adsorbed amounts for BTFW-400; BTFW-500 and BTFW-600, respectively. For duration greater than 90 min, the adsorbed SFR dye continued to increase but with a smaller slope. The equilibrium state, corresponding to quasi-constant amounts was observed at 240 min. The registered important red dye removal rate at the beginning of the assays could be attributed to the fact that SFR dye was mainly adsorbed at the exterior surfaces of the biochars. Afterwards, when the adsorption at the exterior surfaces of the studied biochars attained complete saturation, the SFR dye diffused inside the solid biochar particles and were adsorbed. This diffusion process is generally constituted of two steps: (i) the first one corresponds to dye diffusion through the boundary layer where the surface groups were saturated, then (ii) the second step is related to SFR dye diffusion through the intra-particle layer and the pores through the surface of the adsorbents for additional uptake [42]. It is important to underline that SFR dye adsorption efficiency at equilibrium significantly increased when raising the pyrolysis temperature. Indeed, the SFR dye amounts were determined to about 26; 28,52 and 39,86 mg/g mg⋅g−1 for, BTFW-400; BTFW-500 and BTFW-600, respectively. This behavior should mainly be due to the modification of the physicochemical properties of the biochars induced by the pyrolysis treatment, especially the surface areas, and functional groups, which suggests that chemisorption would be the main driving force for the removal of SFR dye. Therefore, the adsorption of SFR dye onto the BTFW might be due to (1) active sites formed during the pyrolysis process, (2) high specific surface area from the porous structure of BTFW-600, and (3) chemical bonding between biochar compounds and SFR dye.
In order to better understand the chemical interaction between the dye molecules and the surface of the tested biochars, the FTIR spectra of BTFW-600 °C and biochar-dye were analyzed. As shown in Figure 6, the adsorption peaks of dye-bound biochar at 1515, 1451, 1421, 1385, 1034, and 800–500 cm−1 display a changed intensity of adsorption compared to those of the dye-free biochar. These indicate that the—NH2, –OH, carboxyl, carbonyl, and alkyl functional groups are involved in the possible chemical adsorption process. According to some authors [18, 43] the possible actions in the intensities of the adsorption bands mentioned above can be attributed to: (1) hydrogen bond formation between nitrogen and oxygen containing functional groups of dyes and biochars; (2) π–π dispersion interaction between the aromatic rings in the dyes and biochars; (3) the interaction of sharing electron, in which the carbonyl oxygen present in biochar can act as electron acceptor and the aromatic ring of SFR dye can be as an electron acceptor; (4) the electrostatic interaction between dyes and biochars, which can be proved by the investigated results in the effects of pH.
SFR dye adsorption kinetic parameters of three tested biochars
| Sample | First order | Second order | |||||||
|---|---|---|---|---|---|---|---|---|---|
| K1 | qe,I | R2 | APE (%) | K2 | qe,II | R2 | APE (%) | ||
| BFTW-400 | 0.008 | 20.98 | 0.9270 | 9.20 | 0.0008 | 20.41 | 0.9668 | 2.65 | |
| BFTW-500 | 0.0200 | 26.199 | 0.9449 | 8.12 | 0.0007 | 33.00 | 0.9652 | 3.36 | |
| BFTW-600 | 0.0020 | 37.96 | 0.922 | 11.3 | 0.0009 | 40.32 | 0.9895 | 4.21 | |
SFR dye isotherms parameter of three tested biochars
| Sample | Freundlich | Langmuir | |||||||
|---|---|---|---|---|---|---|---|---|---|
| Kf | n | R2 | APE (%) | KL | Qm | R2 | APE (%) | ||
| BTFW-400 | 1.72 | 1.02 | 0.905 | 6.5 | 0.025 | 39.5 | 0.994 | 4.5 | |
| BTFW-500 | 2.56 | 1.13 | 0.919 | 12.6 | 0.03 | 53.8 | 0.996 | 3.7 | |
| BTFW600 | 4.50 | 1.37 | 0.858 | 15.6 | 0.18 | 62.7 | 0.999 | 2.6 | |
The SFR dye adsorption by the three tested biochars was fitted with the pseudo-first- and pseudo-second-order models. The related kinetic constant values of each model (K1 and K2), the correlation coefficients, R2, the predicted adsorbed dye amounts at equilibrium in comparison with the experimental ones are given in Table 3.
From Table 3, it could be clearly noted that the correlation coefficients calculated for both pseudo-first-order and pseudo-second-order models were relatively high, indicating a good fit to the experimental data [44]. However, the calculated amounts of removed SFR dye at equilibrium (qe,I) for all the tested biochars by the pseudo-first-order model were very low compared to the experimental ones and the related APE was important, presuming that SFR dye removal kinetics is not a pseudo-first-order process. On the contrary, the “qe,II” values corresponding to pseudo-second-order kinetic model were very close to the experimental data. Besides, its APE values were significantly lower than the ones determined for the pseudo-first-order kinetic mode. As a consequence, for all the tested biochars, the pseudo-second-order model is most appropriate for the restitution of the experimental data (Table 3). This finding suggests that SFR dye adsorption by biochars derived from TFW might be mainly a chemisorption process including electronic bonding between the surface biochars’ functional groups and the tested dye, since a similar finding has been reported [22] in which the adsorption and desorption of Congo red on biochars produced from leather shavings waste was investigated.
3.2.2. Effect of initial dye concentrations, isotherm modeling
The SFR dye uptake increased with increasing initial dye concentration. For instance, raising initial dye concentrations from 50 to 250 mg⋅L−1 allowed the BTFW-400, BTFW-500 and BTFW-600 to increase their recovery abilities from 14.52 to 33.9 mg⋅g−1 and from 16.2 to 36.62 mg⋅g−1 and from 19.11 to 59.54 mg⋅g−1, respectively (Figure 7). This trend could be explained by the fact that the higher the initial aqueous dye concentration, the higher the concentration gradient between aqueous solution and biochar particles, which results in more important diffusion rates. Furthermore, for high initial aqueous concentrations, the contact probability between SFR dye contained in the aqueous phase and the adsorbent might be more privileged. The Langmuir and Freundlich constants, the corresponding correlation coefficients and APE are presented in Table 4. For all the tested biochars, the highest regression correlation coefficients (0.996) and the lowest APE values (13.8%) were observed for Langmuir model. Thus, this model successfully fits the experimental data (Figure 7). This finding suggests that SFR adsorption by the tested biochars occurs on a uniform surface with constant energy. The SFR dye Langmuir’s adsorption capacity, qmax, of BTFW-400, BTFW-500 and BTFW-600 were assessed to about 39, 53.8 and 62.7 mg⋅g−1, respectively, confirming that the increase in pyrolysis temperature positively impacts the biochar’s ability of red dye adsorption from aqueous solutions. The Langmuir’s coefficient values (RL = 1∕(1 + KLC 0,SFR)) for the studied aqueous concentrations range varied from 0.12 to 0.35 for BTFW-400; from 0.13 to 0.33 for BFTW-500 and from 0.01 to 0.2 for BFTW-600, respectively. These values are low, showing that the SFR dye adsorption by these biochars is a favorable process. About Freundlich model which supposes the presence of a heterogeneous surface, its APE values were higher than the ones determined for Langmuir’s model (Table 4 and Figure 7). On the other hand, the Freundlich exponent “n” values were estimated to 1.02, 1.13 and 1.37 for BFTW-400; BFTW-500 and BFTW-600, respectively (Table 4). These values were in the range of 1–10 which indicates a favorable adsorption of SFR dye by the used biochars. In order to situate the biochars generated from TFW efficiencies in recovering dye from aqueous solutions, a comparison with other biochars based on Langmuir’s maximal recovery capacity “qmax” or otherwise its capacity at a given aqueous concentration was carried out (Table 5). According to this table, BTFW-600 has relatively higher recovery capacities compared to various biochars. As a consequence it could be considered as an attractive and promising material for red dye removal from aqueous solutions.
SFR at equilibrium by the biochars produced from TFW at different temperatures and their fitting by Langmuir and Freundlich isotherm models (contact time = 240 min; pH = 6; dosage = 2 g⋅L−1 , temperature = 20 °C).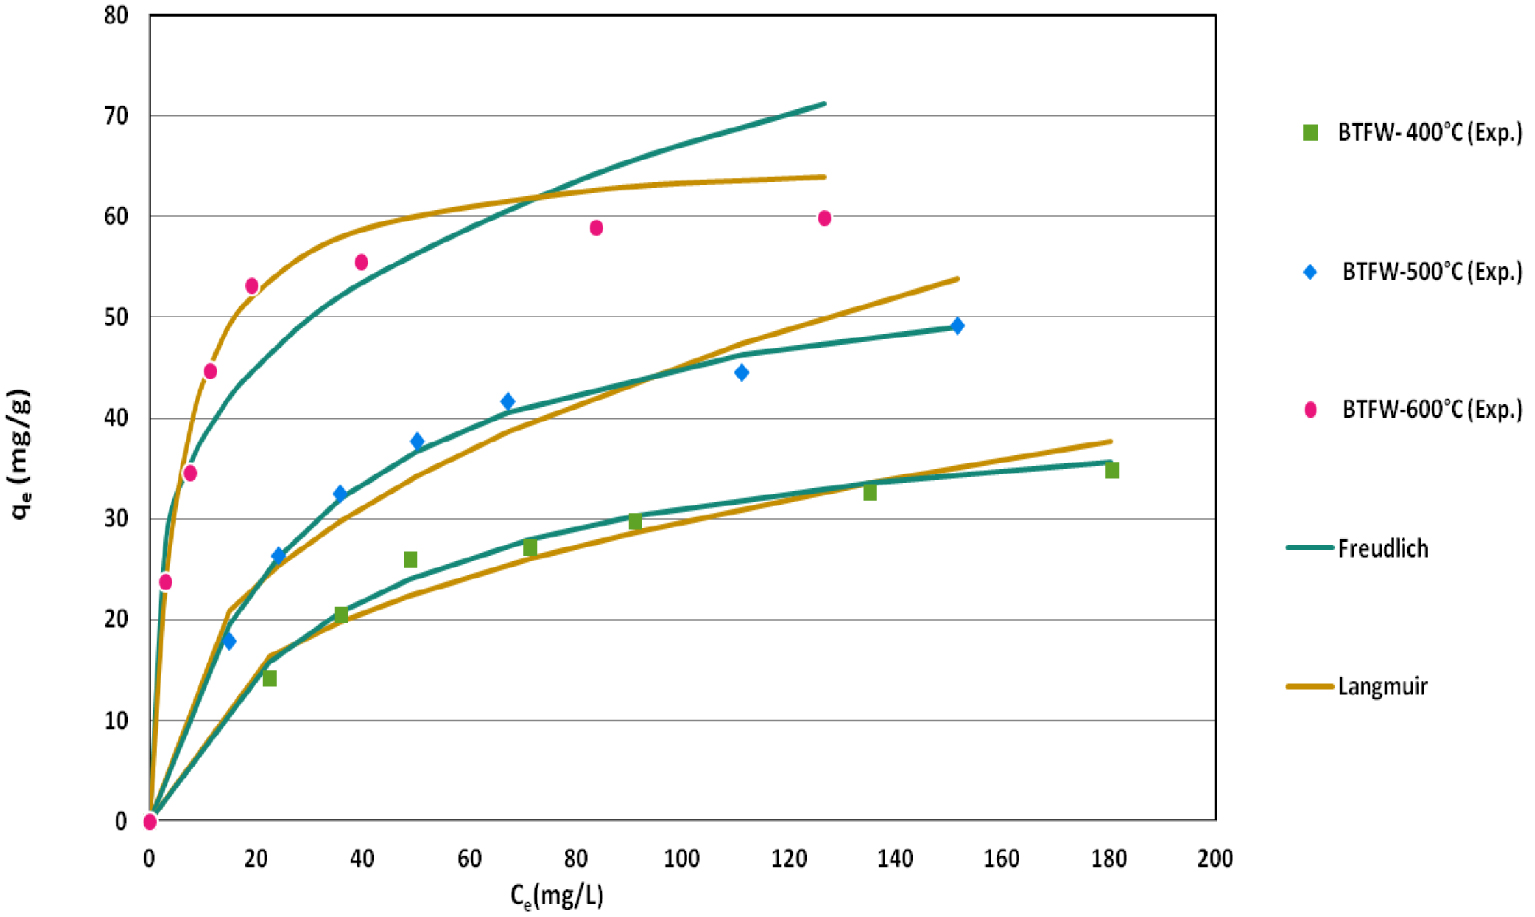
Effect of pH on SFR dye removal by three tested biochars (C0 = 75 mg⋅L−1; dosage = 2 g⋅L−1; T = 20 °C).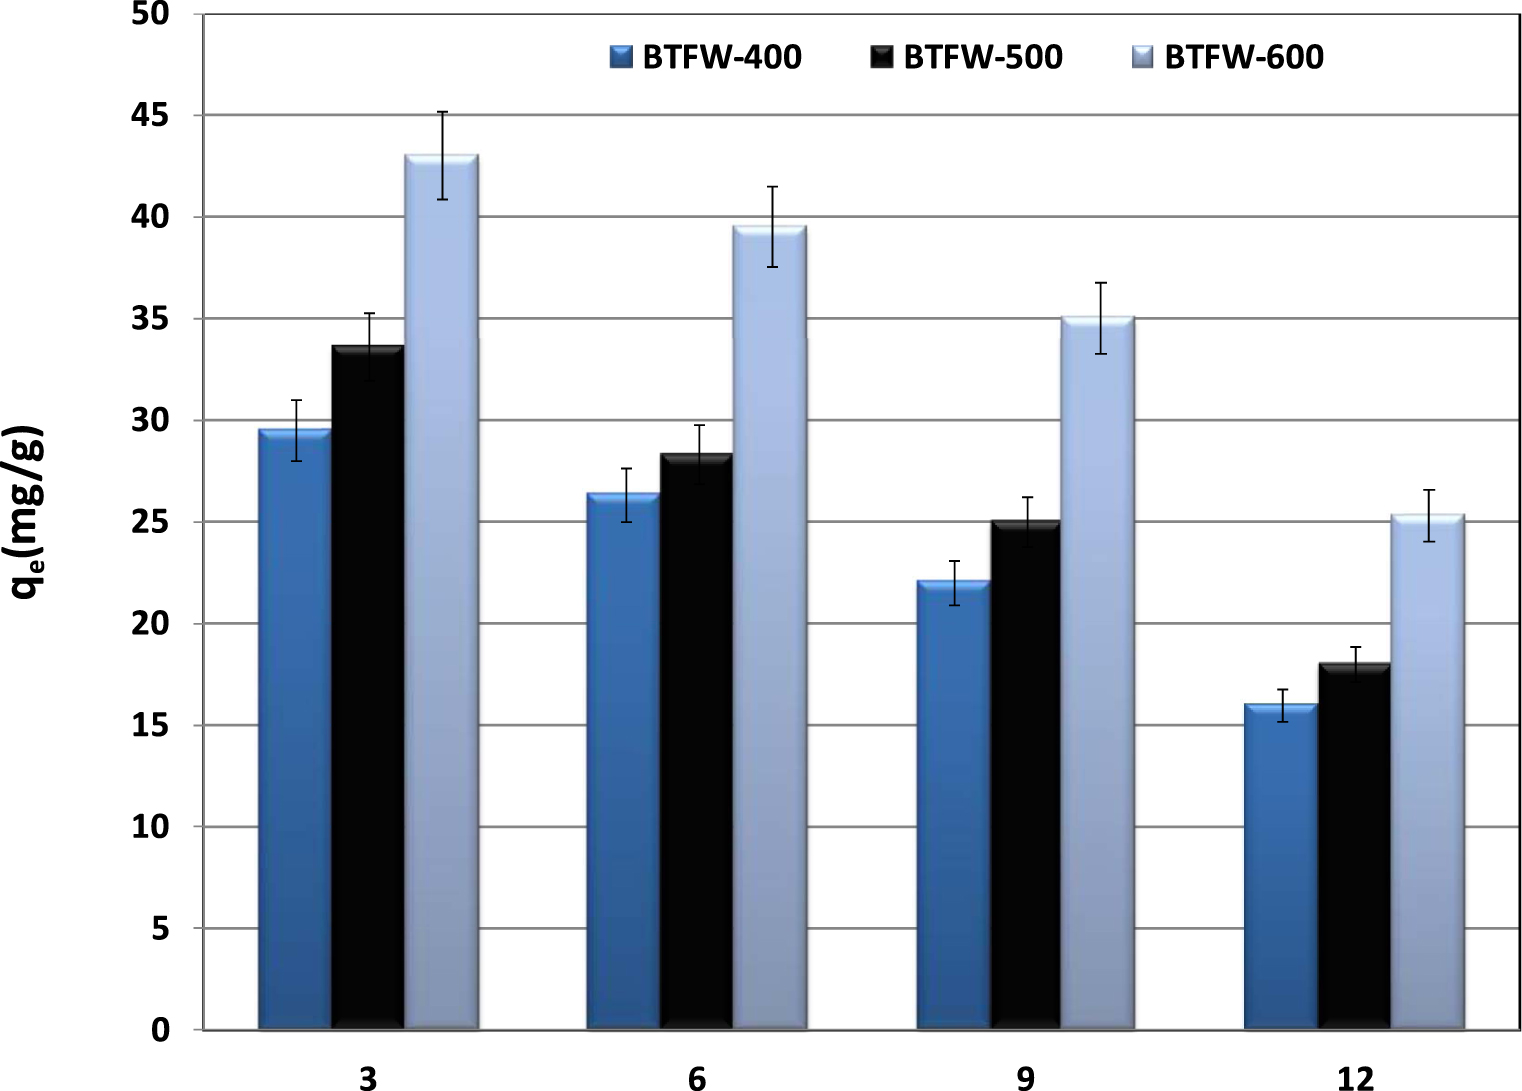
Comparison of red dye by biochars generated from the pyrolysis of TFW with other biochars
| Biochar | Dyes | Adsorption capacity (mg⋅g−1) | Reference |
|---|---|---|---|
| Biochar from chrome-tanned leather shavings | Acid Black 210 | 44.4 | [45] |
| Bamboo hydrochars | Congo red | 33.7 | [46] |
| Vermicompost-derived biochars | Congo red | 20 | [43] |
| Calcium-rich biochar from crab shell | Congo red | 20.317 | [47] |
| Biochar from liquefaction of rice husk with water | Malachite green dye | 46.6 | [48] |
| Coir pith carbon | Congo red | 6.7 | [49] |
| Biochar produced from TFW at 600 °C | SFR dye | 62.7 | This work |
Effect of biochar dosage on SFR removal by the three tested biochars (C0 = 75 mg⋅L−1; pH = 6; T = 20 °C).
3.2.3. Effect of pH
The effect of initial aqueous pH on SFR dye removal by three tested biochars was performed according to the experimental conditions given in Section 2.5. Figure 8 showed that the initial aqueous pH plays an important role in removing SFR dye from aqueous solutions by the three tested biochars. Indeed, the biochars’ removal capacities significantly decreased when increasing the initial pH. For example, for BTFW-600, for an initial concentration of 75 mg⋅L−1, the removed dye amounts decreased from about 42.9 mg⋅g−1 at an initial pH of 3 to less than 35.9 and 25.6 mg⋅g−1 for initial pH values of 9 and 12. This trend is in concordance with those reported when investigating Congo red removal by vermicompost biochar [43] and biochar from crab shell [47]. The pHZPC is an important parameter to describe the adsorption behavior of the tested dye. The pHZPC of BTFW-400, BTFW-500 and BTFW-600 were 8.5, 9.25, and 10.3, respectively. It is well known that electrostatic attraction exists between the negative charge of the anionic dye and the protonated –OH and –COOH groups on the surface of the biochars as pH was lower than pHZPC. Therefore, the lower pH below the pHZPC will facilitate adsorption. When the pH was higher than pHZPC, the functional groups of the biochars were completely deprotonated and the electrostatic attraction was weakened with the pH increase, resulting in the decrease of SFR adsorption. In addition, the OH− ions in the solution compete with the anionic SFR molecules for the adsorption sites, leading to a decrease in adsorption of the anionic dye at higher pH, especially in alkalinity.
3.2.4. Influence of biochar dosages
The effect of the used biochar dosages on SFR dye efficiencies was determined under the experimental conditions cited in Section 2.5. Results (Figure 9) indicated that for all the tested biochars, the SFR removal efficiencies increased with the increase in biochar dosages. Moreover, all the tested biochars could be considered as promising materials for SFR dye since even for a small dosage (5 g⋅L−1), relatively high efficiencies of 97%, 88%, and 70% were registered for BTFW-600, BTFW-500, and BTFW-400, respectively. A complete SFR dye removal was obtained with low biochar dosage of 8 g⋅L−1 for the three tested biochars, which confirms the attractiveness of the used biochars. Therefore, the three tested biochars could be considered as interesting products for red dye removal from solutions compared to coffee-waste-activated biochar [50] and commercial activated carbon [51], where solid dosages of 20 and 10 g⋅L−1 were needed to ensure significant efficiencies. This finding is linked also to the existence of important available active sorption sites.
Thermodynamic parameters for SFR adsorption onto the three tested biochars
| 𝛥S° (kJ/mol/K) | 𝛥H° (kJ/mol) | 𝛥G° (kJ/mol) | qe (mg/g) | ||||||||
|---|---|---|---|---|---|---|---|---|---|---|---|
| 293 K | 303 K | 313 K | 323 K | 293 K | 303 K | 313 K | 323 K | ||||
| BTFW-400 | 27.3 | 21.98 | 1.65 | 2.32 | 3.25 | 4.33 | 26.1 | 28.6 | 32.6 | 37.6 | |
| BTFW-500 | 46.8 | 23.35 | 2.65 | 2.77 | 3.87 | 5.36 | 28.9 | 31.5 | 35.6 | 40.5 | |
| BTFW-600 | 49.32 | 25.65 | 2.99 | 3.25 | 4.36 | 5.87 | 39.8 | 43.5 | 46.6 | 50.98 | |
3.2.5. Thermodynamic parameters
Effect of initial pH on SFR dye removal, BTFW-600 °C desorption from BTFW-600 °C (dose = 1 g/L; contact time = 2 h; temperature = 20 ± 2 °C).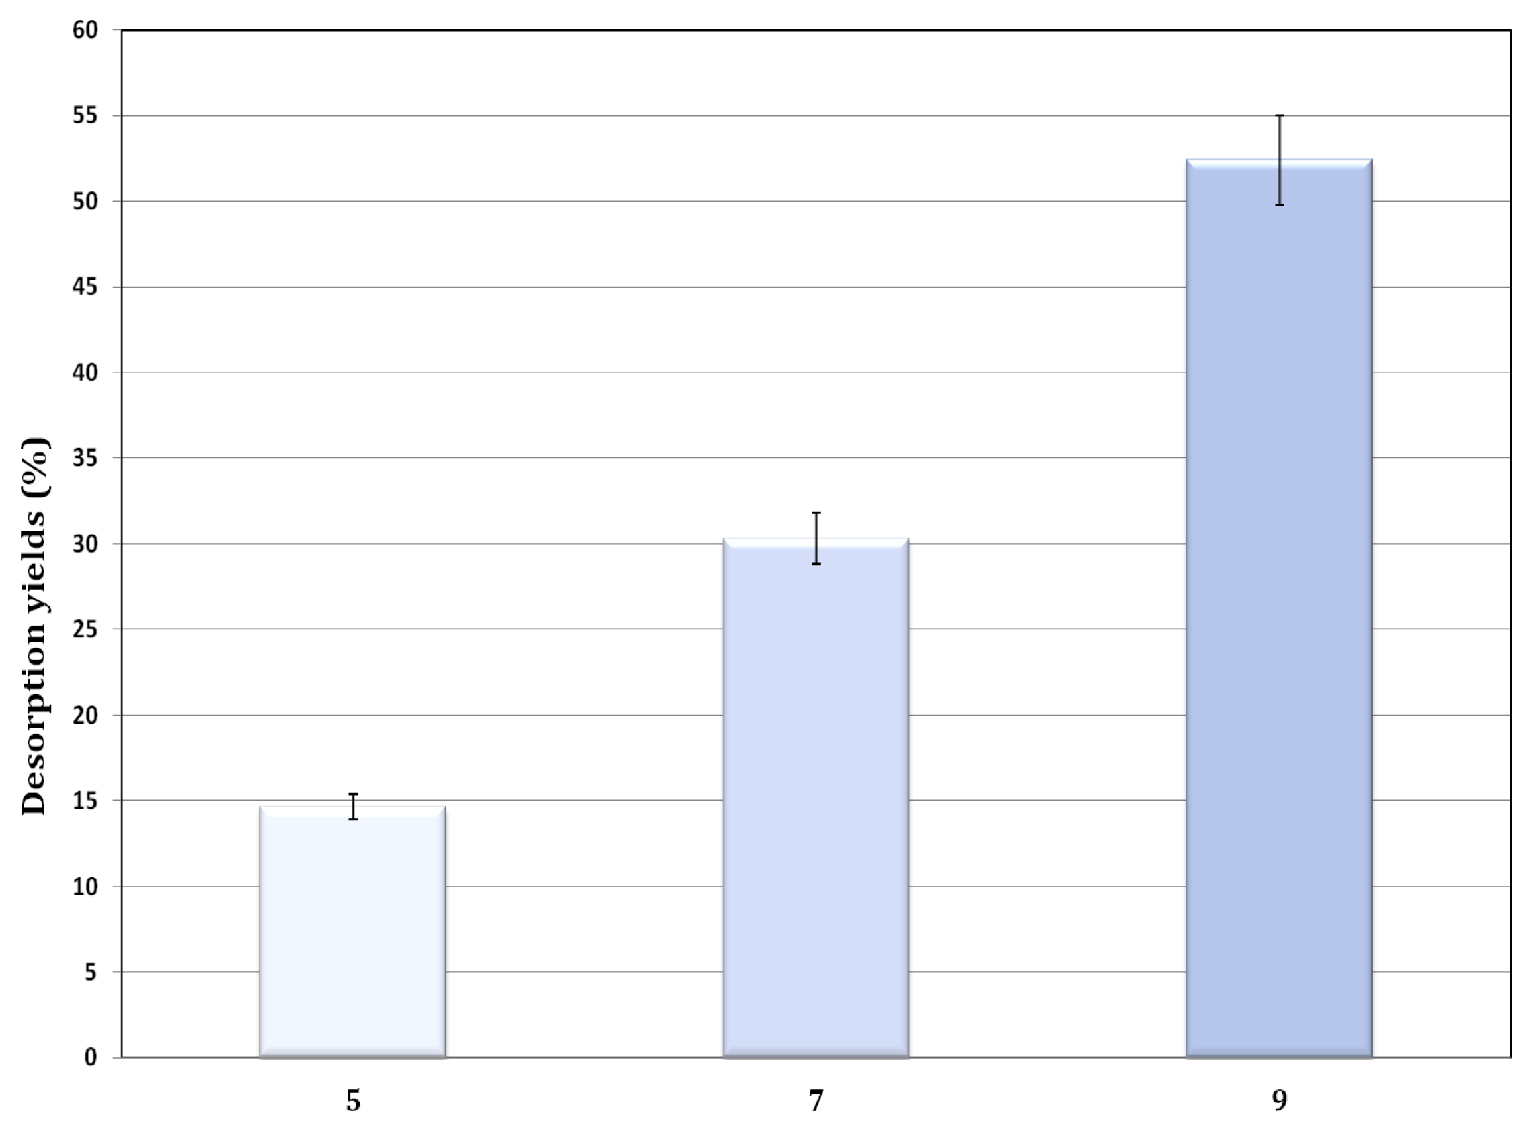
The effect of temperature is another significant physicochemical parameter because any change in the temperature of reaction will directly contribute to the change in the adsorption efficiency and capacity of the adsorbent. The selected temperature values were set at 20, 30, 40, and 50 °C, and the results of this study is shown in Table 6. For the three biochars, adsorbed amounts increased with increase in temperature (Table 6). It rises from 39.8 mg/g at 20 °C to 50.98 mg/g at 50 °C for BTFW-600 °C. Increase in temperature may increase the rate of diffusion of the adsorbate molecules across the external boundary layer and in the internal pores of adsorbent particles and may decrease the viscosity of the solution [52]. The thermodynamic parameters associated with adsorption processes, namely standard free energy changes 𝛥G° (kJ/mol), enthalpy 𝛥H° (kJ/mol) and entropy changes 𝛥S° (kJ/mol/K), were investigated for a better understanding of the probable mechanisms leading to SFR sorption onto the three tested biochars. These parameters were calculated according to the following equations:
| (4) |
| (5) |
| (6) |
3.3. Desorption test
UV–Visible spectra of tannery wastewater before and after 4 h of treatment.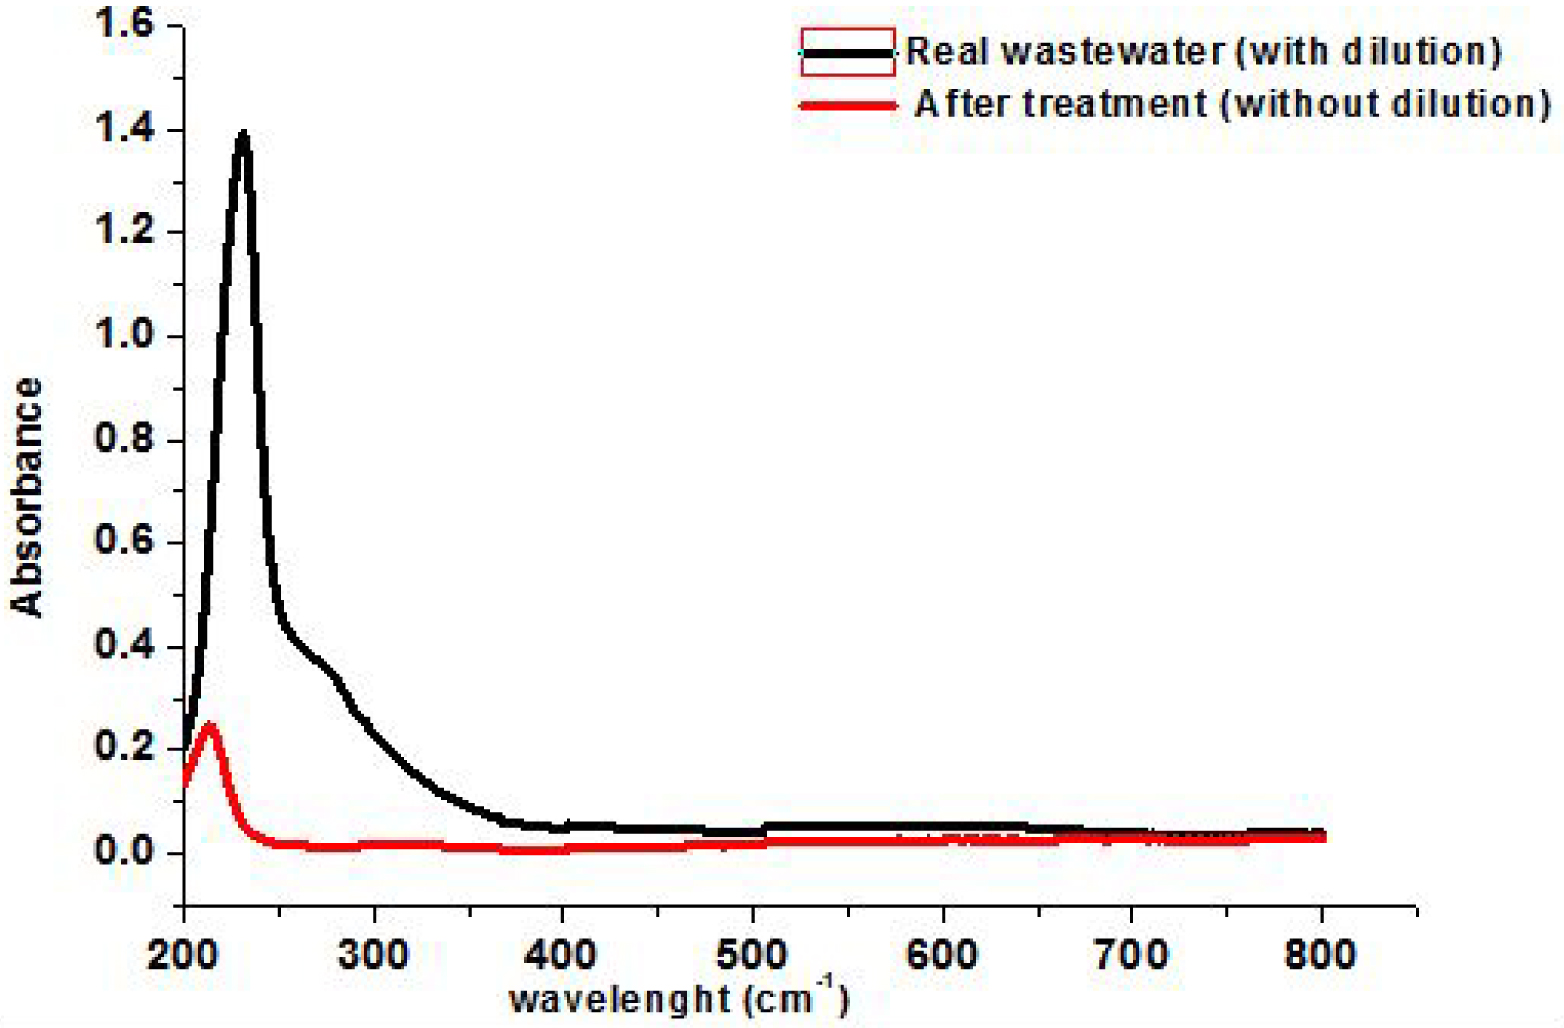
The SFR desorption experiments were performed according to the experimental procedure presented in Section 2.6. The results, reported in Figure 10, showed that SFR dye desorption percent yields for BTFW-600 increase with increasing alkalinity of the used solutions. The desorption slowly increased from 14.66 to 52.4% with pH changing from 5 to 9. This regeneration yield could be significantly improved if successive cycles were applied. This finding could be attributed to the fact that the adsorption is dominated by electrostatic interaction and hydrogen bonding in the adsorption process [55, 56]. The fact that these adsorbents have the ability to be easily regenerated, confirms that they could be considered as attractive and promising materials for anionic dye removal from aqueous solution. Similar results were obtained by Faheem et al. [57], who studied desorption of Congo red from biochar derived from Corncobs agricultural waste. The results confirmed that alkaline medium (NaOH) constitutes the best desorbing agent as it has the highest desorption efficiency of over 70%.
3.4. Batch experiments for SFR dye removal from real wastewaters
For further valorization of the studied biochar produced from the TFW, the adsorption of real textile industry effluent, containing SFR dye as the main dye, was investigated to assess the effectiveness of the treatment.
Main physicochemical characteristics of the used real wastewater before and after treatment
| Parameter | Before treatment | After treatment | Tunisian standard |
|---|---|---|---|
| Temperature (°C) | 18 | 19 | – |
| pH (–) | 7.3 | 7.87 | 5.5–8.5 |
| Electrical conductivity (mS/cm) | 7.14 | 6.2 | 5 |
| Color | Red | Colorless | Clear |
| COD (mg⋅L−1) | 43 | 2 | 250 |
| BOD5 (mg⋅L−1) | 11 | 10 | 50 |
| Total solid (mg⋅L−1) | 10 | 5 | 80 |
| Cl (mg/L) | 1.74 × 10³ | 10 | 1200 |
| Total chromium (mg/L) | 0.293 | – | <0.2 |
The effluent was characterized by determining its pH, conductivity, color, COD, BOD5, total solids, chloride and total chromium. The values of these parameters along with the Tunisia regulation are given in Table 7. The solution of the studied wastewater has a red color, a sign of the presence of a significant load of dye and suspended solids (MES). Table 7 shows that the effluent has a pH of about 7.2 and therefore does not require any neutralization. A conductivity of around 7.14 ms⋅cm−1 at 22 °C is explained by the high content of chloride. Likewise, the effluent has a very low value of biological oxygen demand (BOD5) which is equal to 11 mg⋅L−1 and a chemical oxygen demand (COD) of 45 mg⋅L−1. The values of these two parameters indicate that the effluent is not too loaded with organic and mineral matter due to the physicochemical precipitation and biological treatment of real effluent conducted in the wastewater treatment plant of TMM industry. Red dye from real wastewater collected from a TMM industry has been performed using different doses of BTFW-600, since it has exhibited more efficiency compared to BTFW-500 and BTFW-400. The adsorption studies were conducted using 100 mL of textile wastewater with 2, 10, 15, 20, and 25 g⋅L−1 of BTFW-600 for 4 h of reaction time at 25 °C. The measurement of absorbance after treatment shows that 15 g⋅L−1 of BTFW-600 is the optimal dose. Figure 11 shows the absorbance spectra of the initial solution, after being diluted 50 times, and after 4 h of effluent treatment (without dilution), which clearly indicates its total discoloration. The main characteristics of textile wastewater after treatment are presented in Table 6. Besides the elimination of color, adsorption using BTFW-600 °C drastically decreases the significant characteristic parameters of the effluent. This treatment decreases the COD value and Cl concentration by about 98% and 90% respectively. Hence, except for the conductivity, the treated effluent has all the characteristic properties well within the specific limit values of rejection by textile industries. Only additional treatment is required in terms of conductivity to comply with the Tunisian regulations for the discharge.
4. Conclusion
The present work proved that biochars produced from TFW could be considered as highly effective, attractive and promising materials for dye removal from solutions compared to various previously studied biochars in term of both rapid kinetic and equilibrium recovery capabilities. The relatively high SFR dye desorption yields allow us to consider this low-cost material as an attractive solid matrix for the removal of basic dyes from aqueous solutions with the possibility of multiple reuse. For further application, 15 g⋅L−1 was found to be the optimum amount of biochar to treat the real wastewater. Besides the elimination of color, adsorption on biochar decreases drastically the main characteristic parameters of the effluent. Parameters are within the specified limit values of rejection by the textile industries except for the conductivity of the effluent. Hence, the biochar produced from the pyrolysis of TFW can be used efficiently for the treatment of textile effluents containing mainly SFR dye. It would be interesting to continue testing on real wastewater using not only batch processes but also column processes, on the pilot scale.
Conflicts of interest
Authors have no conflict of interest to declare.