


 CC-BY 4.0
1. Introduction
Contaminated effluents discharged by textile, paper, plastics, and dye industries are the main sources of aquatic pollution [1]. These industries generally generate huge amounts of wastewaters that contain mixture of organic and inorganic chemicals that potentially threat the environment quality [2, 3] as well as public health [4, 5]. For this reason, the treatment of these effluents has been identified as a global environmental concern. Color, which is mainly due to the presence of dyes, is one of the first aspects to be inspected when dealing with wastewater [6]. Even in small quantities (less than 1 ppm for some of them), dyes can be easily detected [7], and potentially toxic to humans and animals [8]. The RB and VBB, as cationic dyes, are widely used as coloring agents in several industries [9]. Their efficient removal from aqueous solutions is therefore a critical issue that has to be seriously taken into consideration.
Many techniques have been suggested for the removal and separation of dyes from contaminated waters, including photo-degradation [10] coagulation [11], electro-oxidation [12, 13, 14], and membrane filtration [15]. The real implementation of these technologies is generally hindered by several drawbacks including high capital and exploitation costs, sensitive operational conditions, use of large amounts of chemicals, and the presence of a secondary sludge or byproducts that have to be additionally treated [16].
Adsorption [17, 18] has been identified, these last decades, as an attractive method, liable to be used separately or in combination with other technologies for efficient dyes removal from aqueous solutions [19]. The main advantages of adsorption compared to other technologies are simplicity, low cost, and efficiency [20].
Several organic and inorganic adsorbents such as clays [21, 22], activated carbon [23, 24], cellulose [25, 26, 27], carbon nano-tubes [28], magnetic composites [29], bio-composite [30, 31], bio-wastes [32, 33, 34], industrial by-products, and natural materials such biopolymers, have been utilized in dye removal [35, 36]. The use of raw agricultural materials, without any modification, is however highly recommended in order to limit the treatment cost.
In Tunisia, date palm oases generated huge amounts of biomass that can be valorized as a low cost material for wastewater treatment in general and dyes removal in particular. Indeed, more than 4.3 million date palm trees exist in the southern part of Tunisia occupying an area of almost 42,000 ha [37]. Nowadays, there is no specific management option of the produced wastes in these oases. Indeed, the majority of these biomasses are generally thrown away or openly burned raw which induces serious environmental risks.
Date palm wastes have been applied as raw materials for the removal of both organic and inorganic pollutants form wastewaters [38]. Other studies have focused on the synthesis of activated carbons from these wastes and their application for the removal of a wide range of pollutants such as chromium, phenol, methylene blue etc … [39, 40, 41, 42]. However, the majority of these studies investigated the behavior of a single contaminant without an important accent on the involved mechanisms. Moreover, RB and VB removal studies are relatively rare compared to other common dyes such as methylene blue and methyl orange. Specific studies dealing with the impact of the presence of mixed dissolved dyes on their removal efficiency from effluents are of great interest.
VBB and RB chemical structures.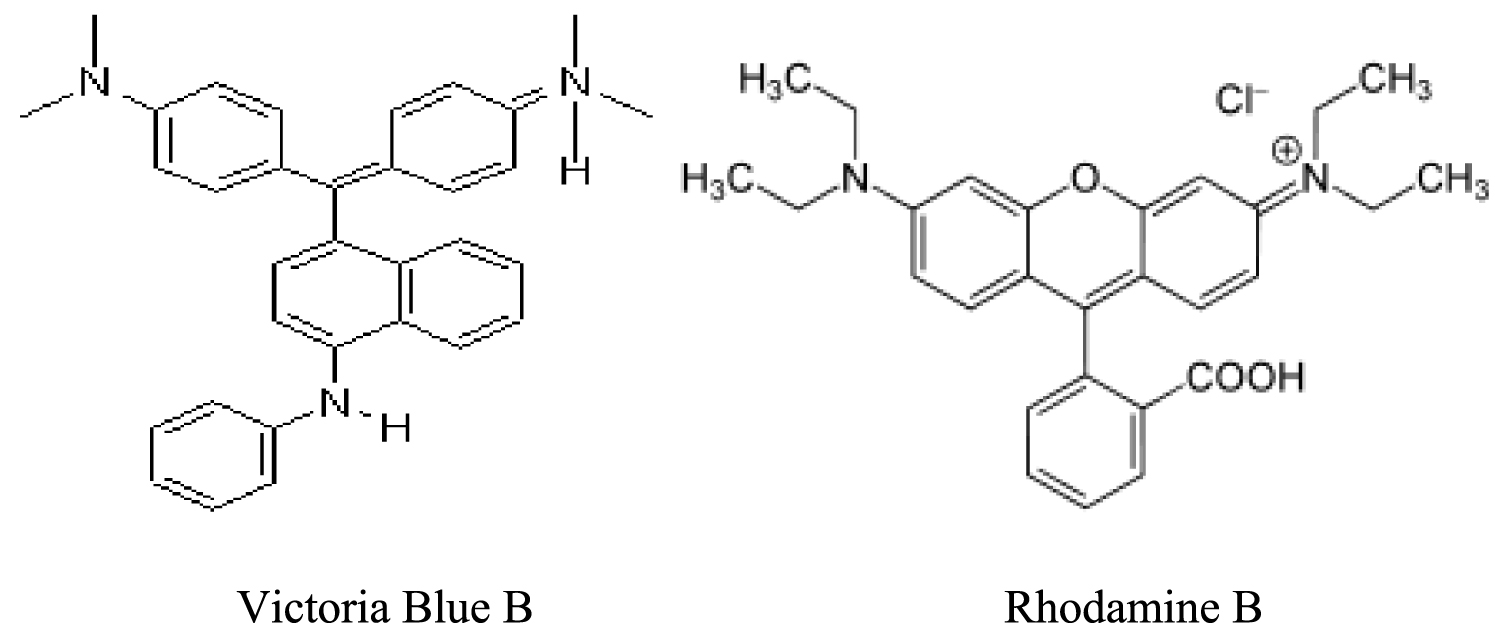
The present work mainly aims to highlight the effect of the competition process between RB and VB on their removal from aqueous solutions by an abundant biomass (petiole palm tree wastes). For this aim, these two basic dyes removal efficiency from aqueous solutions was precisely assessed in single and binary systems under various experimental conditions such as contact time, pH, initial concentration, adsorbent dose, and temperature. The involved mechanisms were explored through kinetic and isotherm modeling as well as Fourier Transform Infrared (FTIR) analyses.
2. Materials and methods
2.1. Adsorbent preparation and characterization
The petiole palm tree waste used in this study was collected from the region of Gabes, southern region of Tunisia. It was ground and sieved in order to obtain a homogenous particles distribution. The mean size of the material is 250 μm. The obtained raw material was not subjected to any form of pretreatment before its use as an adsorbent for dyes removal from aqueous solutions.
The preliminary raw material characterization has targeted the determination of its zero-point charge pH (pHPZC), at this point the surface charge of the adsorbent was neutral. This parameter was determined according to the approach given by Hammani et al. [43] for initial pH varying from 2 to 12. Besides the main functional groups of this adsorbent was performed through Fourier transform infra-red (FTIR) spectroscopy using a Brunker-tensor 27 spectrometer.
2.2. Dye solution preparation and analysis
Rhodamine B (chemical formula (CF): C28H31ClN2O3; molar weight (MW) = 479.01 g⋅mol−1) and Victoria blue B (CF: C33H32ClN3; MW = 506.09 g⋅mol−1), used in this study for the preparation of the synthetic solutions, were purchased from Acros-Organics from (USA). Their molecular structures are represented in Figure 1. These dyes were used as supplied, without any prior purification.
During the adsorption tests, two stock solutions of RB and VBB of 1000 mg⋅L−1 were prepared and used for solutions preparation at desired concentrations. The efficiency of the adsorbent in removing RB and VBB under the different experimental conditions was determined through the assessment of their absorbance at wavelength values of 553.2 and 614.5 nm, respectively, using an UV spectrophotometer (Genesys 10S UV–Vis).
2.3. Adsorption experiments
RB and VBB adsorption experiments were conducted in a 2 L batch reactor provided with a water circulation arrangement to maintain the temperature at the desired value [44]. These experiments consisted in mixing given masses of the adsorbent in 1 L of synthetic solution containing these dyes at a desired concentration in single or binary modes for a fixed contact time. These mixtures were stirred with an electromagnetic stirrer (Kika-Werke-RT 10 Power) at a constant speed of 200 rpm. The remaining dissolved RB or VBB concentrations were determined using the above cited UV–visible spectroscopy apparatus after centrifugation at 2000 rpm for 5 min with a CENTROMIX mod S-549 apparatus.
All these assays were performed in triplicate and the mean values were reported in this study. The standard deviation for all assays was lower than 5%.
2.3.1. Effect of initial pH
The influence of the pH on the adsorption of a series of colored solutions at 20 mg⋅L−1 in RB and VBB was monitored. The pH of the solutions was adjusted to values ranging from 3 to 8 since the behavior of the VBB used is considerably dependent on the pH of the water: at pH < 8, it is blue in color, but at pH > 8 it acquires a red color. The pH of the solutions has been adjusted by adding a few drops of HCl (0.1 N) or NaOH (0.1 N) solutions and the adsorbent dose used was fixed at 0.1 g/L. The mixtures were then stirred at 200 rpm for 3 h at room temperature 25 °C. The residual dye concentrations were determined by the spectrophotometer analysis.
2.3.2. Effect of contact time- kinetic study
The kinetic adsorption of RB and VBB by the raw PTW biomass in single and binary modes was assessed at times ranging between 5 and 120 min. These assays were carried out for initial dye concentrations ranging between 10 and 50 mg⋅L−1 in single mode and from 6 to 14 mg⋅L−1 in binary mode, a constant adsorbent dosage of 0.1 g⋅L−1, and a fixed pH of 4 for both RB and VBB. The RB or VBB adsorbed amounts at a given time “t”, (qt) (1) and the corresponding removal yield (Yt) (2) were assessed as follows:
| (1) |
| (2) |
The RB and VBB adsorption kinetics measured data were fitted to three well-known models (Table 1), namely pseudo-first order (PFO), pseudo-second order (PSO), and Elovich. The original and the linearized equations of these four models are extensively cited in literature [45, 46].
Used kinetics models for the study of RB and VBB removal by PTW
| Model | Equation |
|---|---|
| Pseudo first order | |
| Pseudo second order | |
| Elovich |
With: qt adsorbed amount at given time t (mg/g), k1 pseudo first order model constant (min−1), k2 second-order model constant (g∕mg⋅min−1), qe equilibrium dye concentration on adsorbent (mg/g), t time (min), 𝛼 Initial adsorption rate (mg/g), 𝛽 Desorption constant (g/mg) during every one experiment.
The agreement between the measured and the calculated adsorbed amounts was determined according to the estimated values of the determination coefficients as well as the calculated average percentage errors (APEkin (3)):
| (3) |
2.3.3. Effect of initial dye concentrations—isotherm study
The effect of the initial dyes concentrations on their removal by the PTW was assessed at equilibrium for a contact time of 3 h, a pH of 4 and an adsorbent dose of 0.1 g⋅L−1. The tested dye concentrations were adjusted to 10, 20, 30, 40 and 50 mg⋅L−1 in single mode and 6, 8, 10, 12 and 14 mg⋅L−1 in binary mode. The measured data were fitted to well-known models (Table 2), namely Freundlich, Langmuir and Temkin models. The original and linearized equations of these models as well as the assumptions and implications have been intensively developed in the literature [47, 48].
Used isotherms models for the study of RB and VBB removal by PTW
| Models | Equations |
|---|---|
| Langmuir | |
| Freundlich | |
| Temkin | qe = Bl ⋅ln(Kt) + Bl ⋅ln(Ce) |
As for the kinetic study, the concordance between the experimental and predicted adsorbed amounts by the three used models was determined as follows (4):
| (4) |
2.3.4. Effect of adsorbent dose
The effect of the adsorbent dosage on the RB and VBB removal efficiency was determined for contact times raging between 0 and 40 min, at initial dye concentrations of 10 mg⋅L−1 in single and binary modes. The PTW tested doses were equal to 0.05; 0.1; 0.15, and 0.2 g⋅L−1. The dye percentage removal for a given dose and time is calculated using (2).
2.3.5. Effect of temperature—thermodynamic study
The effect of the temperature on RB and VBB removal efficiency was determined for a fixed contact time of 3 h, and an initial dye concentration of 10 mg⋅L−1 in single and binary modes. The tested temperatures were fixed to 20, 30, 40, 50, and 60 °C, at a constant adsorbent dosage of 0.1 g⋅L−1 and a fixed pH of 4 for both RB and VBB. The dye percentage removal for a given dose and time are calculated using (2).
The thermodynamic parameters of dyes adsorption onto the tested material have concerned the standard free energy changes 𝛥G° (kJ⋅mol−1), the enthalpy 𝛥H° (kJ⋅mol−1) and entropy changes 𝛥S° (kJ⋅mol−1⋅K−1). These parameters were calculated according to the following equations:
| (5) |
| (6) |
| (7) |
The Van’t Hoff equation can be deduced from the combination of (5) and (6) as follows:
| (8) |
The Van’t Hoff plot (log(KC) as a function of 1∕T) permits the estimation of 𝛥H° and 𝛥S° through the calculus of its slope and intercept, respectively.
3. Results and discussion
3.1. Adsorbent characterization
The pHPZC value of the used adsorbent was found to be 3.8. According to the literature, values of 5.1, 6.13 and 6.5 were found in the case of the pHPZC studies for mixture palm waste (seeds, leaves and bark) [49], date stone [43] and palm bark powder [50] respectively.
Therefore, the adsorbent’s surface should be negatively charged for pH values higher than 3.8 which will favor the removal of the used cationic dyes. At contrarily, for pH lower than 3.8, the solid surface should be positively charged.
On the other hand, the FTIR analysis of the used adsorbent (Figure 2) showed that this material contains various absorption peaks, which are characteristic of a lingo-cellulosic material [51].
FTIR spectrum of the petiole palm tree waste.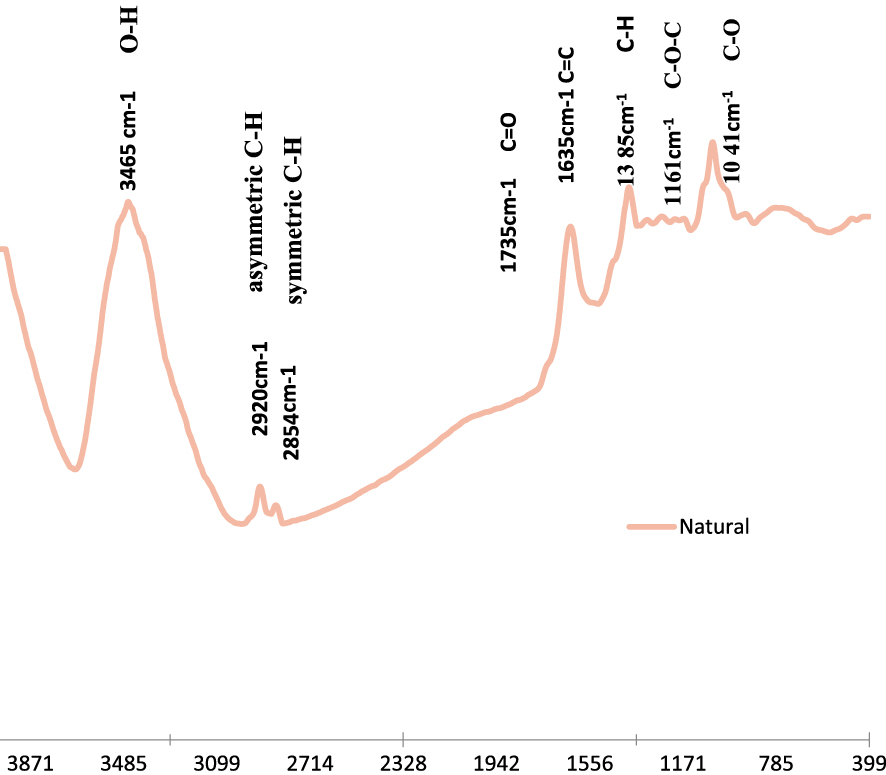
The main existing bands were distributed as follows: (i) a broad and intense band around 3465 cm−1 corresponding to O–H bands [52], (ii) bands at 2920 cm−1 and 2854 cm−1, that can be attributed to asymmetric C–H and symmetric C–H bands respectively [53], (iii) a band around 1735 cm−1 representing C=O and stretching vibration of ester group in hemicellulose [54], (iv) a band around 1635 cm−1, showing the existence of C=C [55], (v) a band around 1635 cm−1 representing O–H bending of adsorbed water [55], and (vi) two bands around 1161 cm−1 and 1041 cm−1 attributed to the C–O–C asymmetric stretching vibration and C–O stretching ring in cellulose and hemicellulose, respectively [53].
The PTW’s FTIR spectrum confirm the results of Belela et al. [56] who studied MB bio-sorption from aqueous solutions by date stones and palm-tree wastes. This spectrum confirmed that the PTW had various functional groups that would contribute to the VBB and RB removal from aqueous solutions.
3.2. Adsorption studies
3.2.1. Effect of initial pH
The value of pHPZC indicated the type of active sites and biomass adsorption capacity. At a pH > pHPZC, cationic dye adsorption was promoted, owing to the presence of functional groups such as OH– and COO– groups, whereas at a pH < pHPZC, anionic dye adsorption was promoted, here the surface became positively charged [57].
Effect of pH on the adsorption of VBB and RB by PTW (Concentration = 20 mg⋅L−1, contact time = 3 h and adsorbent dose = 0.1 g).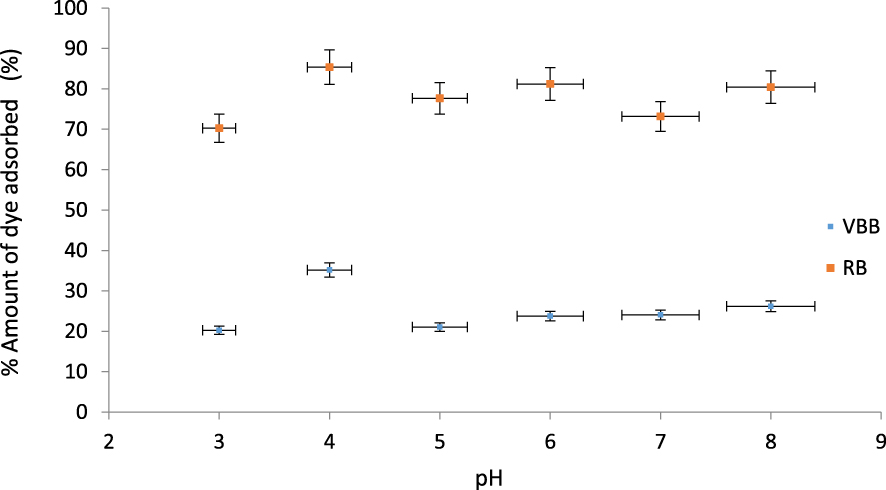
The effect of the pH values on VBB and RB adsorption was studied under the experimental conditions in Section 2.3.1. It can be seen that the adsorption of the two dyes is influenced by the solutions pH values (Figure 3). Indeed, the lowest adsorption yields for VBB (20.2%) and RB (70.2%) were obtained for the lowest pH value (3). This may be due mainly to the fact at this pH, the adsorbent was mainly positively charged which induces a net reduction of the adsorption of the positively charged studied dyes. When used pH values are higher than the pHPZC, the adsorption yields of both dyes increase. The corresponding average yields values for this range were assessed to 26%, and 79.6%, for VBB and RB, respectively. The highest adsorption yields were determined at a pH of 4. They were assessed to 85.4% and 35.2% for RB and VBB, respectively. Kataria et al. [58] observed that the maximum removal of Victoria blue b dye was achieved at pH 6, after that, it decreased with increase in pH when Al-Gheethi et al. [59] observed that the maximum removal of Rhodamine B dye was achieved at pH 4.69.
3.2.2. Adsorption kinetics
The adsorption kinetic of VBB and RB by PTW was carried out under the experimental conditions given in Figure 4. It can be clearly seen that this process is time and initial concentration dependent. Indeed, for a given constant initial concentration, the adsorbed dye amount in both modes highly increases at the beginning of the experiment until a contact time of 15 min. At this time duration, for a single mode and at a concentration of 50 mg⋅L−1, the VBB and RB adsorbed amounts represented about 47%, and 31% of the totally adsorbed amount at the end of the experiment. This short duration will be particularly appreciated when this process will be scaled up for real applications since it will permit high energy savings. After this duration, the VBB and RB adsorption continue to increase but with a much slower rate (Figure 4). After a longer contact period, the adsorbed amounts continue to increase but at a slower rate. This behavior can be linked to intra-particle diffusion within the adsorbent pores and dye adsorption [60, 61]. The equilibrium state which corresponds to almost constant adsorbed amounts was reached after a longer contact time. However, in all cases, duration of about 120 min was sufficient to reach this equilibrium state.
RB and VBB kinetic removal by the petiole palm waste at different initial concentrations in single and binary systems.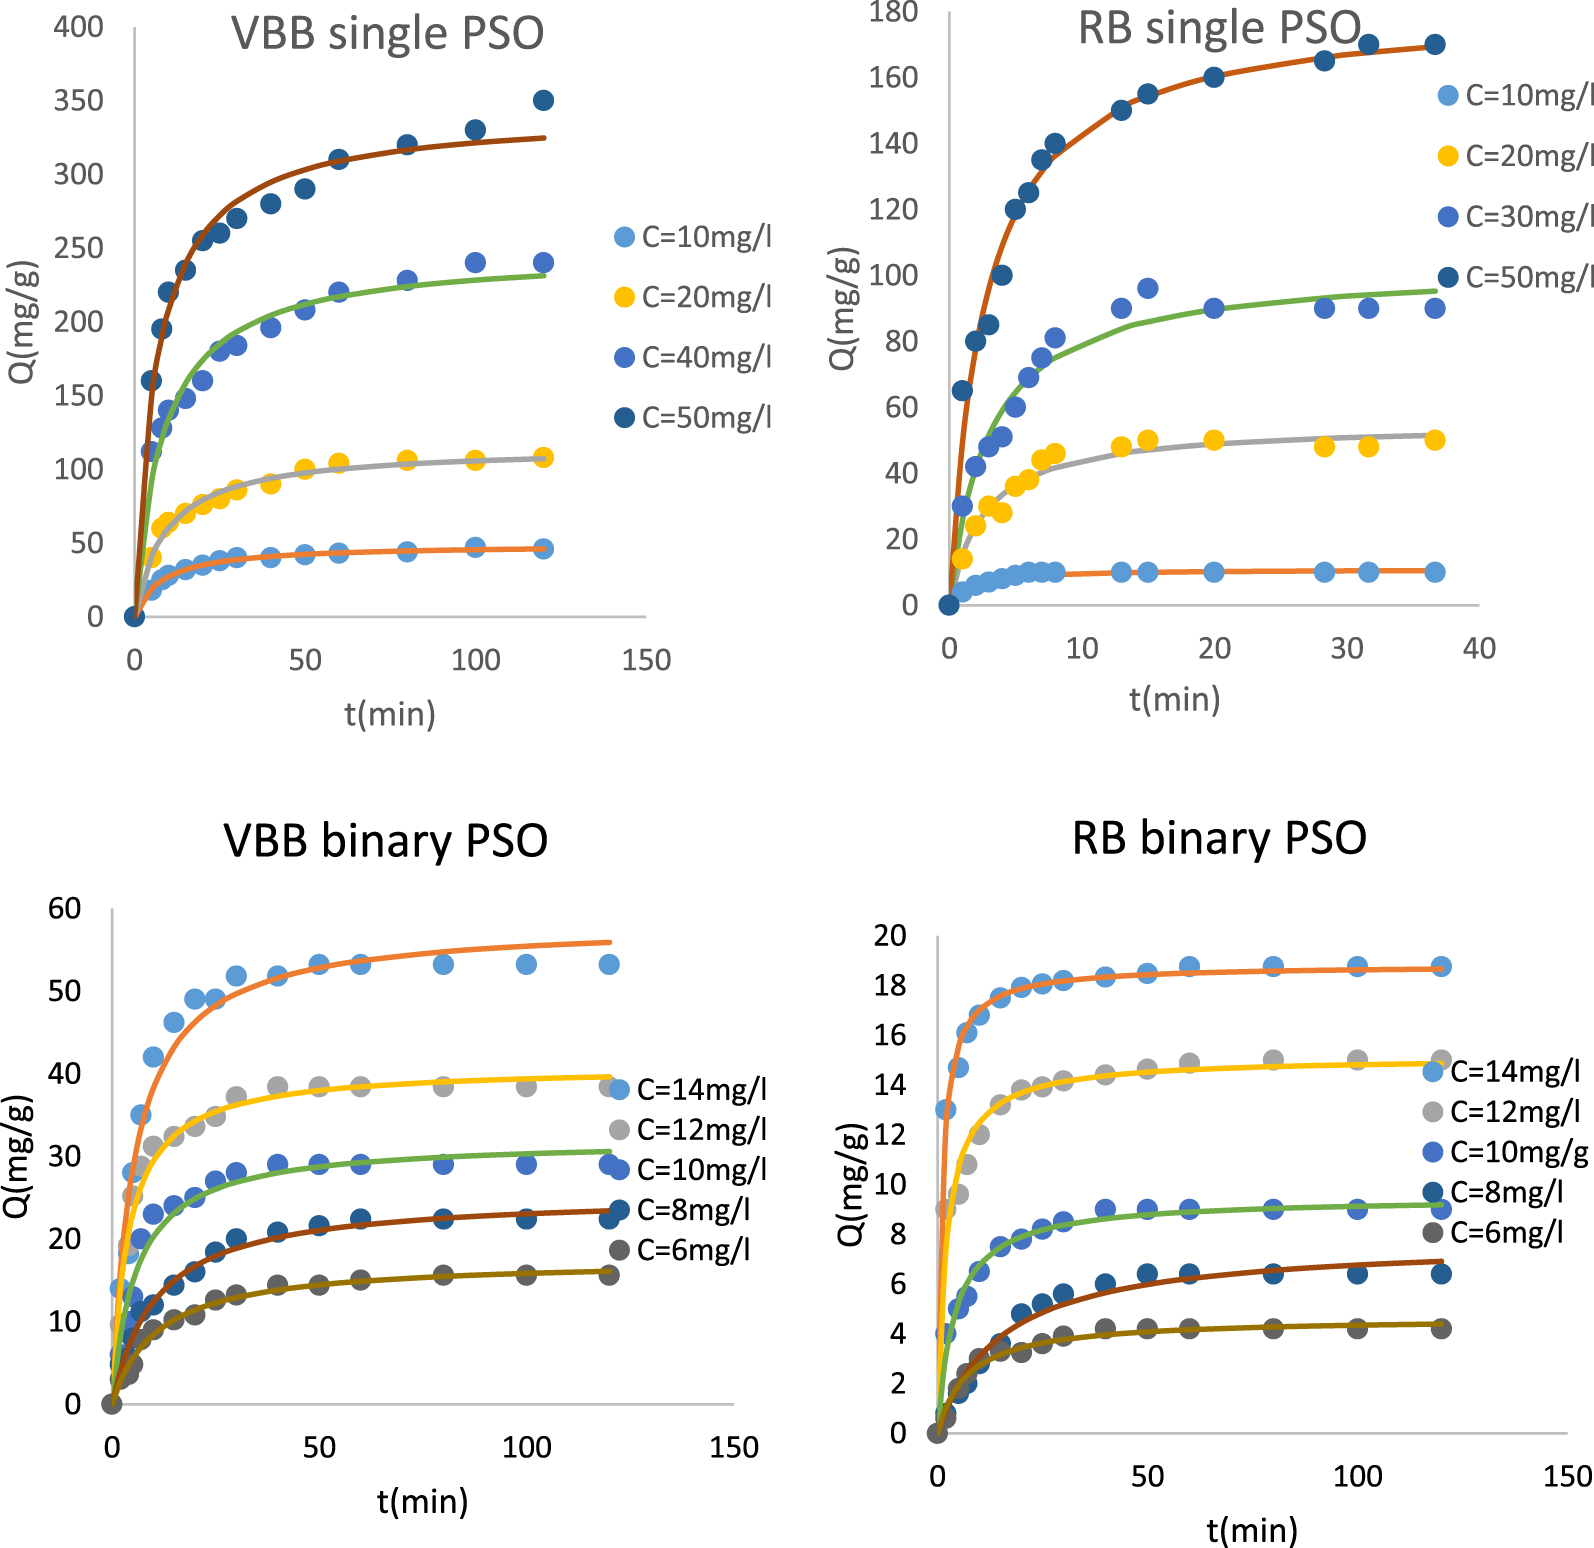
Parameters of the kinetics models of the adsorption of RB, and VBB by PTW in single and binary modes at different initials concentrations (contact time = 3 h, pH = 4 and adsorbent dose = 0.1 g⋅L−1)
| Dyes | Pseudo first order model | Pseudo second order model | Elovich model | ||||||||||
|---|---|---|---|---|---|---|---|---|---|---|---|---|---|
| C0 (mg/l) | qe (mg/g) | k1 (min−1) | R2 | APE | k2 (10−3 min−1) | qe (mg/g) | R2 | APE | 𝛼 | 1∕𝛽 | R2 | APE | |
| Rhodamine B, single mode | 10 | 10.09 | 0.447 | 0.991 | 2.686 | 65.47 | 10.96 | 0.965 | 5.749 | 66.92 | 1.505 | 0.725 | 10.737 |
| 20 | 49.31 | 0.280 | 0.980 | 5.643 | 6.996 | 55.23 | 0.969 | 5.605 | 65.7 | 9.945 | 0.870 | 10.035 | |
| 30 | 91.46 | 0.249 | 0.975 | 6.443 | 3.269 | 103 | 0.967 | 6.355 | 103.5 | 18.87 | 0.889 | 8.446 | |
| 50 | 161.9 | 0.272 | 0.926 | 7.023 | 2.068 | 181.7 | 0.984 | 4.227 | 231.6 | 31.92 | 0.958 | 5.183 | |
| Average | 0.968 | 5.448 | 0.971 | 5.484 | 0.860 | 8.600 | |||||||
| Victoria Blue B, single mode | 10 | 43.58 | 0.094 | 0.980 | 4.653 | 2.549 | 49.23 | 0.996 | 1.877 | 21.54 | 8.572 | 0.952 | 4.507 |
| 20 | 101.6 | 0.083 | 0.956 | 7.628 | 0.948 | 115.5 | 0.988 | 3.611 | 39.43 | 20.96 | 0.970 | 3.769 | |
| 40 | 218.9 | 0.088 | 0.923 | 9.829 | 0.480 | 247.6 | 0.977 | 5.316 | 105.4 | 43 | 0.991 | 1.874 | |
| 50 | 305.4 | 0.114 | 0.935 | 7.864 | 0.456 | 342.1 | 0.982 | 3.679 | 250.5 | 54.366 | 0.987 | 2.122 | |
| Average | 0.948 | 7.493 | 0.983 | 3.620 | 0.975 | 3.068 | |||||||
| Rhodamine B, binary mode | 14 | 18.03 | 0.505 | 0.963 | 4.599 | 49.85 | 18.83 | 0.995 | 1.317 | 6248 | 1.516 | 0.867 | 3.118 |
| 12 | 14.28 | 0.264 | 0.923 | 7.134 | 31.35 | 15.13 | 0.977 | 3.510 | 221.2 | 1.641 | 0.916 | 3.858 | |
| 10 | 8.76 | 0.156 | 0.955 | 6.763 | 26.05 | 9.496 | 0.984 | 3.924 | 15.74 | 1.361 | 0.916 | 5.840 | |
| 8 | 6.545 | 0.059 | 0.995 | 4.124 | 8.524 | 7.785 | 0.977 | 9.303 | 1.15 | 1.633 | 0.935 | 13.425 | |
| 6 | 4.142 | 0.107 | 0.982 | 6.330 | 30.62 | 4.653 | 0.981 | 8.647 | 1.778 | 0.863 | 0.900 | 14.318 | |
| Average | 0.963 | 5.79 | 0.982 | 5.34 | 0.906 | 8.111 | |||||||
| Victoria Blue B, binary mode | 14 | 52.71 | 0.142 | 0.991 | 3.945 | 3.282 | 58.34 | 0.974 | 6.756 | 38.27 | 9.85 | 0.849 | 13.300 |
| 12 | 37.42 | 0.184 | 0.979 | 5.226 | 6.303 | 40.92 | 0.979 | 6.275 | 52.29 | 6.209 | 0.839 | 12.519 | |
| 10 | 28.78 | 0.132 | 0.985 | 5.120 | 5.383 | 32.08 | 0.969 | 9.097 | 16.37 | 5.681 | 0.854 | 15.587 | |
| 8 | 22.12 | 0.078 | 0.986 | 6.234 | 3.751 | 25.47 | 0.989 | 5.966 | 5.94 | 5.025 | 0.955 | 8.334 | |
| 6 | 15.16 | 0.077 | 0.984 | 6.758 | 5.13 | 17.55 | 0.989 | 6.342 | 3.851 | 3.516 | 0.959 | 11.631 | |
| Average | 0.985 | 5.456 | 0.98 | 6.887 | 0.891 | 12.274 | |||||||
It is important to underline that the equilibrium time increases with the increase of the initial dye concentration. For example, in a single mode, for an initial concentration of 10 mg⋅L−1, this time was assessed to 6 and 15 min for RB and VBB, respectively. These times increased to 20 and 60 min when the used initial dyes concentration was increased to 50 mg⋅L−1. This behavior is mainly due to the fact that higher is the initial dye concentration, higher are the dyes molecules that will react with fixed adsorption sites on the surface of PTW [62]. Similar trend was observed for the binary mode (Figure 4). The increase of the adsorbed dyes amount in single and binary systems with the increase of the initial concentration will be deeply discussed in the isotherm section (Section 3.2.3). Moreover, the dyes removal efficiency decrease in binary mode in comparison with the single system will be examined in the same Section 3.2.3.
The fitting of the experimental data with the PFO, PSO, and Elovich kinetic models shows that the PSO was the best one. Indeed, the corresponding theoretical adsorption data for the two dyes and the two studied modes are more concordant with the experimental data in comparison with the other models. The PSO model exhibited the highest average calculated R2 (0.979) and the lowest APE (5.33%) (Table 3). This result suggests that the dyes removal by PTW might mainly a chemical process including complexation with the adsorbent functional groups and cation exchange [63, 64].
Similar results were reported in various research studies, namely the adsorption of methylene blue and crystal violet by palm kernel fiber [65] and the adsorption of Dye Basic Blue 41 and Basic Yellow 28 by activated carbon [66].
3.2.3. Effect of dyes initial concentration—isotherm study
The impact of the initial dyes concentrations in single and binary modes on their removal by PTW was evaluated under the experimental conditions given in Section 2.3.3. The used pH was fixed to 4 which correspond to the optimal value found in Section 3.2.1. The measured data as well as the theoretical ones calculated by Langmuir, Freundlich and Temkin models are given in Figure 5. The calculated constants of these three models are given in Table 4.
Isothermal experimental and fitted data with, Langmuir model for RB and VBB removal by PTW in single and binary mode (initial pH = 4; adsorbent dosage = 0.1 g⋅L−1; contact time = 3 h; T = 20 ± 2 °C).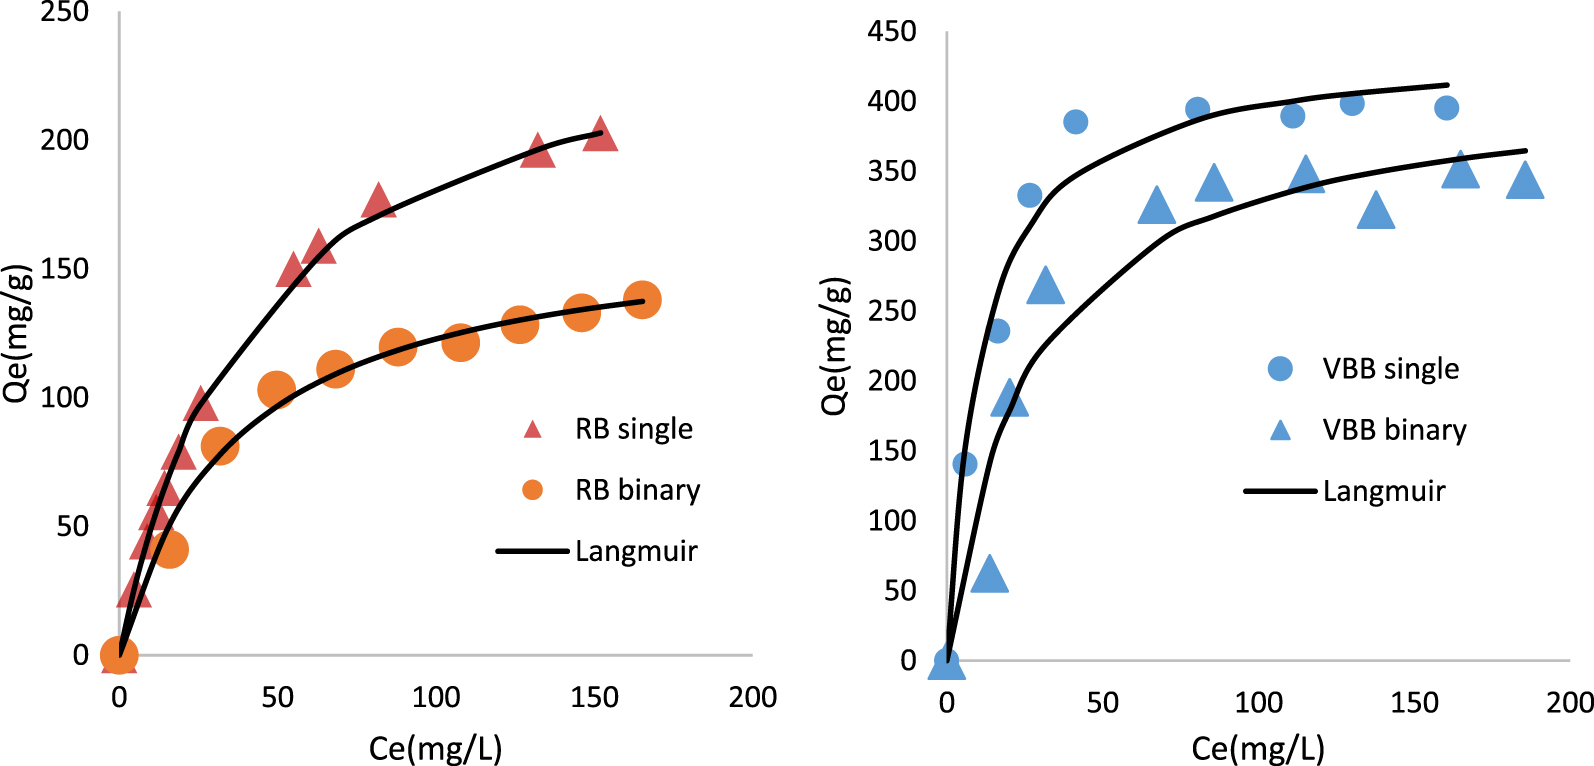
Calculated parameters of Langmuir, Freundlich and Temkin models regarding RB and VBB removal by TPW in single and binary mode
| Dye | Langmuir | Freundlich | Temkin | |||||||||
|---|---|---|---|---|---|---|---|---|---|---|---|---|
| KL (L/mg) | Qm (mg/g) | R2 | APE (%) | Kf (L/mg) | n | R2 | APE (%) | B (J/mol) | Kt | R2 | APE (%) | |
| Rhodamine B, single mode | 0.023 | 260.1 | 0.992 | 7.3 | 18.17 | 2.0 | 0.9587 | 20.4 | 56 | 0.243 | 0.982 | 6.9 |
| Victoria Blue B, single mode | 0.089 | 440.1 | 0.948 | 5.9 | 136.6 | 4.4 | 0.9183 | 13.3 | 77.32 | 1.63 | 0.864 | 10.1 |
| Rhodamine B, binary mode | 0.027 | 168 | 0.977 | 4.6 | 21.43 | 2.6 | 0.9137 | 9.1 | 38.86 | 0.227 | 0.968 | 5.6 |
| Victoria Blue B, binary mode | 0.037 | 417.4 | 0.860 | 20.1 | 71.73 | 3.1 | 0.7346 | 26.9 | 93.54 | 0.313 | 0.817 | 21.9 |
On the basis of Figure 5 and Table 4, it can be clearly deduced that the adsorbed amounts of RB and VBB in single mode were higher than the ones observed in binary system. Indeed, in single mode, the palm tree waste exhibited an uptake capacity of 440.1, and 260.1 mg⋅g−1 for VBB and RB, respectively. These adsorption capacities diminished by 35.4%, and 5.2%, respectively in binary mode. This finding is mainly due to a competitive adsorption between the two dyes on the available adsorption sites [66, 74, 75]. On the other hand, the confrontation of the experimental data to the three used isotherm models showed that the Langmuir model was the most suitable one with relatively high correlation coefficients and lower APE (Table 4). In addition, the highest Langmuir’s parameter values “RL = 1∕(1 + KL∗C0)” were estimated to 0.483 and 0.218 for RB and VBB in single mode 0.448 and 0.38 in binary mode. All these values are less than 1 which indicates that the two dyes adsorption by PTW is a favorable process. This result suggests that dyes adsorption onto PTW occurs on uniform monolayer coverage at the outer surface of the adsorbents [76]. On the other hand, under the studied conditions, the Freundlich parameter “n” varied between 2.2 and 4.4. They are in the range of 1–10, which suggests that the adsorption of these two dyes by the PTW is a favorable process. Values in the same range were determined by [77], and [78] when studying RB, and VBB removal by graphene–based nickel nano-composite, and activated carbon, Ba/alginate and modified carbon/Ba/alginate polymer beads, respectively.
Temkin model was also tested, under the studied conditions, The Temkin parameter “B” varied between 38.86 and 93.54 J/mol, these values are less than 8 kJ/mol which implies that the biosorption of the two dyes is physical in the simple binary system [79, 80].
Comparison of RB and VBB adsorption onto PTW with other materials
| Adsorbent | Dye | Langmuir’s adsorption capacity, qm, (mg⋅g−1) | Reference |
|---|---|---|---|
| Seed husk of Bengal gram | RB, single mode | 133.34 | [67] |
| Ordered mesoporous carbon material ST-A | RB, single mode | 83 | [68] |
| Commercial adsorbent (activated carbon CWZ-22) | RB, single mode | 58 | [68] |
| Synthesized hybrid ion exchanger | RB, single mode | 76.4 | [69] |
| Montmorillonite/graphene oxide nanocomposite | RB, binary mode | 178.6 | [70] |
| Organo-vermiculites | RB, binary mode | 261.97 | [71] |
| Surfactant-modified three-dimensional Mg Al layered double hydroxide | RB, binary mode | 49.6 | [72] |
| Flower shaped Zinc 5 oxide nanoparticles | VBB, single mode | 163.93 | [58] |
| Incense stick ash | VBB, single mode | 77.67 | [73] |
| PTW | RB, single mode | 260.1 | Present work |
| VBB, single mode | 440.1 | ||
| PTW | RB, binary mode | 168 | Present work |
| VBB, binary mode | 417.4 |
In order to situate our adsorbent efficiency in removing the studied dyes, we made a comparison of its removal efficiency (based on the Langmuir’s adsorption capacity) with several other raw and modified adsorbents (Table 5). Results indicate that the PTW could be considered as an attractive low cost material for dyes removal from aqueous solutions. In fact, the adsorption capacity of the RB studied during this work in single mode was about 260.1 mg/g, this value is higher than results found by other researchers we quote for example 133.34 mg/g, 83 mg/g, 76.4 mg/g, and 58 mg/g.
3.2.4. Effect of adsorbent dose
Effect of PTW doses on the removal yield of RB and VBB in single and binary systems.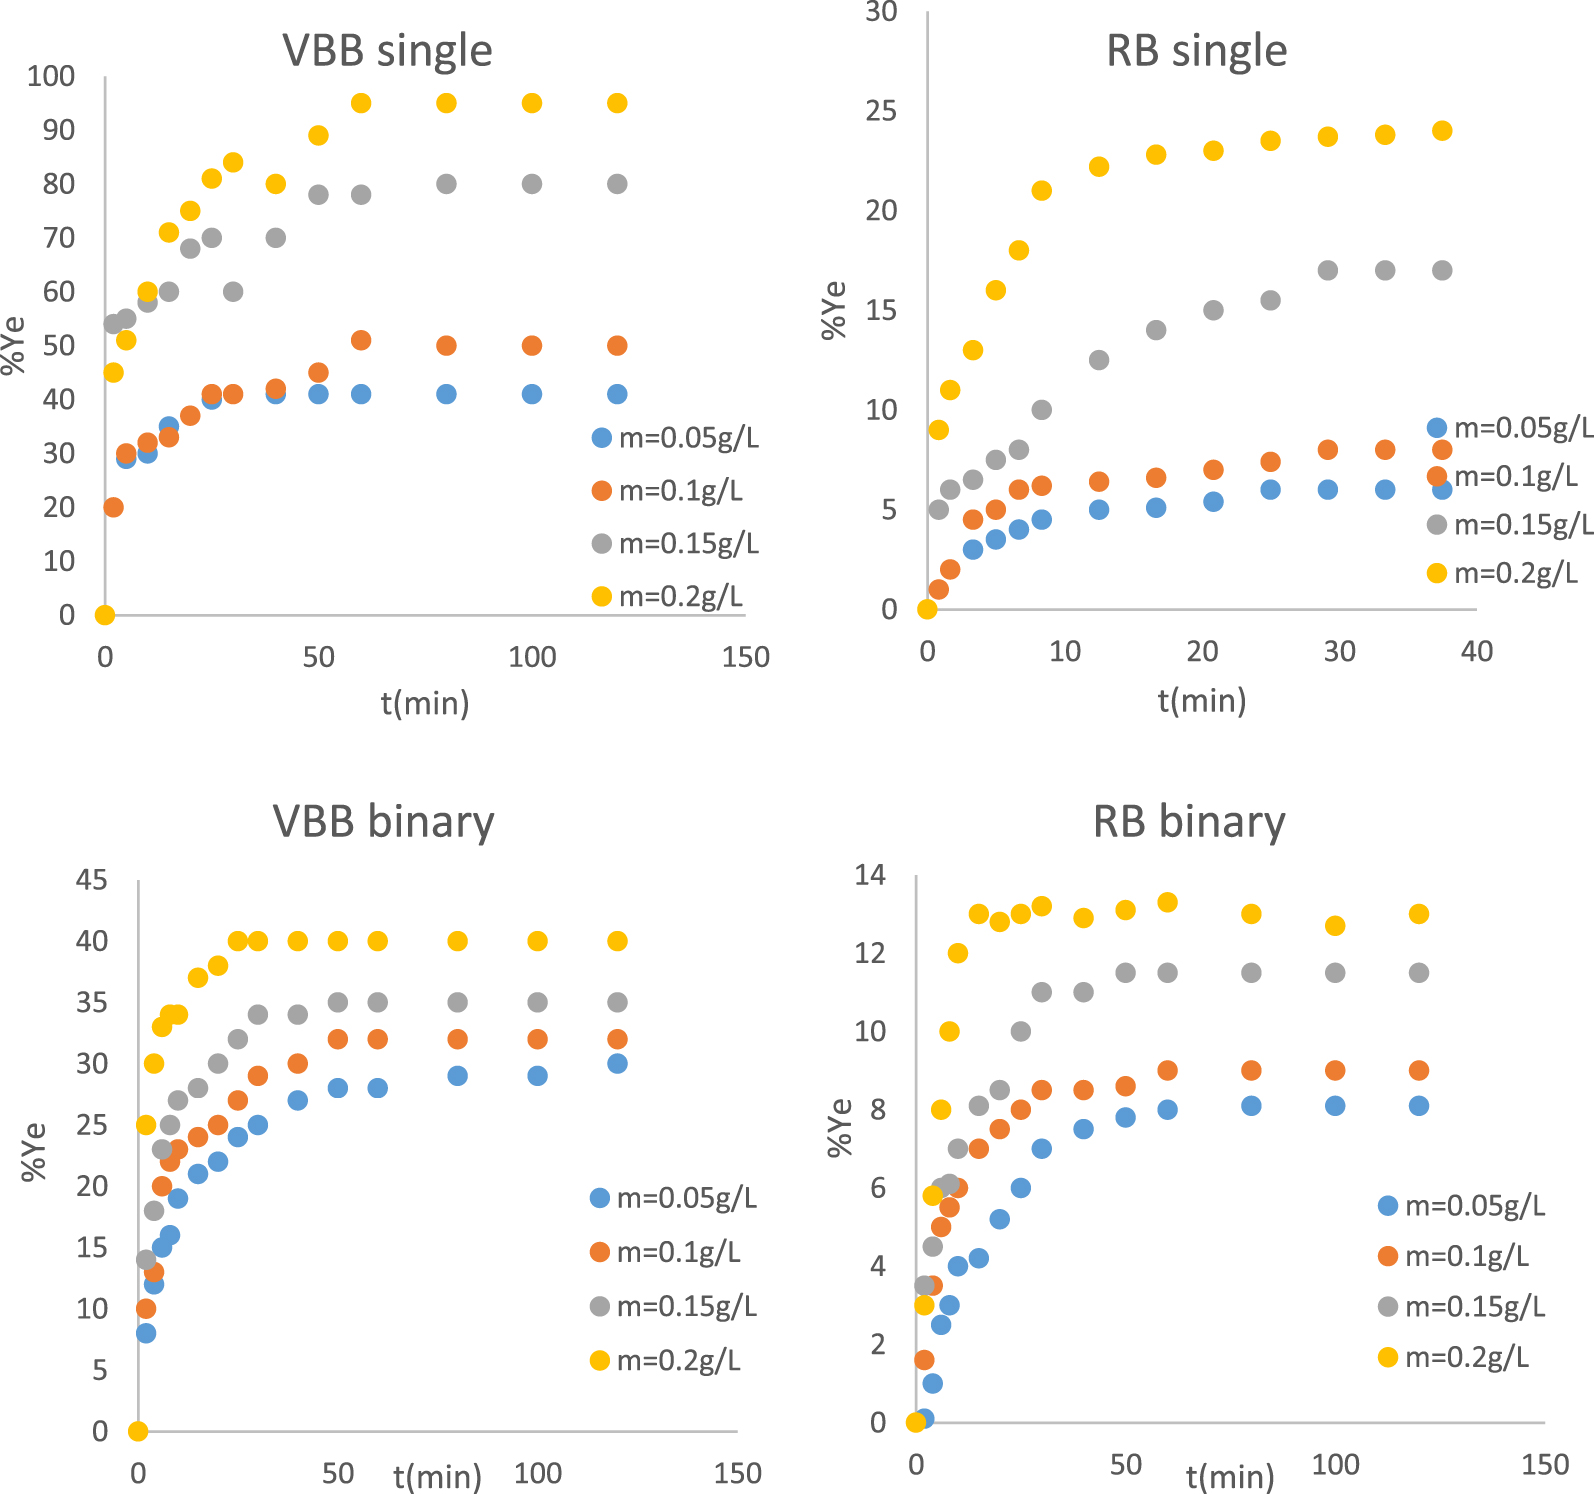
Effect of temperature on the adsorption of RB and VBB in single and binary system.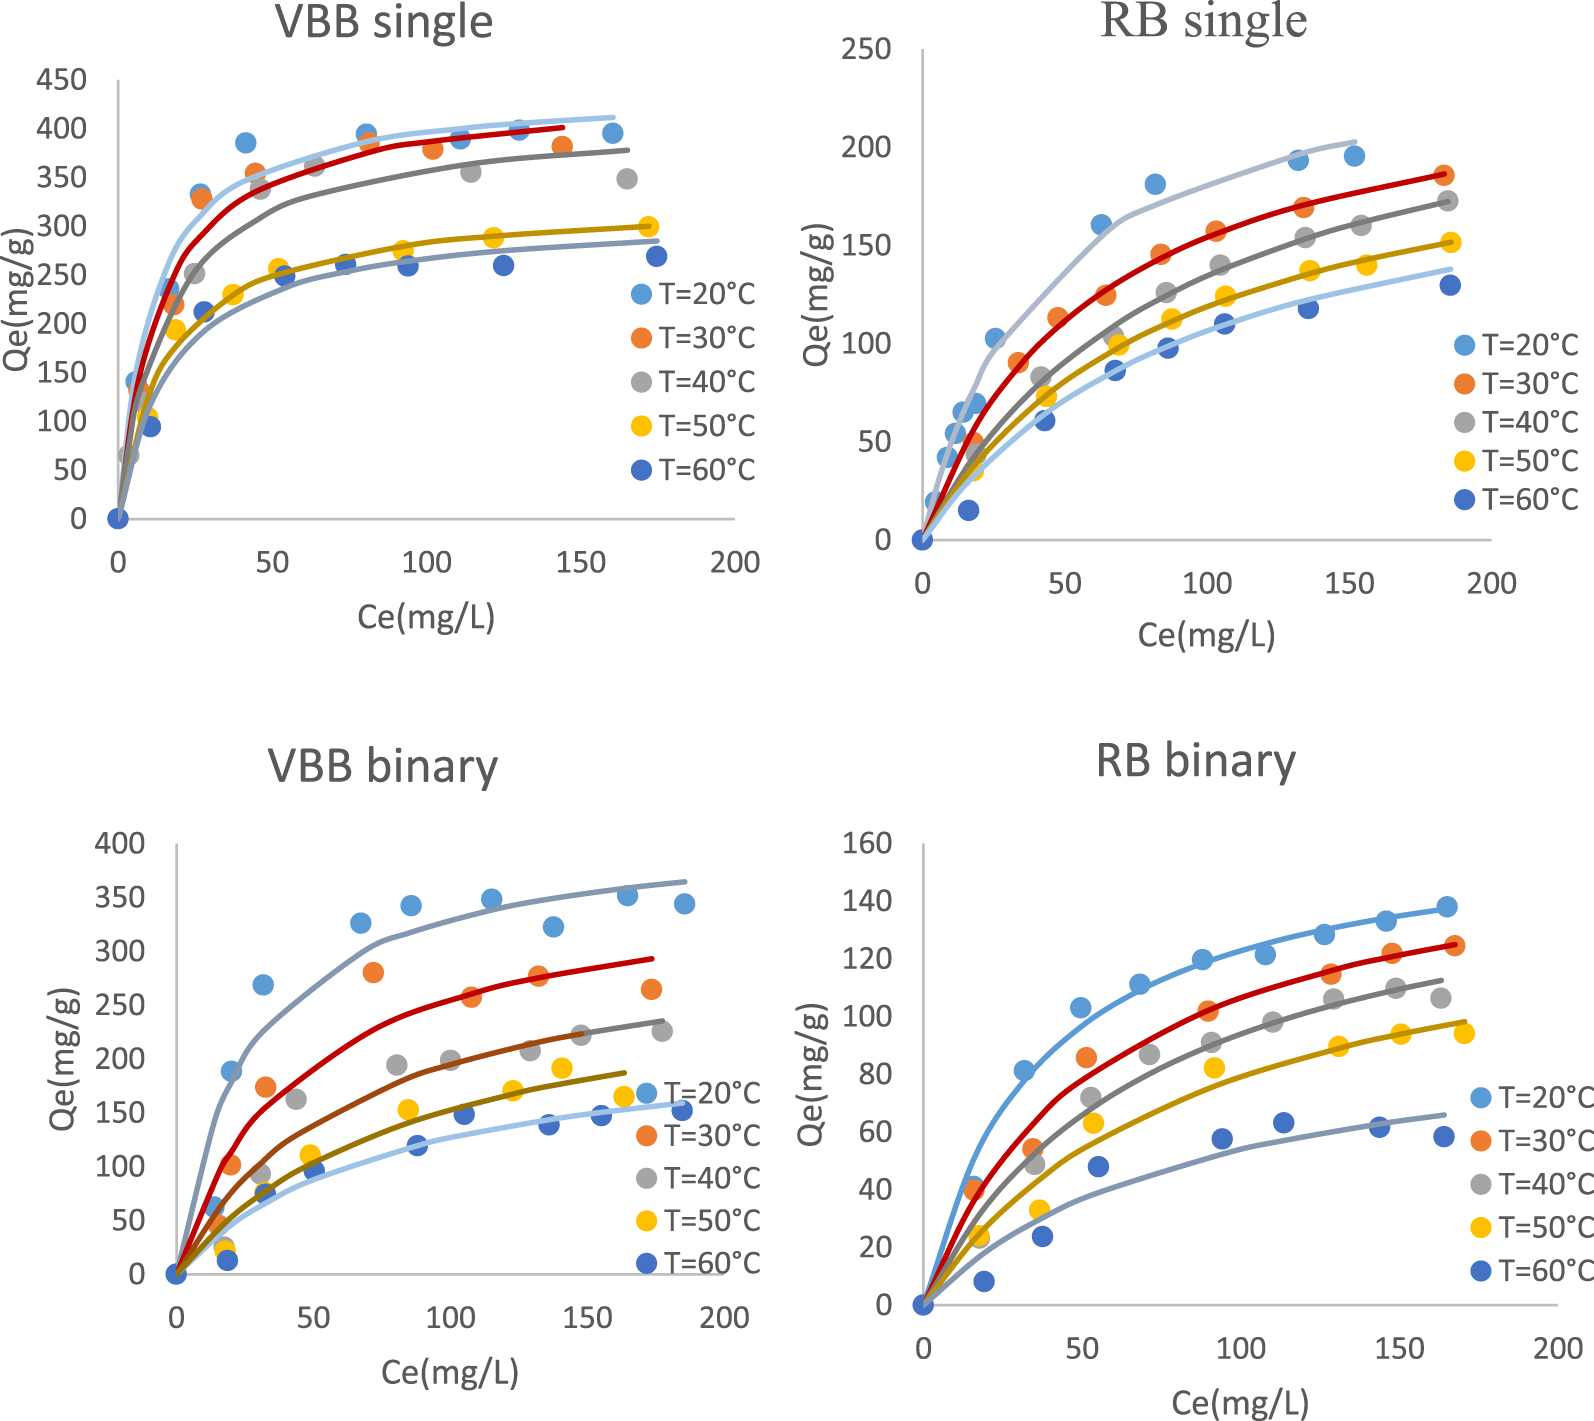
The PTW mass effect on the dye was studied in single and binary systems under the experimental conditions given in Section 2.3.4. Results (Figure 6) indicated that the two dyes uptake yields increased with increasing the PTW doses. For instance, at a fixed time (25 min), increasing the dose of the adsorbent from 0.05 g/L to 0.2 g/L, increased the removal yields from about 6% to 24%, 40% to 81%, 24% to 40% and 6% to 13% for RB and VBB in single mode and for VBB and RB in binary system, respectively. This finding is mainly due to the increase of the available adsorption active sites that could react with the dyes molecules. Similar results were reported by [81, 82], and [83] when studying the adsorption of lead (Pb(II)) from aqueous solutions by Lignite, five toxic dyes by industrial graphite, and cationic crystal violet dye by graham flour.
3.2.5. Effect of temperature
The experimental results of the dye adsorption in single and binary systems on PTW are shown in Figure 7 and Table 6.
Effect of temperature on RB and VBB adsorption onto PTW
| T (°C) | Qm (mg/g) | 𝛥G° (kJ⋅mol−1) | 𝛥H° (kJ⋅mol−1) | 𝛥S° (J⋅mol−1⋅K−1) | |
|---|---|---|---|---|---|
| Rhodamine B, single mode | 20 | 260.1 | − 25.744 | − 11.312 | 49.107 |
| 30 | 249.1 | − 26.251 | |||
| 40 | 258.8 | − 26.608 | |||
| 50 | 224.1 | − 27.0615 | |||
| 60 | 211 | − 27.814 | |||
| Victoria Blue B, single mode | 20 | 440.1 | − 27.681 | − 9.740 | 62.515 |
| 30 | 439.8 | − 29.110 | |||
| 40 | 414 | − 29.606 | |||
| 50 | 327.9 | − 29.823 | |||
| 60 | 313.5 | − 30.385 | |||
| Rhodamine B, binary mode | 20 | 168 | − 24.591 | − 17.277 | 25.858 |
| 30 | 168.3 | − 25.177 | |||
| 40 | 163.8 | − 25.714 | |||
| 50 | 149.5 | − 26.087 | |||
| 60 | 101.3 | − 25.341 | |||
| Victoria Blue B binary mode | 20 | 417.4 | − 26.801 | − 16.518 | 35.832 |
| 30 | 368.9 | − 27.666 | |||
| 40 | 322.1 | − 27.716 | |||
| 50 | 290 | − 28.334 | |||
| 60 | 227.6 | − 28.215 |
On the basis of Figure 7 and Table 6, it appears that for all studied cases, the increase of the temperature has resulted in a decrease of the adsorbed amounts. Indeed, when rising temperature from 20 to 60 °C, the RB and VBB adsorbed amounts decreased by about 39.06%, and 34.84% in single mode and by 53.68%, and 55.77% in binary system.
The thermodynamic parameters of the studied cases are given in Table 6, the thermodynamic energy calculation showed that the studied biosorption is physical (𝛥H less than 40 kJ/mol), spontaneous, and exothermic (𝛥H < 0) with an increase in disorder (𝛥S > 0) [84]. Similar results was observed by [85] and [86] when studying adsorption of Rhodamine-B from aqueous solution by the use of natural adsorbent perlite and magnetic silica nanocomposite immobilized pseudomonas fluorescents respectively, while [87] observed that the removal of RB from aqueous solutions using MgO supported Fe–Co–Mn nano-particles was spontaneity and endothermic similar results was observed by [58] when studying the adsorption of VBB onto zinc oxide nanoparticles.
4. Mechanisms exploration
To remove contaminants from an aqueous solution, it is necessary to understand the mechanism of the solute adsorption onto the solid surface. During an adsorption mechanism there is intervention of ionic interactions of opposite charge namely dipole–dipole, dipole–induced dipole, hydrogen bonding, chemical bonding and ion exchange.
In order to interpret the adsorption of the solute, the adsorbent surface chemistry as well as its effect on the adsorption process is usually studied. Fourier transform infrared spectroscopy (FTIR) analysis is used to study the interaction between an adsorbate and the active sites on the adsorbent surface. The explanation of FTIR is based on the chemical structure of petiole palm tree wastes. PTW consists mainly of three compounds which are cellulose, hemicellulose and lignin. Cellulose and hemicellulose contain most of the oxygenated functional groups present in the lignocellulose product, while lignin is a complex, systematically polymerized and highly aromatic substance [38].
5. Conclusions
Rhodamine B (RB) and Victoria blue B (VBB) dye removal from aqueous solutions in single and heterogeneous solutions using petiole palm tree waste (PPTW) was experimentally determined.
Our findings were:
∙ In the single system:
The removal percentage increased with increasing initial dye concentration and adsorbent mass and decreased with increasing temperature. Langmuir and Freundlich’s models described the adsorption isotherms well but Langmuir’s model fitted better the experimental data with adsorption capacities of 260.1 and 440.1 mg/g for RB and VBB, respectively. The thermodynamic energy calculation showed that the studied biosorption is physical, spontaneous, and exothermic with an increase in disorder. Concerning the kinetic study, the optimum contact time for the initial dye concentration to reach equilibrium is 60 min and 20 min for (VBB) and (RBB), respectively. This result is due to the saturation of active sites. The experimental results showed that the chemical adsorption best followed the pseudo-second-order equation.
∙ In the binary system:
The removal percentage increased with the initial dye concentration and adsorbent mass but decreased with increasing temperature. In contrast to the other tested models, the Langmuir model fitted the experimental data better with adsorption capacities, calculated from the linear Langmuir equation, equal to 168 and 417.4 mg/g for RB and VBB, respectively. The optimum contact time for the initial dye concentration to reach equilibrium was 40 and 20 min for VBB and RBB, respectively. This result is attributable to the negatively charged surface area. The adsorption curve followed the Pseudo-second order model.
Conflicts of interest
Authors have no conflict of interest to declare.
Acknowledgments
The authors would like to thank the National Engineering School of Gabes, Gabes University, Tunisia. Special thanks to Mrs. Rim Najjar for many helpful style corrections.