


 CC-BY 4.0
1. Introduction
Recently, the control of water quality and the protection of the environment prove to be important fundamental and industrial issues because of the development of industrial activities. Additionally, industrialization and urbanization lead to the accumulation of many pollutants which should be treated efficiently. Many biological, chemical, and physical techniques are available [1]. By taking advantage of adequate adsorbents, the adsorption mechanism can be used to resolve this issue and eliminate the contaminants. Pesticides, herbicides, drugs, heavy metals, and dyes are among the essential contaminants which are discharged from numerous industries such as pharmaceutics, cosmetics, plastics industry, textiles, food industry, etc. [2, 3, 4, 5, 6, 7, 8, 9, 10, 11, 12, 13].
The contaminants’ removal from polluted water may be achieved using several low or no-cost adsorbents which are attractive because of their abundance and availability. Many agricultural crops were studied as biosorbents in the literature They were extracted from leaves, steam, and fruits, of a large number of plants [14, 15, 16, 17]. These crops contain, with different amounts, cellulose and other non cellulose compounds such as hemicellulose, lignin, and pectin. Therefore, they are expected to be rich in hydroxyl groups. As a result, the interaction of these biomaterials with several organic contaminants is enhanced which infers them a significant advantage and increases their attractiveness. The previous studies on cationic dyes removal by lignocellulosic materials have revealed the potential of many biomaterials. The present study will continue in this line and investigate a new biomaterial.
Pergularia tomentosa L. ranks among the family of Asclepiadacea. It is widespread in the desert regions of several African and Asian countries such as Tunisia and Saudi Arabia. A limited number of papers investigated the medicinal applications of this plant [18]. They are exclusively restricted to this kind of application. Sakji et al. and Sebeia et al. investigated the physicochemical characteristics and the adsorption capacity of the seed fibers of Pergularia tomentosa L. [19, 20]. The adsorption energy was not accurately evaluated since empirical models were used. To overcome these shortcomings, we can take advantage of exploiting advanced models based on statistical physics. It should be mentioned that the research of many others [21, 22, 23, 24] used only classical adsorption models and were unable to compute accurately the adsorption. In the present work, adsorption models derived from statistical physics will be employed. The superiority of advanced models is revealed since these models are naturally able to assign physical meanings to the parameters inherent to the different models. Furthermore, they lead to a more accurate value of the adsorption energy. Some intrinsic parameters, in particular, the adsorption energy, will be assessed. The main novelty of this work is to investigate a new low-cost and abundant biomaterial and to compare its capacity for cationic dye removal with other available biosorbents. The second novelty is related to the use of classical and advanced models to fit the adsorption isotherms and to evaluate some parameters related to the adsorption mechanism involved in the cationic dye removal.
Methylene blue is a cationic dye. It is a toxic and mutagenic product. In fact, wastewater containing methylene blue can cause tachycardia, cyanosis, eye damage, skin irritation, dyspnea, and paroxysms [25]. It can cause also vomiting, diarrhea, and nausea. It stops the penetration of sunlight into water, reduces the photosynthetic function in plants, and harms both marine vegetation and aquatic ecosystems. Many studies demonstrated the exploration of efficient adsorbents of methylene blue [26, 27].
The first objective of this work consists of characterizing the new biosorbent and evaluating its ability to adsorb methylene blue (MB). Three characterization methods, explicitly FT-IR, SEM, and TGA were used. In the matter of adsorption kinetics, many models have been checked. Concerning the adsorption isotherms, several classical models are investigated. Then, three advanced models derived from statistical physics are used to fit the adsorption isotherms.
2. Experimental
2.1. Reagents
All the chemical reagents used in this work were of analytical grade. No additional purification is operated. The cationic dye methylene blue was provided from Sigma-Aldrich. The molecular weight of this dye 319.85 g⋅mol−1. To prepare methylene blue solutions, distilled water was employed.
2.2. Preparation of Pergularia tomentosa fruit
The collection of the biomaterial, i.e. Pergularia tomentosa fruit was operated in the littoral region of Monastir city (Tunisia) and the desert region of Zulfi city (Saudi Arabia) (Figure 1). Primary, the fruits were meticulously washed by tap water to remove the attached impurities on its surface, like sand particles and debris. A complementary wash of the fruits was then achieved using distilled water. After that, the fruits were firstly sun dried, and secondly dried in an oven for 24 h at 70 °C. Afterwards, they were grinded to fine powders. To remove the impurities that result from grinding, the obtained powders were washed, once more, using distilled water. Lastly, the sieved grains were dried in oven for 24 h at 70 °C, stored in air tied bottles and used for further experimental essays.
Picture indicating the plant, its fruits, and the fine powders.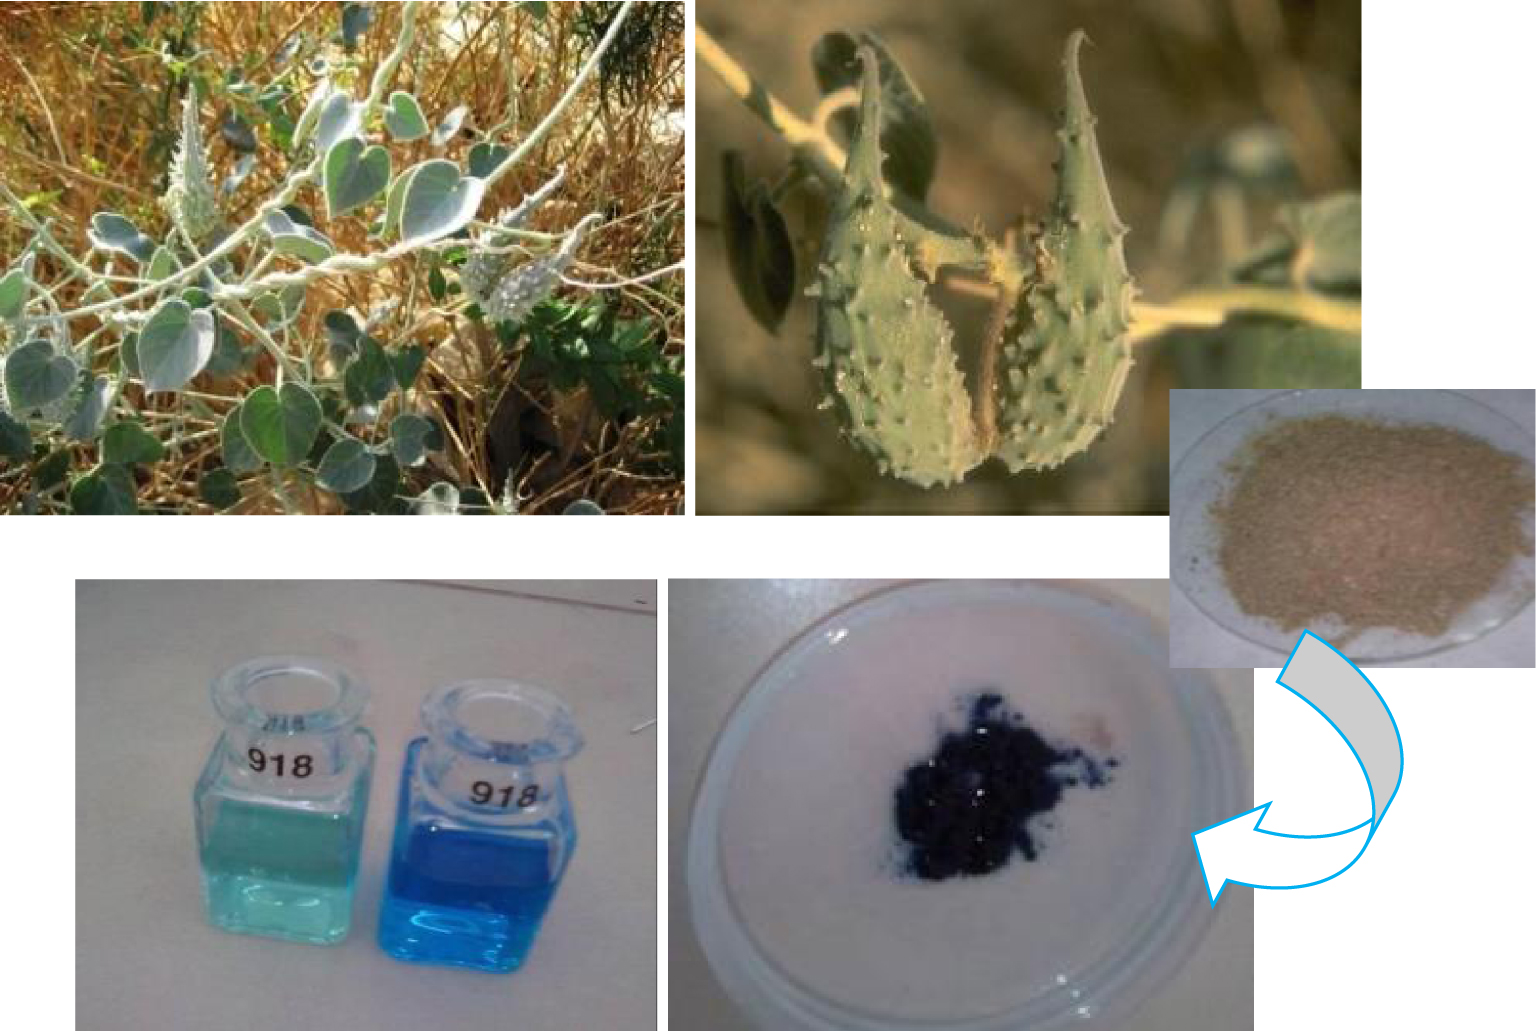
2.3. Characterization techniques
To characterize the biomaterial, three techniques have been used, namely, Fourier Transform Infrared spectroscopy (FT-IR), Scanning Electron Microscopy (SEM), and Thermogravimetric Analysis (TGA). The identification of the chemical group characteristics of the biomaterial was performed by means of a FT-IR spectrum. A Perkin Elmer model was used for this pupose. The spectral span extends over the interval from 4000 cm−1 to 400 cm−1. The spectral resolution of the instrument is 2 cm−1. The measurements are performed using the attenuated total reflection mode. The surface morphology of the biomaterial is investigated using a SEM Hitachi S-2360N apparatus. The powdered fruit was coated with Au by a vacuum sputter-coater with 30 kV accelerating voltage. Several magnifications have been tested. TGA measurements were performed in airflow at a heating rate of 10 °C/min in a Pt crucible with NETZSCH STA 449F3 apparatus. To obtain the point of zero charge pHpzc of the biomaterial, the salt addition technique was used. Indeed, 0.1 g of powdered fruit was immersed in 10−1 M KNO3 solutions (50 mL) at different pH values ranging from 2 to 11. To adjust the initial pH, HCl or NaOH was added. The solutions were shaken under magnetic stirring during 48 h. The final pH value (pHf) was plotted versus the initial pH value (pHi). The point of zero charge pHpzc is defined by (pHf = pHi). More details are available in [28].
2.4. Batch biosorption experiments
In order to investigate the biosorption isotherms, batch adsorption experiments were performed in a set of 500 mL beakers containing 25 mL of methylene blue with different initial dye concentrations and 0.025 g of powdered fruits. To reach the equilibrium, the above mixture was stirred at a speed of 100 rpm and a temperature of 19 °C. A UV–Vis spectrophotometer calibrated at a maximum wavelength of 665 nm was used to measure the concentrations of MB in the solution before and after biosorption. The following equation is used to compute the biosorption capacity at equilibrium qe (mg⋅g−1):
| (1) |
In this paper, we will start by the characterization of the biomaterial as above mentioned. After that, the effect of contact time, pH, initial concentration, temperature will be investigated. The kinetic data will be fitted using several models. The adsorption isotherms will be fitted using classical models as well as models derived from theoretical considerations based on statistical physics. An important issue will be discussed is related to the comparison between classical and advanced models.
3. Theoretical models for the equilibrium isotherms
Two groups of models representing the adsorption isotherms are exploited in the present study. The first group integrates classical models which are fully empirical or semi-empirical. These models are very famous and have been extensively employed in the literature [21, 8]. However, the physical meaning of the parameters involved are not always obvious. The second group contains more advanced models which are obtained from statistical physics theory. The assumptions considered to deduce the different expressions and the reasoning schemes are more explicit. Furthermore, a clear physical meaning is assigned to each parameter.
3.1. Classical models
In this first category, many models are elaborated to fit different types of experimental results and they involve many assumptions. In general, they contain two or three parameters to adjust the equilibrium isotherms [29, 30, 31, 32]. The following isotherm models are used in present study: Langmuir, Freundlich, Hill, and Dubinin–Radushkevich models. It should be mentioned that there are many other models. However, they have some resemblance with one of the above models. For this reason, only the performance of the aforementioned five classical models will be evaluated.
3.1.1. Langmuir isotherm model
The Langmuir model is the most common one. It is deduced using many assumptions. Indeed, the adsorption process is assumed to be monolayer. A homogeneous surface and a constant energy are also assumed. Furthermore, the interaction between adsorbate molecules on adjacent sites are neglected. The adsorbed pollutant amount at equilibrium qe (mg⋅g−1) versus its concentration in water at equilibrium Ce (mg⋅L−1) is given by:
| (2) |
3.1.2. Freundlich isotherm model
This model has been elaborated from empirical considerations in the aim to account for the multilayer adsorption. The adsorbed pollutant amount at equilibrium qe is formulated by:
| (3) |
Depending on the surface heterogeneity, the value of n may be greater than one. Freundlich model assumes that the adsorption energy decays exponentially moving away from the surface. When the exponent n increases, the adsorption isotherm reaches rapidly the saturation and the adsorbed pollutant amount becomes smaller.
3.1.3. Hill isotherm model
In this model, the adsorption process is considered as a cooperative mechanism. The adsorbed pollutant amount at equilibrium qe is expressed by:
| (4) |
3.1.4. Dubinin–Radushkevich isotherm model
The adsorbed pollutant amount at equilibrium qe is given by [33]:
| (5) |
The temperature is explicitly involved in this model. Dubinin–Radushkevich model produces acceptable fitting in the intermediary range of concentrations. Nevertheless, at small and large concentrations, this does not match adequately the isotherm curve [35]. For that reason, unrealistic maximal adsorption capacities have been reported by several studies [8, 21].
It is important to mention that erroneous expressions have been used by many authors to calculate the energy. Some well-known relations contain a problem of unit. They lead to a non-reliable estimation of the adsorption energy and other thermodynamic quantities. To avoid this problem, the units of all the quantities and mathematical expressions should be cautiously scrutinized.
3.2. Advanced models derived from statistical physics
As above mentioned, a large number of classical models have been elaborated to fit a wide variety of experimental data. The usefulness and potential of these models have been recognized. Nevertheless, they present some shortcomings. Actually, the elaboration of the classical model is, in general, empirical and is not bot based on theoretical considerations. Moreover, the physical significance of the parameters inherent to each model is not obvious. To overcome these shortcomings, an alternative method has emerged throughout recent decades. The number of models developed in this framework has continued to grow [36, 37, 38, 39, 40, 41]. In parallel, the fields of application of these new models become widener and widener progressively. Among all the models recently developed, we will confront our data with only three models.
3.2.1. Monolayer model characterized by one energy
The monolayer model characterized by one energy presumes that only one layer participates to the adsorption mechanism over the adsorbent surface. Furthermore, all the receptor sites are linked to the adsorbate with the same energy. Nevertheless, each receptor site S is able can be linked to a fluctuating number n. The adsorption reaction reads: nA + S⇌An S where An S denotes the produced complex. In fact, the steric or stoichiometric number n should be regarded as an average number. It is not necessarily an integer number and it may be greater or lesser than one. If n > 1, n corresponds to the average number of molecules attached to a particular receptor site. On the contrary, when n < 1, its inverse n′ = 1∕n denotes the expected number of receptor sites occupied by one molecule [42, 43].
When only the translation degrees of freedom are taken into account, the average number of occupied sites Na or equivalently the adsorbed pollutant amount at equilibrium qe as a function of the concentration Ce is given in Table 1 [44]. It is clear that three adjustable parameters are involved in this model. In particular, the half-saturation concentration is one of the parameters constituting the model. This quantity depends on the temperature T. More precisely, it is related to the temperature T and the adsorption energy Ea according to the relation [37]:
| (6) |
Advanced models for the adsorption isotherms
| Model | Equation | Parameters |
|---|---|---|
| Monolayer model with one energy | Nm is the density of receptor sites of adsorbent. n is the number of adsorbed molecules per site. C1∕2 is the concentration at half saturation. | |
| Monolayer model with two energies | Nm1 and Nm2 are the densities of the two kinds receptor sites. n1 and n2 are the numbers of adsorbed molecules per site. C1 and C2 are respectively related to the first and second kind of receptor sites. | |
| Double-layer model with two energies | C1 and C2 are related to the first and second layer respectively. |
The physical significance attributed to each parameter is obvious. The mathematical relation of the one-energy monolayer model is identical to the classical Hill model. To grasp further the physical significance of the different parameters which are intrinsic to the model, a parametric study may be performed. This study may also help to evaluate the effect of the error on each parameter.
3.2.2. Monolayer model characterized by two energies
This model also accepts that only one layer is involved in the adsorption mechanism. However, this layer encloses two varieties of receptor sites. Each variety has its own energy. Therefore, two different energies Ea1 and Ea2 are engaged in the model. This model is in some ways a generalization of the one-energy monolayer model The expression of this model is given in Table 1 [45]. The energies Ea1 and Ea2 can be computed from the half-saturation concentrations C1 and C2 as previously specified. It should be mentioned that the subscripts 1 and 2 may be permuted without changing the model. Therefore, no constraint is imposed on the energies Ea1 and Ea2.
3.2.3. Double-layer model characterized by two energies
The double-layer model characterized by two energies admits that two consecutive layers are involved in the adsorption process. Each layer is characterized by its own energy. We denote by Ea1 and the Ea2 the energy of the first and the second adsorbed layer respectively. It is straightforward to derive the model presented in Table 1 [38]. The energy Ea1 related to the first layer should be greater than the energy Ea2 that characterizes the second layer. Therefore, the half-saturation concentration C1 should be smaller than the half-saturation concentration C2. On the contrary of the above model, the subscripts 1 and 2 cannot be mutually permuted.
3.3. Adsorption kinetic models
To fit the kinetic data, a large number of kinetic models have been developed during the last decades. The majority of the models are empirical. They are described by an ordinary differential equation such as in the linear driving force model. They may also be formulated using a mathematical relationship such as the pseudo first order (PFO) model, pseudo second order (PSO), Elovich model, intra-particle diffusion model and Bangham model [46].
3.3.1. PFO adsorption kinetic model
At any the instant t, the pollutant adsorbed quantity is expressed by: qt = qe(1 − e−k1 t). This model involves the rate constant k1 and the equilibrium adsorbed quantity qe. The meaning of these two parameters is obvious. In particular, the rate constant is related to the slope of the curve at small contact times whereas the quantity qe is reached at saturation.
3.3.2. PSO adsorption kinetic model
At any instant t, the pollutant adsorbed quantity is expressed by: . This model involves two adjustable parameters, namely the rate constant k2 and the equilibrium adsorbed quantity qe.
3.3.3. Elovich adsorption kinetic model
At any instant t, the pollutant adsorbed quantity is expressed by: qt = (1∕𝛽)ln 1 +𝛼𝛽 t. It is clear that the constant 𝛼 is called the adsorption rate (mg⋅g−1⋅min−1). The unit of the constant 𝛽 is g⋅mg−1.
3.3.4. Intra-particle diffusion kinetic model
At any instant t, the pollutant adsorbed quantity is expressed by: . This model also involves two adjustable constants, namely the intra particle diffusion rate constant kd and the constant C which is associated to the boundary layer effect.
3.3.5. Bangham adsorption kinetic model
At any instant t, the pollutant adsorbed quantity is expressed by: . The Bangham model involves three adjustable parameters, namely the equilibrium adsorbed quantity qe, the rate constant kb but also the exponent n. The Bangham model is more universal than the PFO model since it contains the adjustable exponent n. It is expected that this model is susceptible to fit more accurately the experimental data.
The reference time is t0 = 1 min. It is a judicious artefact that permits that all the rate constants k1, kd and kb have the same unit. Moreover, the conversion from one system of units to another becomes straightforward using this reference time.
All the above models were expressed using the nonlinear formula. For each model, one or more linear form are available. However, the nonlinear form leads to more accurate results and proves to be more powerful.
3.4. Error analysis
To evaluate the parameters involved of a model, the root means square error (RMSE) function is minimized. This function is defined according to:
| (7) |
Iterative algorithms are used to identify the parameters that minimize the above function. Matlab programs and built-in Microsoft Excel or Origin functions are used. The standard deviation related to each adjustable parameter is also calculated. This quantity allows judging on the quality of the identification process and the model veracity to adjust the experimental data. Indeed, the standard deviation on all the identified parameters should vary in a small range to accept the model.
The first criterion used to coarsely qualify the performance of the fit process is the correlation coefficient R between the experimental and theoretical curves. This quantity is defined by:
| (8) |
4. Results and discussion
4.1. Characterization of the biomaterial
FT-IR spectroscopy was used to determine the main functional groups of the powdered biomaterial. Figure 2 exhibits the FT-IR spectrum. The most important absorption peaks are indexed. A broad absorption peak is recorded at 3292 cm−1. It is attributed to the hydroxyl groups. Two absorption peaks are registered at 2918 cm−1 and 2848 cm−1. They are respectively the sign of the existence of C–H and CH2 groups [47]. The absorption peak observed at 1726 cm−1 is accredited to C=O group in hemicellulose composition [48]. The absorption peak shown at 1596 cm−1 is assigned to C=C aromatic groups present in the lignin composition [49]. The absorption peak observed at 1418 cm−1 is related to the angular deformation of CH groups in cellulose [50]. The absorption peak seen at 1235 cm−1 could be defined as the angular deformation of CH groups in hemicellulose [49]. The peak at 1012 cm−1 is related to C–O–C ring stretching vibration of cellulose. These absorption peaks prove that Pergularia tomentosa fruit is rich of oxygeneous groups on its surface [51]. These massive oxygeneous groups are the origin of the interaction between MB dye and the cellulosic Pergularia tomentosa fruit through hydrogen bonding interaction.
FT-IR spectrum of the biosorbent and identification of the main adsorption peaks.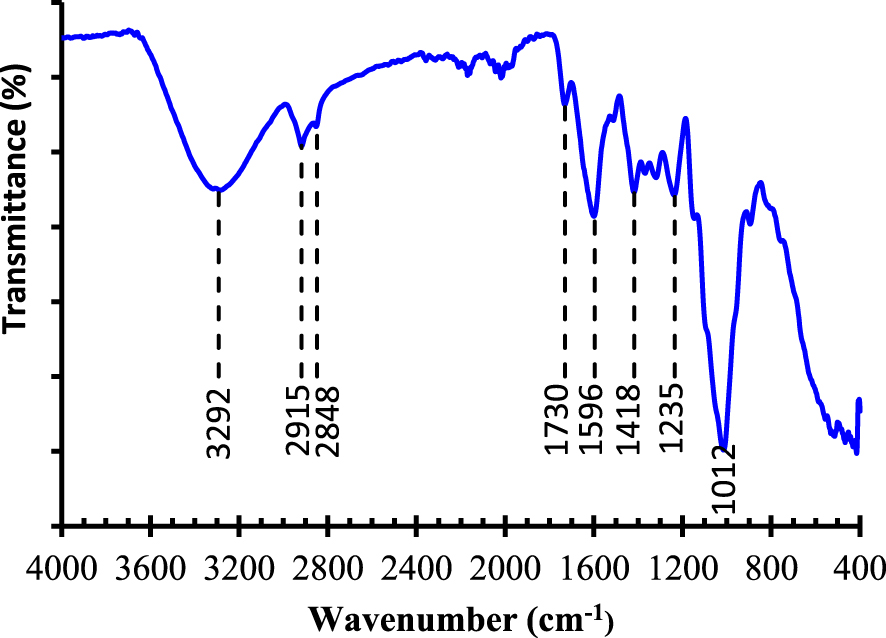
SEM images of Pergularia tomentosa fruit.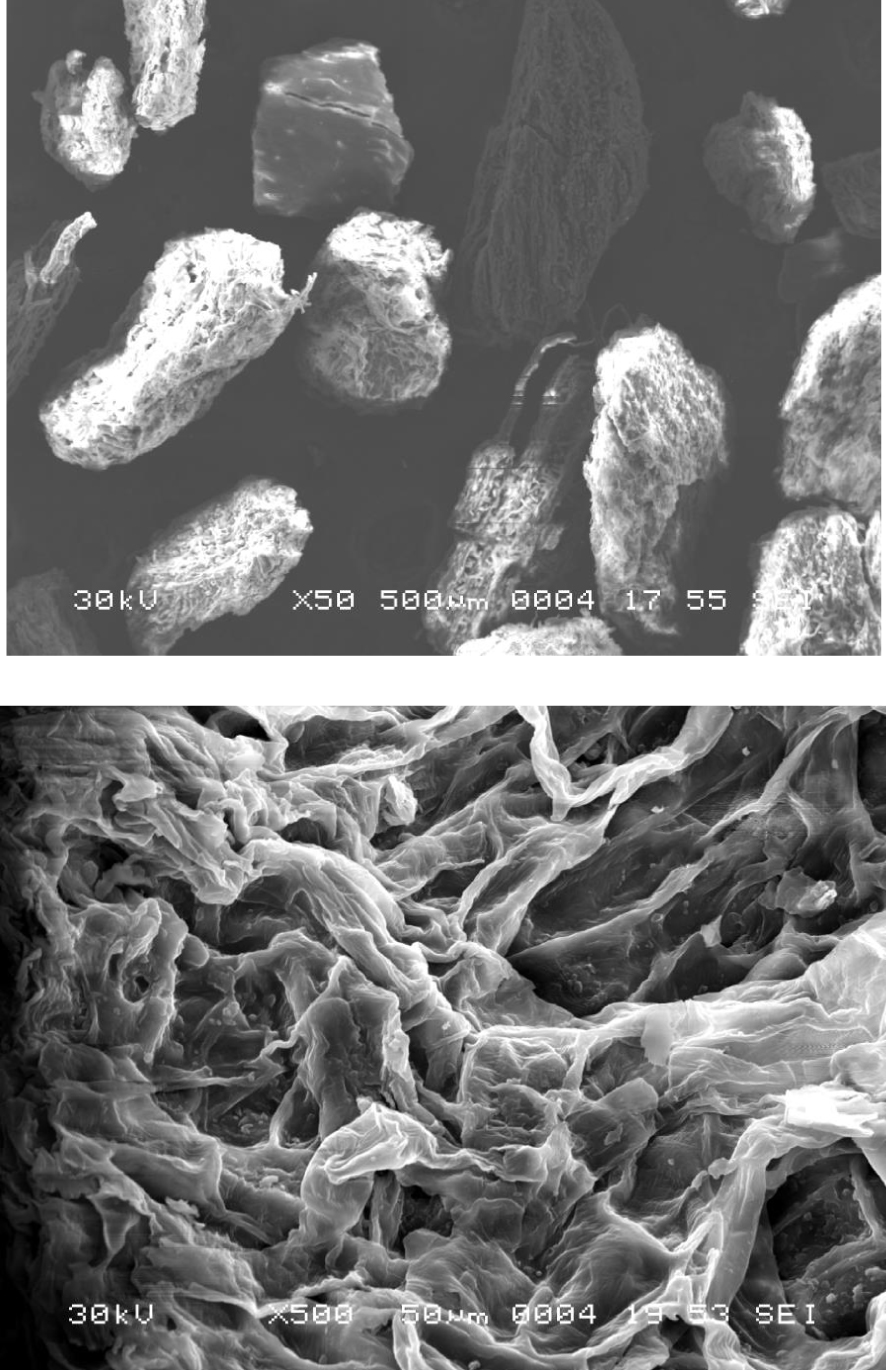
Figure 3 exhibits the SEM features of Pergularia tomentosa fruit observed at different higher magnifications (×50 and ×500). The images of the powdered fruits show rough and heterogeneous surface. The particles have irregular shapes and present also some cavities. The surface structures are likely to enhance the number of receptor sites offered to the biosorption of methylene blue. The decomposition pattern and thermal stability of Pergularia tomentosa are shown in Figure 4. After decomposition, it was observed that the maximum weight loss of the biomaterial was around 73%. The first thermal decomposition was seen at 98 °C and it was accompanied by mass loss of 10%, which could be in general assigned to the moisture evaporation found in the hydrophilic biomaterial [52, 53]. The second thermal decomposition registered at 233 °C indicated the decomposition of all organic compounds of the biomaterial including cellulose and non-cellulose compositions [54]. This behavior is in agreement with FT-IR results. The thermal decomposition at 393 °C could be assigned to the depolymerisation and decomposition of glycosyl units of the cellulosic biomaterial [55].
TGA curve of Pergularia tomentosa fruit.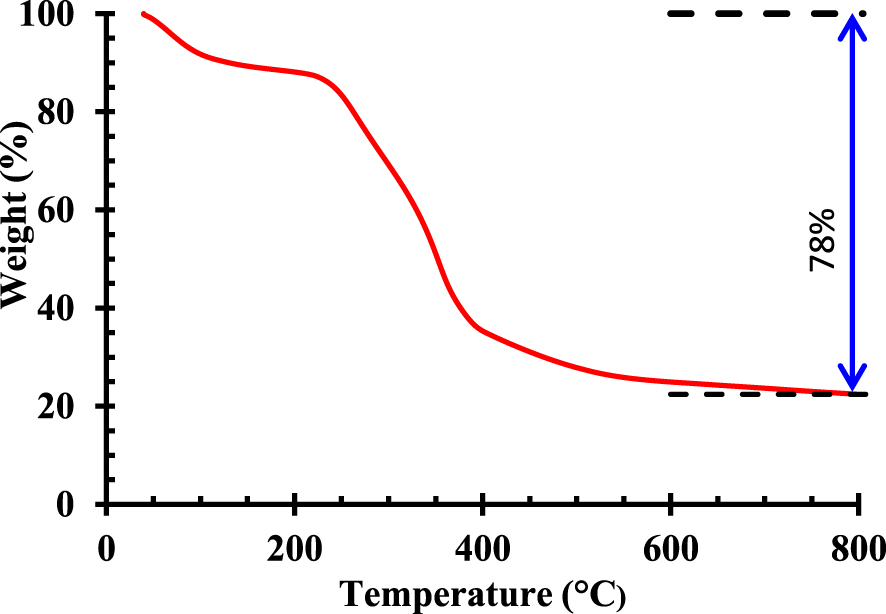
4.2. Effect of the experimental parameters on the adsorption of methylene blue
The main experimental parameters that affect the biosorption process are the final pH of the solution, the initial concentration of MB, the amount of fruit added, the temperature, and contact time. As explained above, to determine pHpzc value of biosorbent, the final pH and the initial pH are measured. Figure 5a depicts the curve of the final pH (pHf) versus the initial pH (pHi). The experimental may be fitted a second order polynomial function. The intersection of this curve with the first bisector correspond to the value pHf = pHi = 6.1 ± 0.2. In other words, the point of zero charge corresponds to pHpzc = 6.1 ± 0.2. We deduce that the biomaterial was positively charged below the value of pHpzc and it becomes negatively charged above this value. Figure 5b exhibits the evolution of the equilibrium adsorbed quantity qe versus the initial pH value (blue curve and bottom horizontal axis). It appears clearly that when this pH increases from 3 to 6, the adsorbed quantity qe increases significantly. Then it reaches a maximum value. When the pH continue to increase, the adsorbed quantity qe decreases slowly. This trend corroborates the results related to the effect of initial pH (Figure 5a). The results obtained from FT-IR and TGA characterization indicated that Pergularia fruit has many oxygeneous groups allowing different behaviors at different pH values. Indeed, at acidic pH conditions, Pergularia surface was positively charged due to the protonation which opposed the positively charged methylene blue ions. At alkaline pH conditions, Pergularia surface was negatively charged due to deprotonation of oxygeneous groups favoring an electrostatic interaction with methylene blue. Comparable behaviors were obtained in some previous works [56, 57].
Parametric study on the biosorption of the cationic dye: (a) plot of final pH as a function of the initial pH, (b) (3 combined curves): effects of pH, biosorbent dosage and NaCl dosage. The initial dye concentration is C0 = 10 mg⋅L−1, the temperature T = 19 °C and contact time t = 30 min.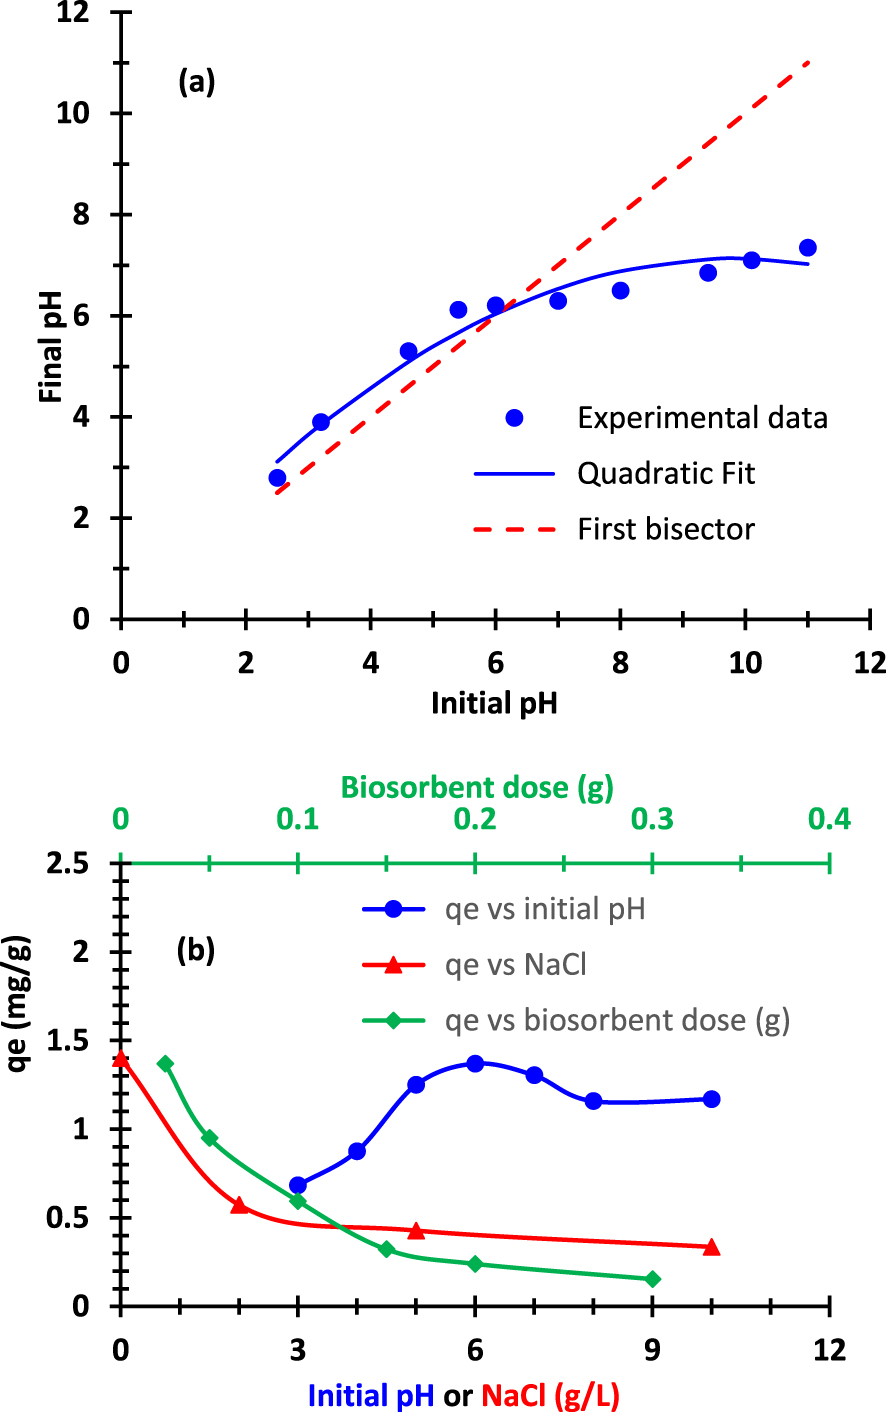
The effect of Pergularia fruit dosage on the biosorption capacity of methylene blue is also plotted in Figure 5b (green curve and top secondary horizontal axis). It was observed that the biosorption amount decreased shapely with the increase of the biosorbent dosage. This adsorbed amount decreased from 1.37 to 0.15 mg⋅g−1 for an increase in the biosorbent dose from 1 g⋅L−1 to 12 g⋅L−1 (C0 = 10 mg⋅L−1, pH = 6, T = 19 °C). The high capacity observed within a dosage of 1 g⋅L−1 was attributed to the high biosorbent surface area and the large availability of sorption sites at this condition. However, the low biosorption capacities observed at high biosorbent dosage was due to the unsaturation of biosorbent sites, during the biosorption process. Quite similar results were reported in the literature [58, 59]. The measurement of the adsorbed quantity qt at the time t reveals that the time required to reach the biosorption equilibrium was observed at only a period of 30 min. Results indicated also that more than 95% of target biosorption occurred during the first 10 min (Figure 6). This indicated the efficiency of the use of Pergularia tomentosa fruit as biosorbent of cationic dyes from water with a very fast biosorption rate. Indeed, the vacant active sites accessible at the surface of Pergularia fruit during the initial period of time were the origin of the rapid biosorption of MB molecules. At approximately 30 min, the surface of the biosorbent became partly occupied and consequently no further increase in the biosorption capacity could be occur [60]. The results related to the kinetic data will be discussed in more detail in hereafter.
Time evolution of the adsorbed pollutant amount for three initial concentrations. Comparison between experimental results and the theoretical fits using three models.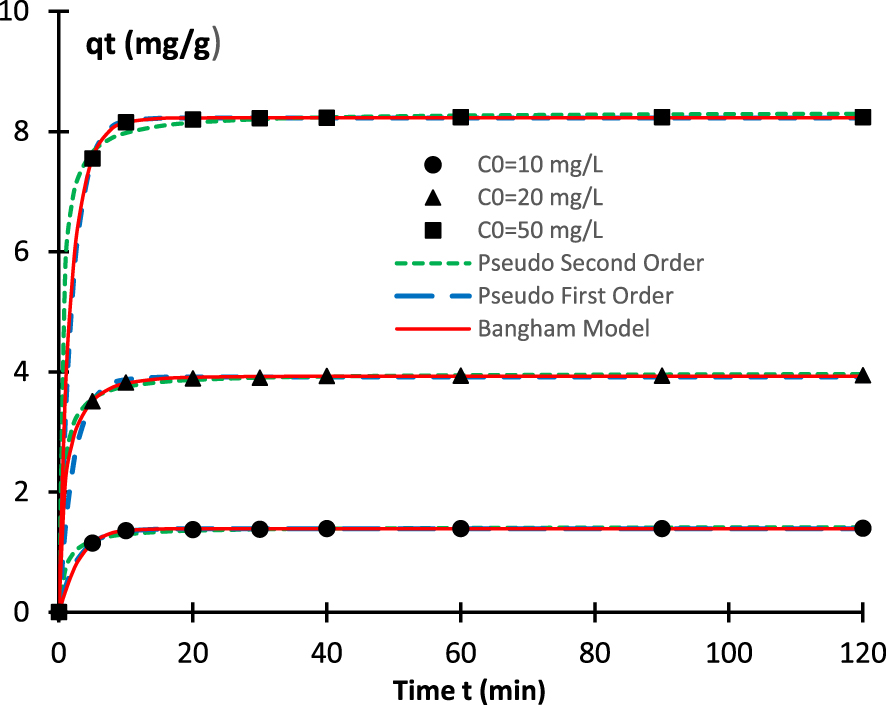
The measurement of the adsorbed quantity qe at equilibrium shows that the process for reaching biosorption equilibrium was rapid for methylene blue concentration <500 mg⋅L−1 and it became almost stable at higher dye concentrations. The maximum capacity of the adsorbed dye was achieved at lower dye concentration due to the availability of adsorption sites in Pergularia tomentosa fruit surface [61, 62]. At equilibrium, the maximum biosorption capacity was equal to 152 mg/g (pH = 6, t = 60 min, T = 19 °C). This capacity removal of the pollutant is compared to other published biosorbents Table 2. It suggested again the efficiency of Pergularia tomentosa to be used as inexpensive and effective biosorbent of cationic dyes from water. The decrease of the biosorption capacity with the increase in temperature was ascribed to the escaping of the adsorbed MB ions at higher energy or temperature. It decreased from 152 mg⋅g−1 to 132 mg⋅g−1 when the temperature moved from 19 °C to 55 °C. The results related to the isotherms will be analyzed with further detail in Section 3.4.
Comparison of the capacity of removal of methylene blue using many low-cost and abundant biosorbents
| Biosorbent | Maximum removal capacity (mg⋅g−1) | Reference |
|---|---|---|
| Pergularia tomentosa fruit | 122 | Present work |
| Mountain soursop seeds | 89 | [45] |
| Typha angustifolia (L.) dead leaves | 107 | [51] |
| Cocos nucifera | 112 | [27] |
| Rice (Oryza sativa L.) | 158 | [26] |
| Brazilian berries seeds | 171 | [63] |
| Nerium oleander fruit | 259 | [28] |
The effect of salt concentration on the biosorption of methylene blue onto Pergularia tomentosa fruit is also plotted Figure 5b (red curve and bottom horizontal axis). Data showed that the biosorption of methylene blue declined significantly with the increase in NaCl concentration from 0 to 10 g⋅L−1. This was assigned to the decrease of interaction between methylene blue ions and the oxygeneous groups of Pergularia fruit surface. Indeed, Na+ ions entered in competition with the nitrogen atom of methylene blue to interact with the hydroxyl groups of the biomaterial leading to lowest biosorption levels.
4.3. Kinetic data modeling
To understand the affinity between methylene blue and biomaterial during time, kinetic measurements were performed. The results may deliver evidences on the biosorption process. They also helps to decide on its kind (i.e. chemical or physical). They can also give evidence on the mass transport. Figure 6 exhibits the kinetics curves for the following initial concentrations C0 = 10 mg⋅L−1, C0 = 20 mg⋅L−1, and C0 = 50 mg⋅L−1. The five models above mentioned are used to fit the experimental data. The nonlinear expression is directly used to deduce the parameters inherent to each model. The convergence of the parameter identification and optimization is ensured by an iterative algorithm. Table 3 summarizes the kinetic parameters. It appears clearly that the obtained values of the correlation coefficient R are very close to one for four models, explicitly PFO model, PSO model, Bangham model, and Elovich model. However, the values of R are exceptionally small concerning the intra diffusion model. In the matter this model, even if the boundary layer constant C is taken into consideration, the correlation coefficient R does not come close to its nominal value one. We can conclude that, in the investigated samples, the kinetics is controlled by adsorption and pore diffusion and not by the intra-particle diffusion. It is also clear the behaviors of the different kinetic models are significantly dissimilar for short durations (approximately lesser than 15 min). The initial slope of the curves changes notably from one model to another. Gradually, when time increases, the various models lead to the same results and collapse. A more attentive inspection of the errors related to different models proves that Bangham and PFO models adjust more accurately the experimental data. We deduce that, in the present samples, the adsorption can be considered as a pore diffusion and physiosorption process. The values of the adsorption energy that will be obtained in the Section 4.6 will corroborate this result. The curves obtained from the theoretical PFO and PSO models are also represented in Figure 6 for the three studied initial concentrations. The equilibrium time may be evaluated by 𝜏 = 3∕k1. In other words, depending on the initial concentration and using the values of the constant k1, the equilibrium is approximately achieved in 6–8 min.
Values of the parameters involved in the kinetic models and error criteria
| Kinetic models | Parameters involved in the model and error criteria | Dye initial concentration C0 (mg⋅L−1) | ||
|---|---|---|---|---|
| 10 | 20 | 50 | ||
| Pseudo first order | qe (mg⋅g−1) | 1.390 | 3.915 | 8.224 |
| k1 (min−1) | 0.354 | 0.448 | 0.499 | |
| R | 0.9997 | 0.999 | 1.0000 | |
| RMSE (mg⋅g−1) | 0.007 | 0.024 | 0.013 | |
| Pseudo second order | qe (mg⋅g−1) | 1.426 | 3.983 | 8.326 |
| k2 (min−1) | 0.707 | 0.412 | 0.273 | |
| R | 0.9962 | 0.9994 | 0.9992 | |
| RMSE (mg⋅g−1) | 0.027 | 0.029 | 0.075 | |
| Elovich | 𝛼 (mg/g⋅min) | 1.32 × 10⁷ | 3.33 × 10¹⁰ | 7.30 × 10¹⁶ |
| 𝛽 (mg⋅g−1) | 16.70 | 8.93 | 5.41 | |
| R | 0.9883 | 0.9966 | 0.9971 | |
| RMSE (mg⋅g−1) | 0.047 | 0.071 | 0.139 | |
| Intra-particle diffusion | kd (mg⋅g−1 ⋅min−0.5) | 0.183 | 0.519 | 1.090 |
| R | 0.451 | 0.420 | 0.397 | |
| Bangham | qe (mg⋅g−1) | 1.389 | 3.927 | 8.228 |
| kb (min−1) | 0.286 | 0.809 | 0.592 | |
| n | 1.129 | 0.636 | 0.894 | |
| R | 0.9998 | 0.9999 | 1.0000 | |
| RMSE (mg⋅g−1) | 0.007 | 0.013 | 0.011 | |
4.4. Isotherms modeling using classical models
As above mentioned, the adsorption isotherms will be fitted using classical models and advanced models based on statistical physics. In the matter of the first category, five models are exploited. Three of these models involve two adjustable parameters. These three models are Langmuir, Freundlich, and Dubinin–Radushkevich models. The Hill model includes three adjustable parameters. For this reason, it is expected that the last model is likely to fit more precisely the experimental data. Table 4 presents the parameters inherent to each model as well the correlation coefficient and the RMSE value. It appears clearly that all models fit accurately the experimental. Indeed, for all the models, the correlation coefficient R is approximately equal to one with an error smaller than 3%. Furthermore, the absolute error ranges from 2 to 9 mg⋅g−1 depending on the model. This error is relatively small compared to the maximum value of qe. This confirms that all the investigated classical models prove to be satisfactory. In addition, it appears that Hill isotherm model is probably more suitable for smoothing experimental data curves. Figure 7 exhibits the adsorption isotherms. As above mentioned, Dubinin–Radushkevich model gives the opportunity the evaluate the mean free energy of adsorption Ead. The values of this quantity are presented in Table 4 for several temperatures. It is clear that this energy does not vary significantly in the range of the investigated temperatures. It remains approximately in the range from 6 to 7 J⋅mol−1. We can deduce that the nature of the adsorption process taking place in the present biomaterial is physiosorption [45, 64, 65, 66]. However, the above estimation of the adsorption energy is very rough. In the next section, we will obtain a more adequate value obtained from statistical models.
Equilibrium adsorption isotherms: experimental results and theoretical fits using advanced models.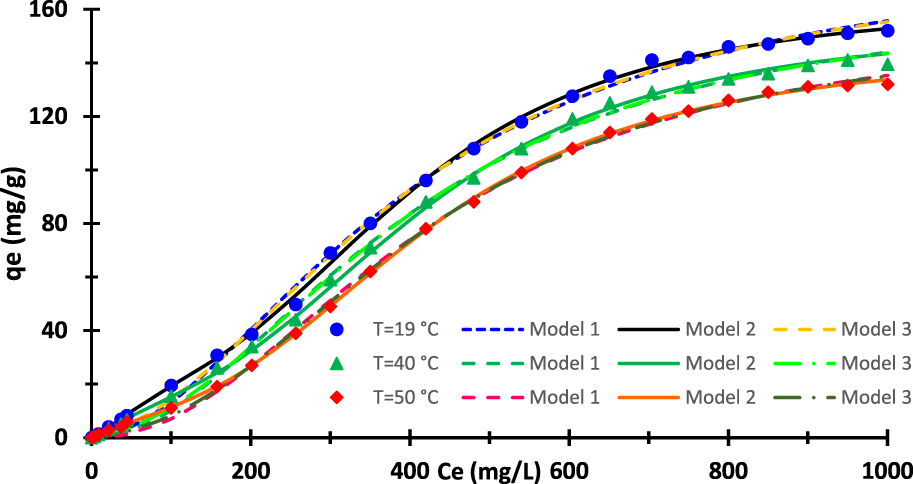
Values of the parameters involved in the classical models of the adsorption isotherms and some error criteria
| Classical models | Parameters involved in the model and error criteria | Temperature (°C) | ||
|---|---|---|---|---|
| 19 | 40 | 50 | ||
| Langmuir isotherm model | qmax (mg⋅g−1) | 375 | 382 | 456 |
| KL (L⋅mg−1) | 7.71 × 10⁻⁴ | 6.61 × 10⁻⁴ | 4.61 × 10⁻⁴ | |
| R | 0.988 | 0.987 | 0.985 | |
| RMSE (mg⋅g−1) | 6.9 | 6.8 | 6.8 | |
| Freunlich isotherm model | n | 1.32 | 1.27 | 1.18 |
| Kf (mg⋅g−1) | 0.905 | 0.686 | 0.426 | |
| R | 0.978 | 0.977 | 0.978 | |
| RMSE (mg⋅g−1) | 9.2 | 8.7 | 8.1 | |
| Hill isotherm model | qmax⋅H (mg⋅L−1) | 184 | 168 | 157 |
| KD | 6.58 × 10⁴ | 1.35 × 10⁵ | 3.64 × 10⁵ | |
| nH | 1.85 | 1.97 | 2.12 | |
| R | 0.998 | 0.998 | 0.999 | |
| RMSE (mg⋅g−1) | 3.1 | 2.7 | 1.5 | |
| Dubinin–Radushkevich isotherm model | qs (mg⋅g−1) | 487 | 608 | 646 |
| kad (mol2⋅kJ−2) | 1.46 × 10⁻² | 1.11 × 10⁻² | 1.0 × 10⁻² | |
| R | 0.986 | 0.984 | 0.984 | |
| RMSE (mg⋅g−1) | 1.9 | 1.9 | 2.0 | |
| Ead (kJ⋅mol−1) | 5.9 ± 0.2 | 6.7 ± 0.2 | 7.1 ± 0.2 | |
At first sight, the values of qmax obtained from the Langmuir model seem to be overestimated since the plateau region seems to appear. A more attentive screening of the curves reveals that the plateau is not reached. Different techniques are used to obtain the values of the two adjustable parameters involved in the Langmuir model, namely the saturation value qmax and the constant KL. Among these techniques, we adopt the following linearized form of the Langmuir model:
| (9) |
4.5. Isotherms modeling using models based on statistical physics
The second category for adjusting adsorption isotherms contains the advanced statistical models. As above mentioned, only three models will be run. Table 5 encloses the values of the adjustable parameter intrinsic to each model as well as the correlation coefficient R and the RMSE. The values of the coefficient R is approximately equal to one with an error lesser than 0.2%. The values of the RMSE are also relatively small compared to the maximum value of qe. The two-energy single-layer model is adopted since it is likely to lead to the best match of the data. Figure 7 displays also the curves related to the three statistical models. It is obvious that the monolayer model with one energy is identical to the Hill model. Indeed, the both models are represented by similar equations.
Values of the parameters involved in the advanced models of the adsorption isotherms and some error criteria
| Models | Parameters involved in the model and error criteria | Temperature (°C) | ||
|---|---|---|---|---|
| 19 | 40 | 50 | ||
| Model 1: monolayer model with one energy | qe⋅sat = nNm (mg⋅g−1) | 184 | 168 | 157 |
| C1∕2 (mg⋅L−1) | 396 | 401 | 422 | |
| n | 1.86 | 1.97 | 2.12 | |
| R | 0.998 | 0.998 | 0.999 | |
| RMSE (mg⋅g−1) | 3.1 | 2.7 | 2.0 | |
| Model 2: monolayer model with two energies | q1 = n1 Nm1 (mg⋅g−1) | 133 | 130 | 126 |
| C1 (mg⋅L−1) | 409 | 426 | 430 | |
| n1 | 2.82 | 2.78 | 2.76 | |
| q2 = n2 Nm2 (mg/g) | 30.2 | 26.0 | 20.7 | |
| C2 (mg⋅L−1) | 85.4 | 100 | 122 | |
| n2 | 1.44 | 1.23 | 1.11 | |
| R | 0.9994 | 0.9993 | 0.9998 | |
| RMSE (mg⋅g−1) | 1.4 | 1.5 | 0.7 | |
| Model 3: double-layer model with two energies | nNm (mg⋅g−1) | 91.7 | 84.0 | 78.7 |
| C1 (mg⋅L−1) | 487 | 489 | 531 | |
| C2 (mg⋅L−1) | 396 | 402 | 424 | |
| n | 1.31 | 1.39 | 1.47 | |
| R | 0.9982 | 0.9985 | 0.9993 | |
| RMSE (mg⋅g−1) | 6.3 | 4.6 | 3.6 | |
| Model 1 | qe,sat = nNm (mg⋅g−1) | 184 | 168 | 157 |
| Model 2 | q1 + q2 (mg⋅g−1) | 164 | 156 | 147 |
| Model 3 | 2nNm (mg⋅g−1) | 183 | 168 | 157 |
The saturation value is respectively equal to qe,sat = nNm, q1 + q2 = n1 Nm1 + n2 Nm2, and 2nNm for models 1, 2, and 3. These saturation values are reported on Table 5. Both models 1 and 3 are unsuccessful in assessing the actual saturation value. Only model 2 is capable of correctly evaluating this value. Models 1 and 3 fails to track the curves at large concentrations and therefore they diverge progressively from the real trend and yield a biased saturation value. This proves that the statistical models are more powerful than the empirical ones since the best classical model has been faulted using statistical models. Another argument that works against model 3 and consequently model 1 and Hill model is the fact of obtaining the constant C2 less than C1. This leads to assume that the adsorption energy of the second layer Ea2 is greater than the ones characterizing the first layer Ea1. This result is meaningless. For all the above-indicated reasons, models 1 and 3 are rejected. The adoption of the model 2 is corroborated by SEM image (Figure 3) which reveal that the surface is rough, heterogeneous, and contains some cavities.
Figure 8 shows the variation of the evolution of the densities Nm1 and Nm2 as well as the saturation values q1 = n1 Nm1, and q2 = n2 Nm2 as a function of the temperature. All the aove quantitiesaturation values of the two kinds of receptors, namely q1 = n1 Nm1, and q2 = n2 Nm2 decrease when the temperature increases. It is obvious that these quantities are proportional to the number of adsorbed dye molecules per site and the concentration of receptor sites. When the temperature increases, the thermal collisions between dye molecules are intensified whereas the interaction between the adsorbate and adsorbent decays. This is a sign of the presence of a weak binding energy such as hydrogen bonding and/or Van der Waals interactions [45].
Evolution of the densities Nm1 and Nm2, and the saturation values q1 = n1 Nm1 and q2 = n2 Nm2 as a function of the temperature.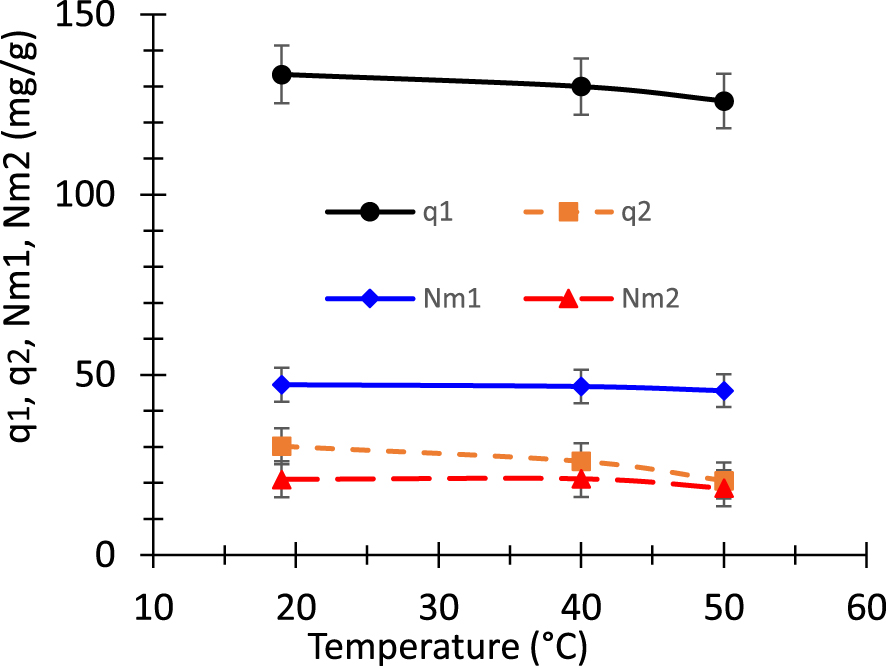
The errors related to the different parameters are provoked by two sources. The first source of error is of course the unavoidable experimental uncertainty. The second source comes from the parameter identification process. Indeed, each parameter may vary in a more or less wide interval while the function to be minimized, i.e. the root means square error, does not change significantly. Therefore, an average value and a standard deviation are obtained for each parameter. Obviously, the model is only considered as acceptable if the standard deviation linked to each parameter is relatively small compared to the mean value of this same parameter. Otherwise, the model is considered unsatisfactory and does not unequivocally fit the experimental data. This criterion is crucial to evaluate the reliability of the parameters deduced from the fit. In the present work, it has been systematically checked. The dependence of the concentrations of receptor sites Nm1 and Nm2 on the temperature is depicted on Figure 8. The concentrations are almost independent of temperature.
It should be noted that since q2 = n2 Nm2 and n2 ranges in the interval from 1.11 to 1.44, the values of q2 and Nm2 are close to each other. However, since n1 takes larger values ant it ranges in the interval from 2.76 to 2.82, the values of q1 and Nm1 are significantly different from each other. This behavior appears clearly in Figure 8.
The steric numbers n1 and n2 are two other important parameters that describe the adopted model. The values of the stoichiometric numbers n1 and n2 versus the temperature are reported in Table 5. These quantities are none other than the numbers of dye molecules captured for each one of the two types of available receptor sites. It appears that both n1 and n2 are greater than one. Therefore, the biosorbent could be attached to 1 or 2 or perhaps 3 dye molecules per site. The stoichiometric number n2 ranges in the interval from 1 to 2 (the limits of the interval should be integer numbers). Therefore, the receptor sites of the second kind are susceptible to be linked to 1 or 2 dye molecules. We designate x21 and x22 be the corresponding percentages of occupation: x21 + x22 = 1. The number n2 is regarded as an average value of 1 and 2 which are weighted by the percentages x21 and x22. We deduce n2 = x21 × 1 + x22 × 2. The two above equations permit the computation of the above percentages. By solving the linear set with two variables and two equations, we obtain percentages x21 and x22 concerning the second kind of receptor sites. More precisely, we obtain that, at the temperature 19 °C, 56% of the occupied sites are linked to only one dye molecule while 44% of the occupied sites are linked to two dye molecules. These percentages vary the temperature. Their respective values are 77% and 23% at 40 °C and 89% and 11% at 50 °C.
According to Table 5, the stoichiometric number n1 ranges in the interval from 2 to 3 (the limits of the interval should be integer numbers). We deduce that the receptor sites of the first kind can be linker to 1 or 2 or 3 dye molecules. We designate by x11, x12, and x13 the corresponding percentages of occupation. These percentages satisfy the equation x11 + x12 + x13 = 1. Since the number n2 is regarded as an average value of 1, 2, and 3 which are respectively weighted by the percentages x11, x12, and x13, we deduce that n1 = x11 × 1 + x12 × 2 + x13 × 3. The two above equations are not sufficient to obtain the values of x11, x12, and x13. The range of each quantity can be computed. For example, when the temperature is 40 °C, x11 varies from 0 to 11%. We deduce that x12 and x13 vary from 22% to 0% and from 78% to 89% respectively. These values depend on the temperature. It appears that the value of x13 is larger than x11 and x12. We can conclude that the predominant part of first-type receptor sites adsorbs three MB molecules. Hanafy et al. used a multilayer model to investigate the removal of remazol black B dye using natural and carbonized pine-fruit shells. The obtained steric number n ranges from 0.83 to 1.83 for the natural product, and from 1.10 to 2.88 for the carbonized product [65]. The increase of the value of number of the adsorbed dye molecule by adsorbent binding site was imputed to the generation of adsorbent porosity. The number n depend on many factors and principally the temperature. When, the number n increases, the adsorption capacity increases also. Pang et al. investigated the adsorption of indigotine blue dye onto a CoFe2O4/chitosan magnetic composite. Depending on the temperature, the number of dye molecules per adsorbent site varies from 3.66 to 3.83. Pang et al. speculated that each receptor site was anchored to an average number of dye molecules varying in the range from 3 to 4. They consequently deduced the proportion related to each case [5]. Sellaoui et al. studied the adsorption of MB on Brazilian berries seeds. They showed that the monolayer model with two energies is the most adequate one to fit the experimental data. Two functional groups are therefore involved in the pollutant removal. The steric numbers obtained may be smaller or greater than one. They ranges from 0.35 to 2.44 [63]. It should be mentioned that the value of steric number n also informs us on the nature of the anchorage orientation. In fact, three cases may be generally encountered. The first situation correspond to the case n > 1. The inclination of dye molecules captured the biosorbent is called horizontal inclination. Indeed, each receptor site is linked may one or more dye molecules [3]. In the second case, the steric number ranges between 0.5 and 1: 0.5 < n < 1. In this configuration, a mixed inclination occurs. Parallel and horizontal are simultaneously present. The steric number n may be decomposed as: n = x × 0.5 + (1 − x) × 1 where x is the percentage of molecules having a parallel orientation while (1 − x) is the percentage of molecules having a non-parallel orientation [64]. In the third configuration, we have 0 < n⩽1. The biosorbent captures a fraction of a dye molecule. This case is called parallel orientation or multi-molecular mechanism. A dye molecule is shared by several receptor sites. To obtain the number of sites involved, one can use the decomposition of the anchorage number 1∕n [64, 45].
Evolution of the adsorption energies Ea1 and Ea2 as a function of the temperature.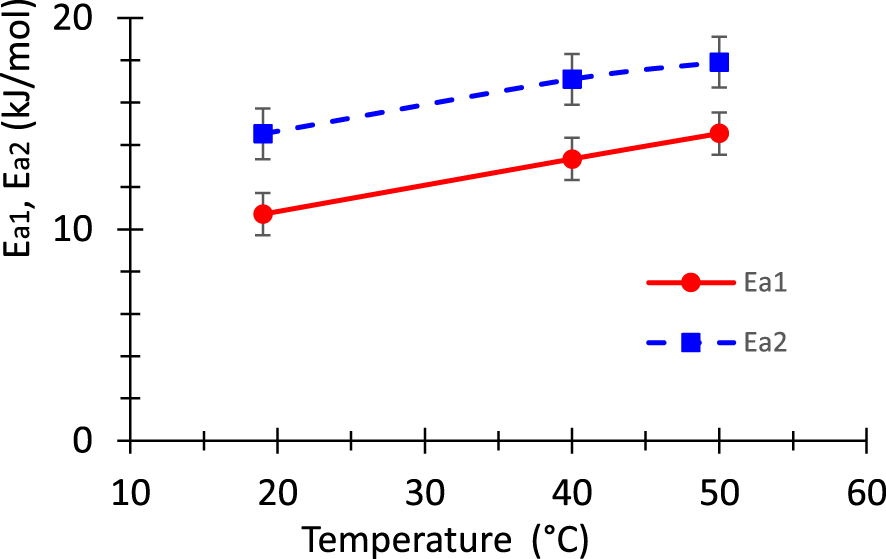
The half-saturation concentrations C1 and C2 are the last two parameters involved in model 2. These values give the concentration for which half available sites, of each type, are occupied. The greater this quantity, the more the isotherm will be dilated and the saturation will be reached for greater values of the concentration. Table 5 indicates that the half-saturation concentration C1 is almost independent of temperature however C2 varies moderately versus the temperature above the investigated range. It appears that C1 is almost four times greater than C2. We deduce that the adsorption energy Ea1 is about 1.4 times smaller than the activation energy Ea2.
The adsorption energies Ea1 and Ea2 associated to the two types of receptor sites are calculated from values of half-saturation concentrations C1 and C2. Figure 9 shows the curves of these energies versus the temperature. A continuous increase of these energies is observed versus the temperature. The obtained results have the same order of magnitude as that reported in previous papers [42, 43, 63]. The obtained values of the adsorption energy corroborate the several above mentioned comments about the physio sorption nature of the adsorption mechanism occurring in the current samples. The value of the adsorption energy obtained by the advanced model is considered to be more truthful compared to that obtained by the classical models. Indeed, the monolayer model having two kinds of receptors proves to be the most suitable to represent the experimental results. This model takes into account the heterogeneities on the biosorbent surface. The above discussion reveals clearly that not only the experimental results are important, but also the data processing process.
4.6. MB adsorption mechanisms exploration
The probable adsorption mechanisms concerning the interaction between the cationic dye and the investigated biomaterial is depicted in Scheme 1.
Probable adsorption mechanisms for the binding between the dye and biosorbent surface.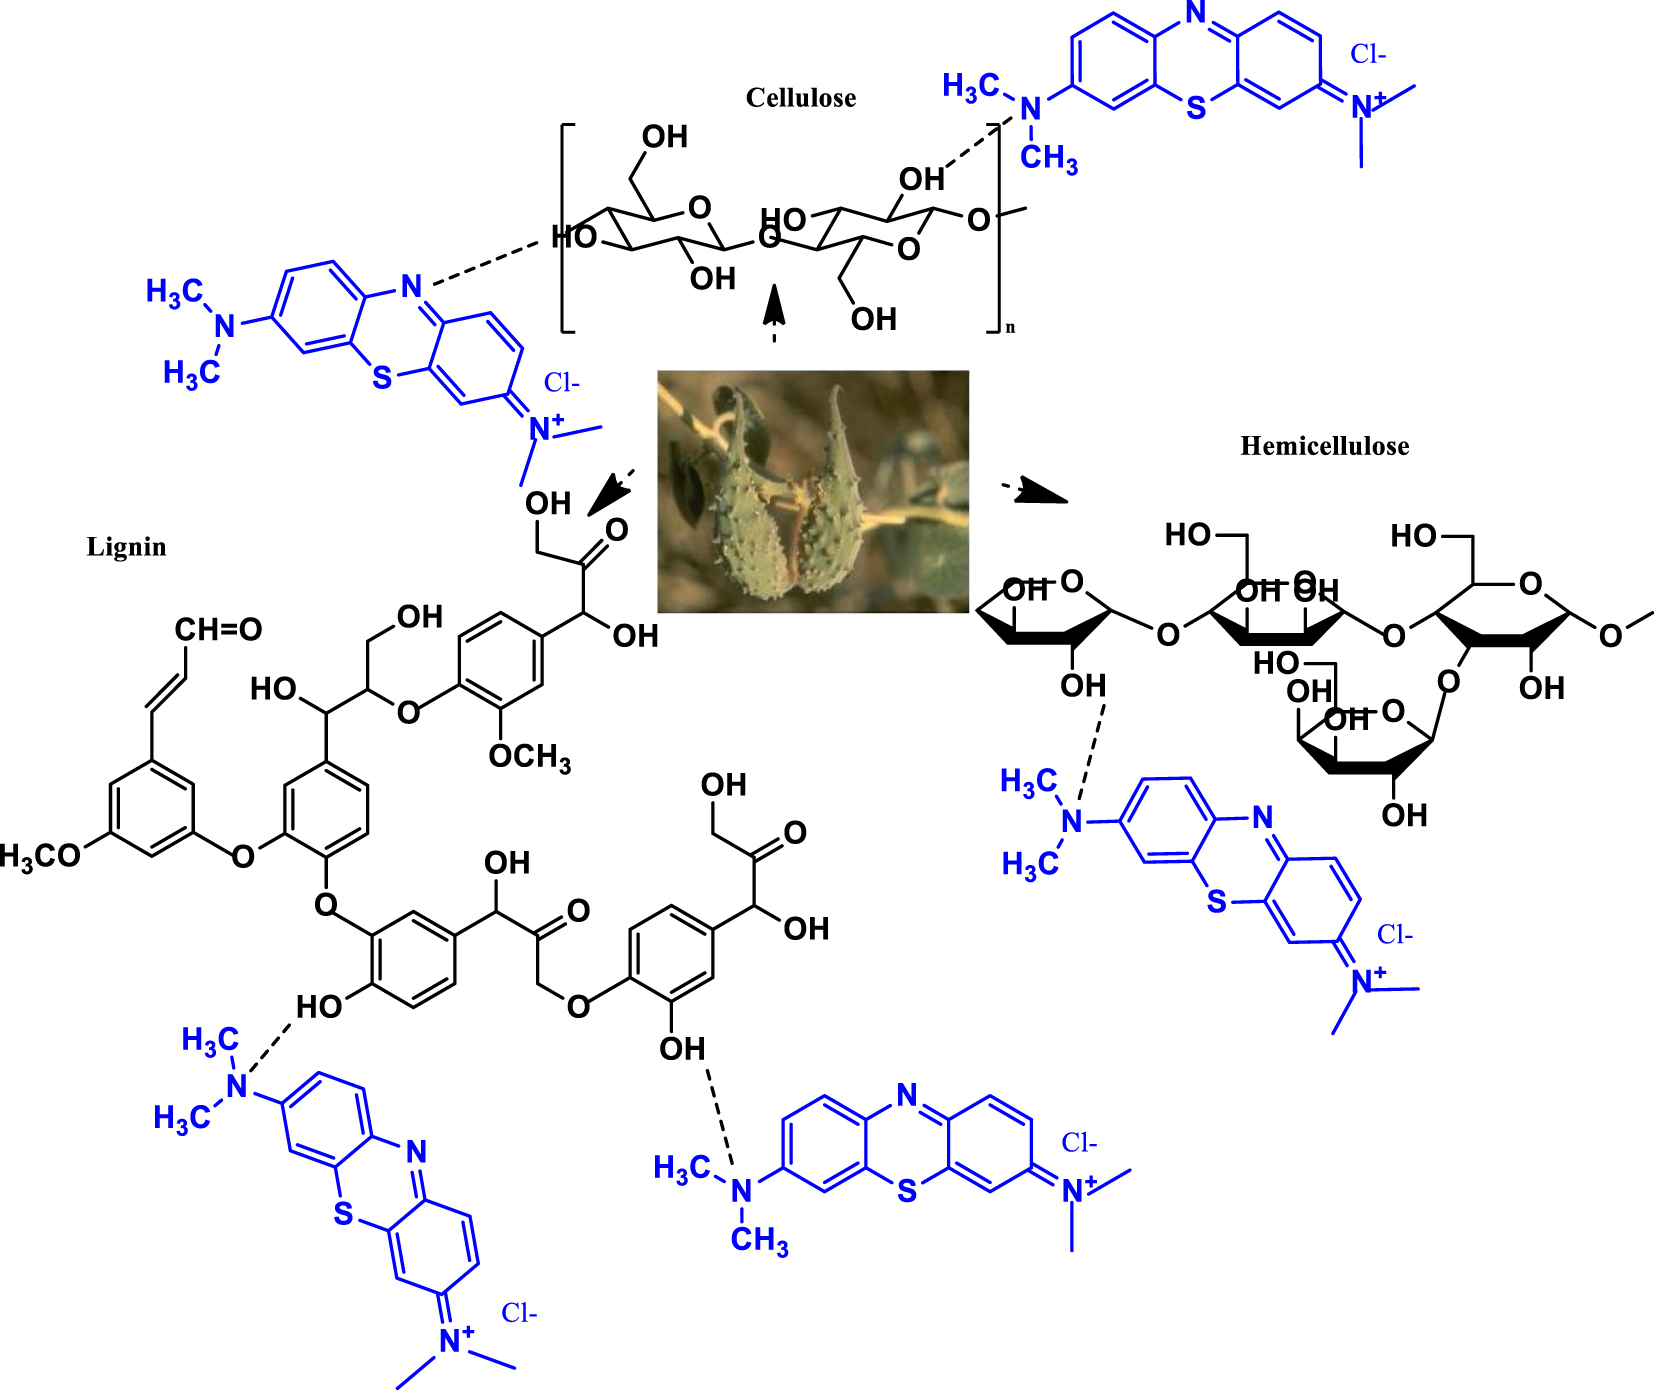
5. Conclusion
The first part of this work focused on the characterization of a low-cost biomaterial, namely the Pergularia tomentosa fruit. The second part is dedicated to investigating the capacity of this biomaterial for the adsorption of methylene blue. The kinetic curves prove to be accurately adjusted by either pseudo first order and Bangham models. The biosorption isotherms have been adjusted by classical and statistical models. Concerning the classical models, Hill model proves to be the most suitable to adjust the experimental data. In addition, the mean free energy Ead for the adsorption of the cationic dye onto the biomaterial is about 7 kJ/mol according the Dubinin–Radushkevich model. Concerning the advanced statistical physics models, it appears that the most appropriate model is the monolayer model which involves two types of receptors sites. Each receptor has its own adsorption energy, namely Ea1 and Ea2. In other words, two functional groups are involved in the dye removal process. Furthermore, each receptor site can be linked to a variable number of dye molecules. The superiority of this model over the classical models has been demonstrated. The adsorption energy Ea1 ranges in the interval from 10 to 15 kJ/mol while the adsorption energy Ea2 varies in the interval from 14 to 18 kJ/mol for the investigated temperature. This implies that the nature of the adsorption process taking place in the present biomaterial is physiosorption. These values are of course more accurate than that estimated from Dubinin–Radushkevich model. The half-concentrations have also been computed. Concerning the stoichiometric numbers inherent to the adopted model, it appears that the investigated biosorbent can be attached to a variable number of dye molecules per site. This number varies from one to three depending on the temperature and the involved functional group. The error on the above parameters due either to experimental uncertainty or the identification process has been evaluated. In summary, the investigated biomaterial proves to be attractive for the efficient elimination of cationic dyes from contaminated water.
Conflicts of interest
The authors declare no conflict of interest.
Authors contributions
All co-authors (HB, MS, TA, ZR, AB, MJ, and TA) contributed in all parts of the manuscript.
Funding
Deputyship for Research & Innovation, Ministry of Education, Saudi Arabia, Project Number (IFP-2020-11).
Acknowledgments
The authors extend their appreciation to the deputyship for Research & Innovation, Ministry of Education in Saudi Arabia funding this research work through the project number (IFP-2020-11).