


 CC-BY 4.0
1. Introduction
The development of pharmaceutical industries led to an increase in the consumption of antibiotics by humans for multiple medical purposes. Unfortunately, their excessive application led to their displacement at large quantities in the environment, which affected the ecosystem equilibrium and the native fauna, flora, waters, and soils, thus reducing their assimilative capacity towards other organic and inorganic pollution. Furthermore, of these organic contaminants in the natural soils became a source of antibiotic-resistant bacteria, leading to serious mass contaminations and pandemics [1]. It is worth mentioning that detecting pharmaceuticals in water as a new barrier to access for clean water has interested scientists in focusing their research activities on their sources and occurrences in the environment witnessing.
Recently, pharmaceutical compounds can be introduced in the environment differently as parent compounds or by-products issued from human/animal metabolic activities or by disposal of unused or expired drugs and accidental spills in nature [2]. Therefore, the existance of antibiotics in the environment at low concentrations ranging from 1 μg⋅L−1 to ng⋅L−1 is detected thanks to the advanced analytical methods [3]. Oxytetracycline (OTC) belongs to the tetracyclines antibiotic family and is widely used in veterinary chemicals, with a stable naphthol ring as the main structure to the microorganism in wastewater [4]. The occurrence of OTC in the environment may lead to the development of antibiotic-resistant strains in microorganisms, which can be transferred to humans and animals through food and drinking water [5].
Numerous treatment approaches for the removal of antibiotics have been considered in recent studies, including reverse osmosis, biodegradation, membrane filtration, photocatalysis, photo Fenton reaction, ozonation, and peroxidation [6]. Despite their confirmed treatment performances, these techniques are unfortunately limited at some levels that might hamper their overall economic feasibility, especially for pollutants at trace levels or relatively high concentrations [7, 8]. The adsorption onto activated carbon could be considered an efficient approach and presents a practical alternative for removing pollution [9, 10]. There is, therefore, a growing interest in novel and low-cost adsorbents. It is to be stressed that obtaining carbon from biomass waste as a biological material derived from plant residues is comparatively cheap. This is because of their large availability, low cost, the ability to be converted easily into highly porous carbon as well as the possibility of regeneration for multiple uses.
Artichoke, a commonly consumed vegetable in the Mediterranean food style, represents a significant share of household bio-organic wastes. It is part of a circular economy and sustainable development concepts. The disposal of these lingo-cellulosic materials in nature might result in serious environmental issues, including the fungi development and the disruption of N, P, and K of the surrounding environment [11]. Moreover, it would be interesting to maximize the physicochemical properties of these wastes into largely-employed added-value materials for multiple environmental purposes. Hence, the artichoke waste conversion into an effective adsorbent for water purification at multiple cycles offers the possibility for water recovery to reduce the risk of hydric pollution [9, 12].
This study aims to properly manage artichoke residues as an example of households and abundant agricultural waste as a precursor for activated carbon production. Moreover, this research describes the preparation of activated carbon from artichoke bio-waste by H3PO4 activation to report the kinetic of batch adsorption of OTC molecules used in veterinary activities. This investigation will be achieved by examining the effect of the pH, adsorbent dose, initial OTC concentration, and temperature on the kinetics in a combined manner and the applicability of lumped kinetic models to describe the adsorption process. Equilibrium data are also included to support the kinetic findings. In addition, computational modeling using density functional theory (DFT) is considered a complementary tool to understand the adsorption behavior and their nature better and explain the interactions energies between adsorbent/adsorbate systems, which contribute to OTC removal from aqueous solution. Furthermore, the results obtained here make them suitable and valuable for other environmental applications, including water treatment processes such as filtration and gas purification.
2. Materials and methods
All chemicals and reagents were of analytical grade, and supplied from standard sources. Orthophosphoric acid (H3PO4, Sigma-Aldrich, 86%), hydrochloric acid (HCl, Biochem, 37%), sodium hydroxide (NaOH, Merck, Oxytetracycline (OTC, C22H24N2O9, MW = 460.43 g⋅mol−1) were acquired from Sigma Aldrich (China; 95–102%). The structural formula of OTC is illustrated in Supplementary Figure S1. The OTC stock solution was prepared at a concentration of 1000 mg⋅L−1, and the appropriate volume was diluted to the distilled water to obtain the desired OTC concentration. The pH was measured by a HI 2210 pH meter (Hanna instruments, Rhode Islands, USA). The removal efficiency of OTC was determined by measuring the residual concentration in the filtrate spectrophotometrically using a UV–visible spectrophotometer (Shimadzu 1800, Tokyo, Japan) at a maximum wavelength of 354 nm.
2.1. Adsorption experiment
The adsorption experiments were carried out in a 1000 mL double welled Pyrex reactor, in which OTC solution and a known amount of adsorbent were mixed at room temperature (25 °C). The pH was adjusted by adding HCl or NaOH using a pH meter (HANA 2210). To study the optimal conditions such as the contact time, the initial pH of the solution (1–11), the amount of adsorbent (0.1–2 g), the initial OTC concentration (50–200 mg⋅L−1), and the temperature (20–50 °C).
The aliquots were withdrawn at regular times and separated by centrifugation. The experimental protocol was investigated by changing only one parameter once for a given test, while the others were kept constant. All experiments, including blank tests, were performed in triplicate.
2.2. Preparation and characterization of the adsorbent
The biomass agriculture waste precursor, i.e., Artichoke (origin west north Algeria), is thoroughly washed with distilled water, dried in an oven at 80 °C until the obtention of constant weight, then mechanically ground into powder. Afterward, the precursor is impregnated with H3PO4 solution with a ratio solid to the volume of 1:1 using a stirring reactor for 12 h. The mixture was then filtered, recovered, and dried at 100 °C.
The activated precursor was subsequently carbonized at 500 °C in a thermally controlled furnace (Nabertherm, Germany) with a linear rise of 5 °C⋅min−1 for 1 h. The obtained product is washed with hot distilled water to leach the ash from carbon and remove the acid trace until getting a neutral pH. Finally, the black residue is dried at 100 °C for 24 h, after which it was ground again, sieved, and denoted ACT until obtaining a powder with an average particles size of about 200 μm. The produced activated carbon was then stored in an airtight glass container for subsequent use.
Physical and chemical characterizations of the ACT are investigated to characterize better the morphological structure and the chemical composition of the adsorbent surface, which are helpful to make hypotheses on the adsorption process mechanisms.
2.2.1. Physical characterization
The surface area and the pore size distribution of the samples were determined by N2 adsorption/desorption at −77 K using a Micromeritics Tristar 3100. Before gas adsorption analysis, the sample was outgassed at 573 K for 4 h, porosity. The micropore surface area and micropore volume were obtained via t-plot analysis. Pore size distribution (PSD) was estimated by a Non-Local Density Functional Theory (NLDFT) method using nitrogen adsorption data and assuming a slit pore model. The textural properties and morphologies were studied through scanning electron microscope SEM (FEI Quanta 200, SEM) and X-ray diffraction (XRD) Xpro Philips.
2.2.2. Chemical characterization
The prepared activated carbon was characterized using various techniques. These techniques are its zero-point charge as cited previously [13, 14, 15, 16], chemical elemental composition analysis by X-ray fluorescence spectrometry (XRF), Rijuka Zsxpriness II, and Fourier Transform Infrared Spectroscopy (ATR-FTIR) using a spectrometer Brucker Alpha one.
2.3. Theoretical study
The adsorption energy is regarded as a critical parameter to understand the behavior and nature of the adsorption mechanism. This parameter distinguishes the physical or chemical adsorption process mechanism of OTC onto ACT. As reported in the literature, strong adsorption can be related to the higher negative energy [10, 17, 18, 19, 20, 21]. Frequently, the Eads values determine the physisorption or chemisorption interaction nature [13]. The following formula can give the OTC adsorption energy (Eads) onto ACT [14]:
| (1) |
For the reaction mechanism occurring between the OTC surface functional groups and the different functional groups existing on the adsorbent surface such as COOH, OH, C=C, C=O, C–H, P–O–OH, P–O–C, and P–O–P, a schematic diagram and the obtained cluster models of the ACT, are established according to the DFT calculation.
3. Results and discussion
3.1. Adsorbent characterization
3.1.1. FTIR analysis
The FTIR analysis provides information about the nature of surface functional groups and the efficiency of the activation process with the H3PO4 chemical agent. The IR spectra of raw artichoke biomass and activated carbon ACT measured within the range of 400–4000 cm−1 are presented in Figures 1(a) and (b).
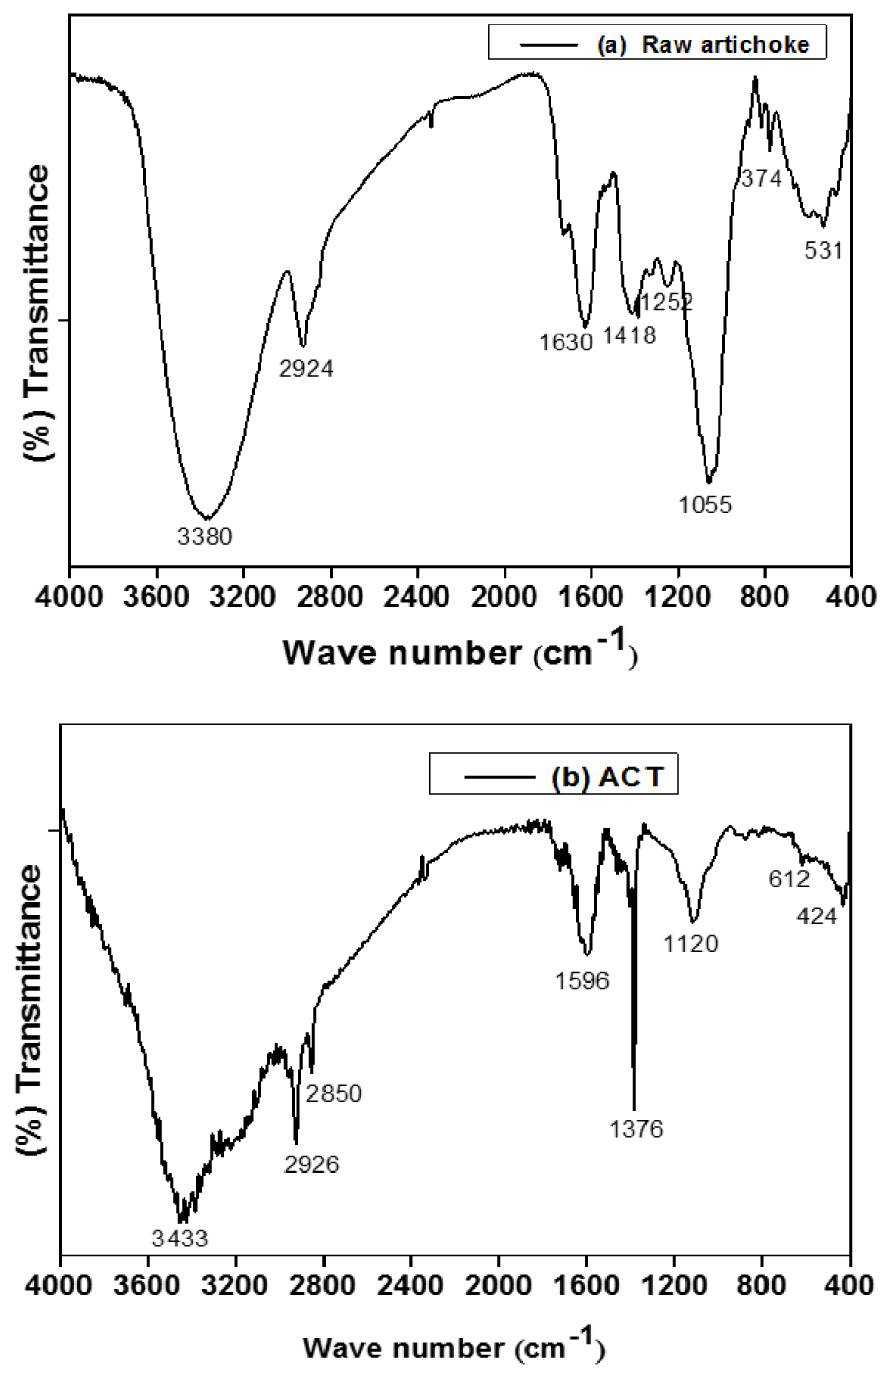
FTIR spectra of the raw artichoke (a) and ACT (b) adsorbents.
The FTIR spectrum shows a fingerprint region of 1630–400 cm−1 for the source identification of biomass raw Artichoke in Figure 1(a) shows the most complicated and apparent spectrum. The FTIR spectra are displayed in Figures 1(a) and (b). Before activation (Figure 1(a)), the broadband at 3380 cm−1 corresponds to the O–H groups. The band that appeared at 2924 cm−1 can be assigned to C–H stretching related to alkanes (CH2) deformation and alkyl groups C–O–C stretching.
A strong conjugated C=C peak was also observed around 1630 cm−1; the transmittance at 1418 cm−1 could be assigned to the bending OH vibration of hydroxyl groups.
774 cm−1 was identical to C–H in (CH3) deformation and (CH2)n groups, respectively, while the carboxylic group was shifted to 1055 cm−1. The band at 531 cm−1 was related to –C–C stretching of cellulose and hemicellulose.
Figure 1(b) corresponds to the activated carbon ACT displays an absorption band around 3553–3263 cm−1 can be attributed to –OH associated with the stretching vibration of water, phenols, and alcoholic groups. The strong bands of OH stretching vibrations are observed after activation [22]. The peak at 2926 cm−1 is assigned to the C–H bonds stretching vibrations of aromatic rings groups. The distinct bands at 2850 cm−1 belong to C–H symmetric bond stretching vibration in the group CH2. The spectra show a pronounced band at 1696 cm−1 assigned to the aromatic carbon, or carboxyl groups, C=C stretching vibration in aromatic rings or stretch of C=O in –COOH group of the structure of activated carbon [23].
However, the band at 1658 cm−1 corresponds to the C=O elongation vibrations in the plane of the aromatic rings. A low peak at 1376 cm−1 corresponds to the C–H bond in the CH3 group. Nevertheless, it is also characteristic of the phosphorus, and phosphorus–carbon compounds in H3PO4 activated carbon. The peak at 1120 cm−1 can be attributed to the elongation mode of the hydrogen-bond POOH groups of the phosphates or polyphosphates to the elongation vibration of the O–C in the P–O–C (aromatic rings) bond [19]. A low peak at 424 cm−1 corresponds to the phosphoric element or aromatic structure of ACT. In addition, as a significant effect, the activation with H3PO4 increases the amount of oxygen in different functional groups such as carboxylic, phosphate groups, hydroxyl, and phenolic hydroxyl on the activated carbon surface.
3.1.2. Determination of pHpzc
These properties are essential because the interactions between the functional groups of the ACT surface and the ions in the solution strongly depend on the superficial charge. 25 mL of 0.01 M NaCl was placed in different closed Erlenmeyer flasks and added 0.1 M of NaOH or 0.1 M of HCl solutions for adjusting the pH value from 2 to 10 for each flask. Then 0.25 g of ACT was added and stirred for 24 h to reach equilibrium at ambient temperature.
The plot to determine the point of zero charges for ACT is represented in Figure 2. The pHpzc corresponds to the intersection point of the pHini, and the pHfin plot demonstrated a zero charge of the material. It was found to be equal to 3.7, close to pHpzc values found by many investigators preparing activated carbon by H2SO4 [20, 21].
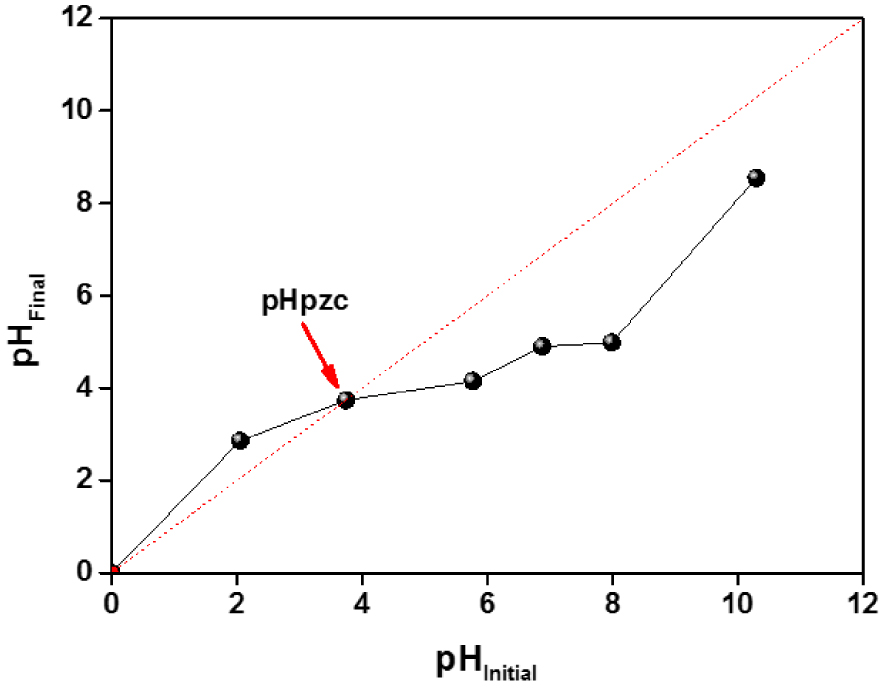
Determination of the pHpzc of the ACT.
The pHpzc value suggests that ACT is acidic; this indicates that the concentration of active sites is greater than that of the basic one of the ACT surfaces. After oxidation, a large number of O–C=O groups were introduced in the material, which increased the surface acidity significantly.
At low pH 3.7, the adsorbent material presents a positive surface charge and a negative charge for pH > pHzc, since OTC is linked to the ACT structure, and the functional groups were strongly protonated.
3.1.3. Surface area and pore characteristics
The characteristic of ACT material, such as the specific surface area, the pore size, and distribution, were determined from nitrogen adsorption-desorption isotherm at 77 K using the BET method and the Non-Local Density Functional Theory (NLDFT) software for analysis. Table 1 summarizes the textural properties of produced ACT.
Figure 3 exhibits the isotherm adsorption–desorption of nitrogen for ACT prepared by chemical activation. As observed, the adsorption isotherm of N2 onto ACT corresponds to a type I or IV isotherm according to the IUPAC classification with an H3 hysteresis loop, typical of character.
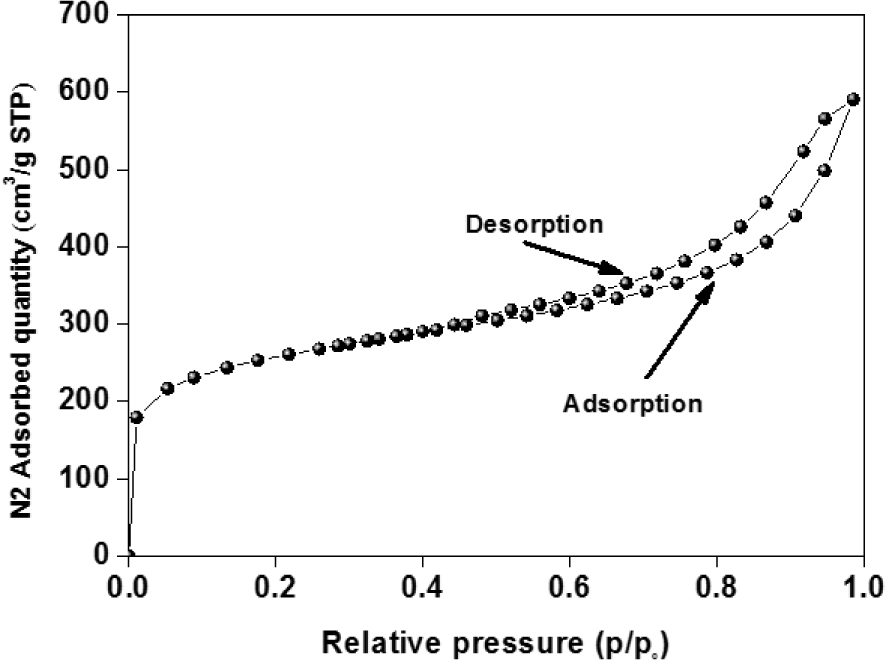
Adsorption and desorption isotherms of N2 at 77 K for ACT.
Characteristics of activated carbon
| Physical properties | Values |
|---|---|
| DFT pore size (nm) | 20.35 |
| Surface external (m2/g) | 475.05 |
| Surface interne (m2/g) | 429.79 |
| Surface BET (m2/g) | 904.8 |
The plateau of the isotherm at high relative pressures (P∕Po) results from the presence of the mesoporous structure. For the obtained material, the percentage of the surface area attributed to mesopores and micropores to the total surface area are 52.5 and 47.74%, respectively. More specifically, the isotherms of ACT display a relatively large hysteresis loop, suggesting the existence of larger size pores and high specific surface area. As a result, the BET-specific surface area (SBET) for the ACT can be determined as 904.848 m2⋅g−1.
The SBET of ACT compared to various activated carbon materials prepared by chemical activation with H3PO4. It was unearthed that ACT has a suitable surface area, making it a promising adsorbent for OTC and other pollutants such as dyes and metals [24, 25, 26].
In addition, compared to those data found in the literature, this study shows that the phosphoric acid activation process is an exciting approach for activated carbon production. This result could be due to the phosphoric acid action that moves impurities from precursors’ materials [27, 28].
Therefore, it can be inferred that the excellent SBET and the development of large mesoporous structure 52.5% with a portion of micropores created by the chemical activation leading to the high adsorption of OTC molecules.
3.1.4. Chemical composition analysis
The XRF analysis involves the determination of element composition.
XRF analysis of ACT
| Element | Wt (%) |
|---|---|
| C | 88.90 |
| O | 09.18 |
| Na | 00.18 |
| Al | 00.08 |
| P | 00.99 |
| S | 00.09 |
| Cu | 00.33 |
| Zn | 00.24 |
The analysis results depicted in Table 2 indicated that C and P are the major abundant cotenant and Na, Mg, Al, Si, S, Ca, Fe, Ni, Cu, and Zn at trace level. The high carbon yields are due to the original composition of raw biomass of cellulose, phenolic, and lignin, while the P content is original chemical activation agent.
3.1.5. X-ray diffraction (XRD) analysis
The XRD analysis result of the ACT adsorbent is shown in Figure 4. The activated carbon is amorphous and composed of microcrystalline carbon fragments randomly. It has graphite-like microcrystalline, single reticular plane carbon, and non-organized parts. Figure 4 illustrates the XRD pattern of ACT activated with H3PO4 at 500 °C shows characteristic peaks at 2𝜃 = 28° and can be indexed to (002) and (100) diffraction for typical graphite carbons [29]. Furthermore, the broad peak detected at 2𝜃 = 28° indicates amorphous ACT.
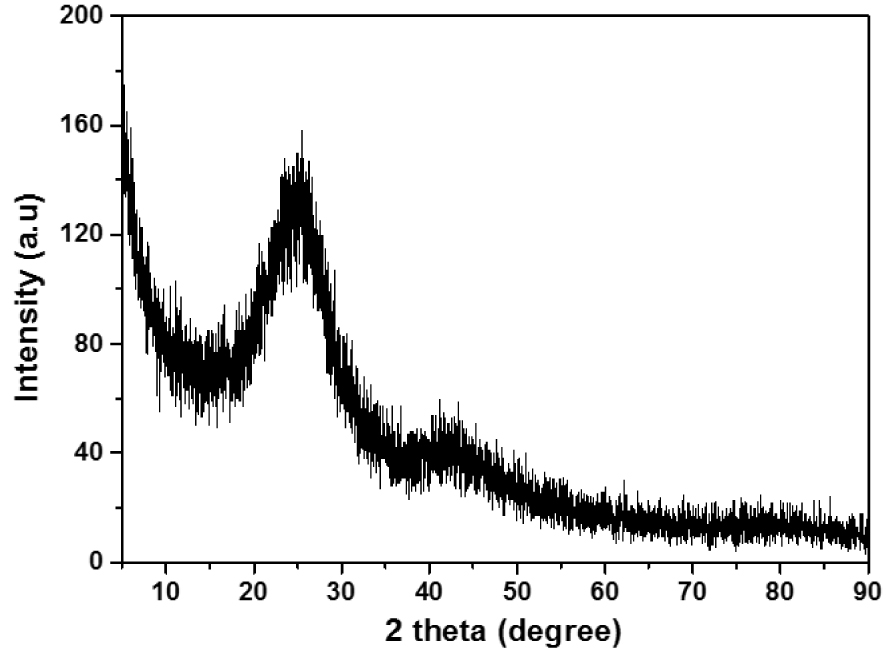
XRD diffractogram of the ACT.
3.1.6. SEM analysis
The scanning electron microscopy (SEM) was adopted to visualize the sample morphology of the prepared ACT using the SEM model (FEI Quanta 200) operating at 15 kV acceleration voltage and the analysis is portrayed in the photographs Figure 5(a,b).
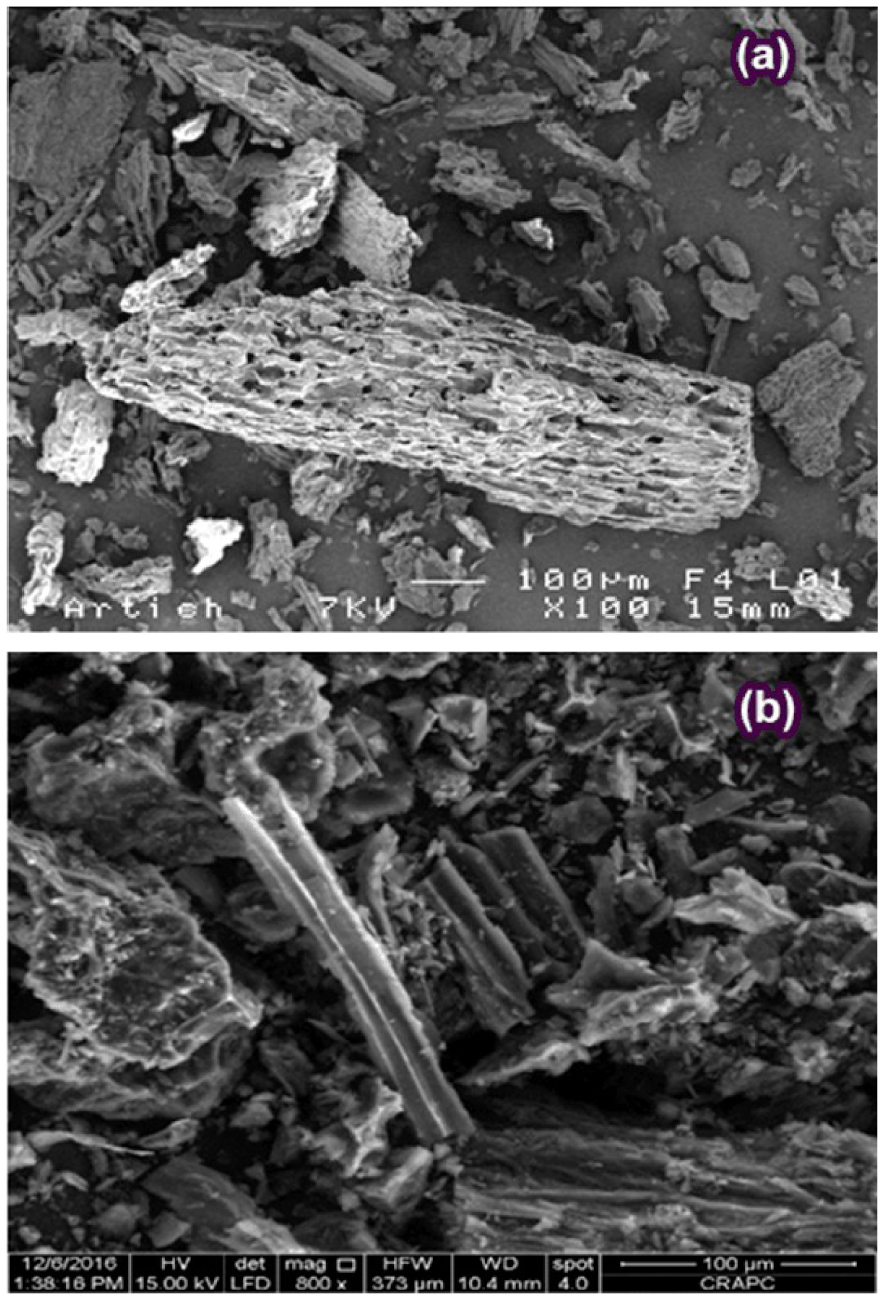
SEM analysis of raw artichoke biomass (a) and ACT (b).
It can be observed that the surface of raw biomass, as displayed in Figure 5(a), was heterogeneous form, highly packed, poreless, and had smaller cavities. These characteristics suggest that the raw Artichoke biomass comprises lignin, cellulose, and hemicellulose.
Figure 5(b), shows that the activation at 500 °C with H3PO4 resulted in the creation of a considerable number of pores due to the removal of volatiles matter. These findings have been approved by the well-developed pores observed on the surface of the ACT (Figure 5(b)). Pore development in the ACT during the activation process was also signeficant. This phenomenon would enhance the ACT surface area and pore volume under the diffusion of H3PO4 molecules into the pores, thereby increasing the
3.2. Adsorption study
3.2.1. Effect of the initial pH
The pH variation is considered to simulate and highlight the real conditions concerning the interpretation of the functional groups’ manifestation that leads to the acidic or basic character of the adsorbent surface. It causes the protonation states of OTC molecule and the structure that can involve different mechanisms of complex action responding to divers pH values of the solution with adsorbent [32].
Batch adsorption experiments were performed using a fixed dose of adsorbent (1 g⋅L−1) at 25 °C, initial OTC concentration (50 mg⋅L−1). The pH was adjusted over the range of 2 to 11 by adding either NaOH or HCl (0.1 M) solutions.
The obtained results are illustrated in Figure 6. As can be seen, the OTC uptake decreased at low pH when pH is below 5.8, and the removal capacity of OTC is affected by increasing pH from 2 to 4; the higher OTC removal is noted at pH ∼ 4.81. However, the adsorption capacity decreased sharply from 16.5 to 30 mg⋅g−1 when pH varied from 4.88 to 10.44. These results were consistent with those found by Zhao et al. [33, 34]. These adsorption values were consistent with the results of Zhao et al. [35, 36]. They examined the adsorption of diclofenac onto goethite under different pH and found that the adsorption capacity strongly depends on the solution pH [35]. Earlier, they investigate the adsorption behaviours of OTC onto Sediment in the Weihe River at different solution pH. They did not remark any effect on the adsorption capacity at pH ranging from 4.0 to 7.0. Still, they noticed a decrease in the 2.0 to 4 and 7.0 to 9.0 ranges.
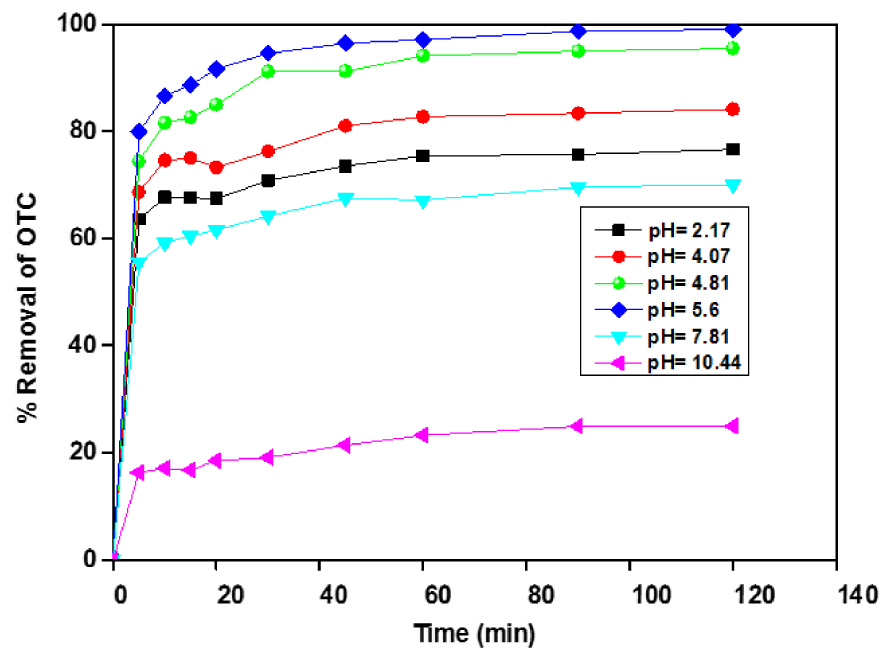
Effect of pH on the adsorption of OTC onto ACT, ACT dose = 1 g⋅L−1, [OTC] = 50 mg⋅L−1.
The decrease in adsorption capacity could be explained by the decreasing of electrostatic attractions between the ACT surface and OTCH3+ (cationic or positive) species. Furthermore, at low pH values, the competition between H3O+ and
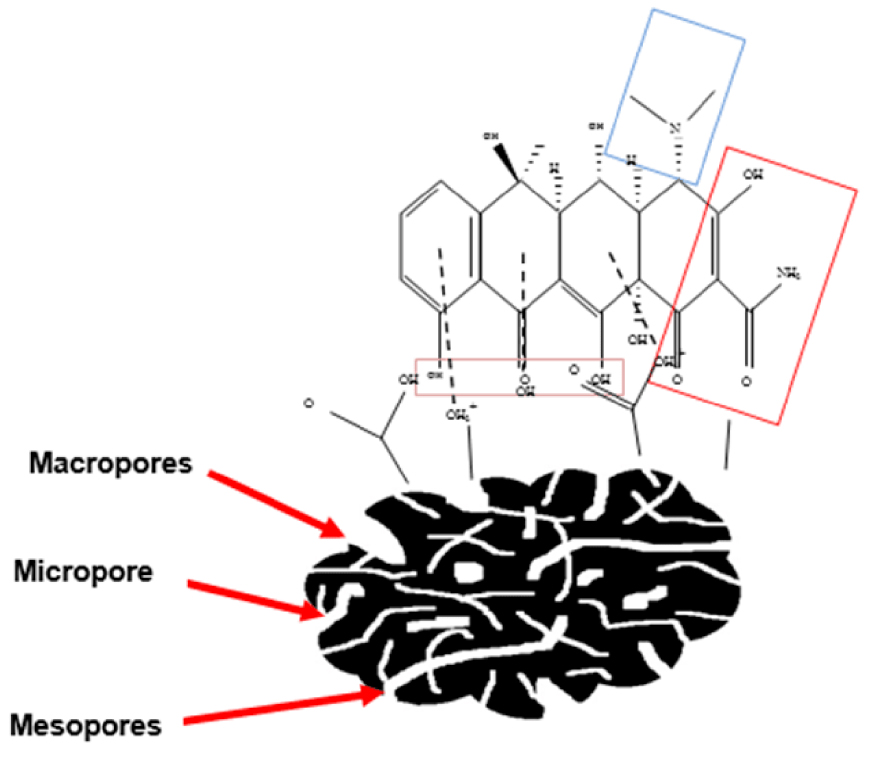
Schematic mechanism of OTC adsorption onto ACT.
3.2.2. Effect of the adsorbent dose
The adsorbent amount is considered a significant parameter in the adsorption phenomenon. Since the surface is available and subsequently, the ACT dose can considerably affect the overall performance of the adsorption process. Its effect on the OTC adsorption was investigated by introducing different amounts ranging from 0.2 to 2 g⋅L−1 into 100 mg⋅L−1 OTC solution at free pH∼5.8 and 25 °C (Figure 8).
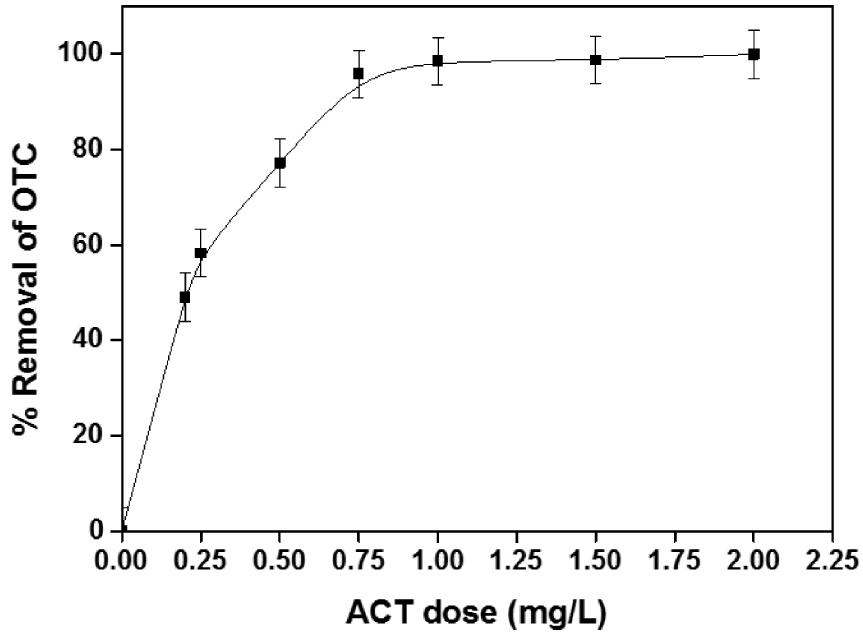
Removal versus adsorbent dose, pH = 5.5, [OTC] = 100 mg⋅L−1.
The OTC removal increases to 98.54% with raising the ACT dose to 1 g⋅L−1 and remains almost unchanged after that. It can be discerned that the amount of OTC adsorbed qt (mg⋅g−1) declined significantly from 99.43 to 51.058 mg⋅g−1 when raising the adsorbent dose. This trend can be accredited to the availability of many unsaturated binding sites on the adsorbent surface during the adsorption process [39] Figure 8. For an ACT concentration of 1 g⋅L−1, the qe and R (%) were 99.43 mg⋅g−1 and 98.54%, respectively, for 100 mg⋅L−1 of OTC.
This phenomenon may be due to the decrease in total adsorption surface area available to OTC resulting from overlapping or aggregating adsorption sites [40].
3.2.3. Effect of OTC initial concentration and contact time
The influence of OTC initial concentration on the mass transfer between the OTC bulk solution and the ACT solid phase is investigated in a batch reactor for various OTC concentrations varying between 50 and 200 mg⋅L−1. Therefore, it is carried out with a fixed amount of adsorbent of 1 g⋅L−1 at pH ∼ 5.5 and 25 °C. The obtained results are exposed in Figure 9. A sharp increase of the adsorption capacity with increasing initial pollutant concentrations can be seen. The same figure also reveals that the adsorption of OTC for different concentrations appeared to have similar kinetic behavior. However, at low concentrations, the rate of adsorption was higher and saturated rapidly related to more active sites for the adsorption. This behavior indicates that high concentration contributes to saturating the adsorption site and provides a significant driving force for the migration of OTC molecules to overcome the mass transfer resistance of OTC on the adsorbent solid surface [41].
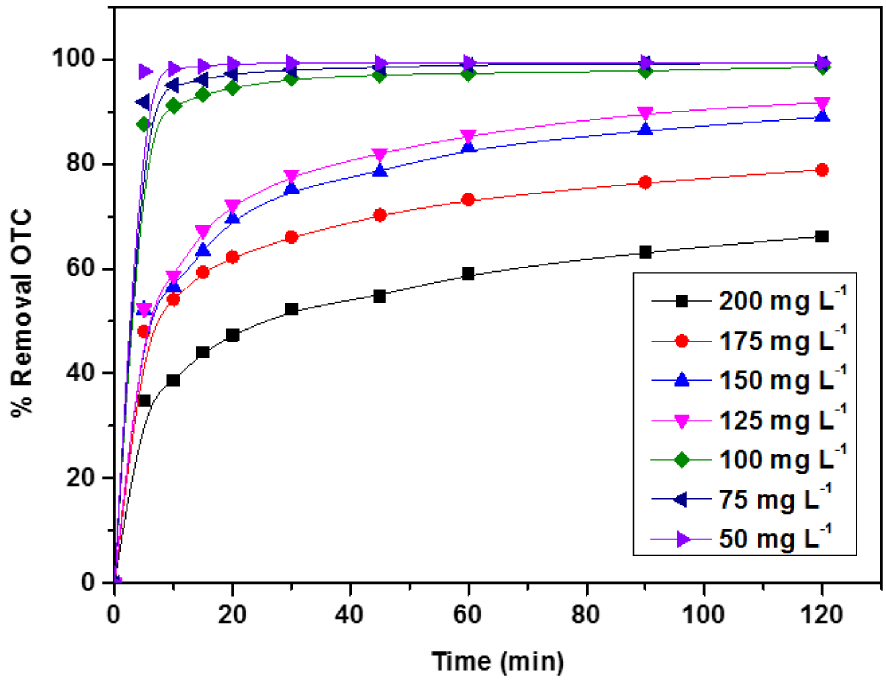
Effect of initial concentrations on the OTC removal (%) on ACT, pH = 5.5, ACT dose = 1 g⋅L−1.
In addition, the results shown in Figure 9 demonstrate that the adsorption kinetics are subdivided into two steps. The first step, the adsorption, is extremely rapid at the initial stage for the low initial concentration; this Behavior is related to the external diffusion and slows down as the diffusion of the adsorbate into the interior surface of the particles the adsorption proceeds. In the first 30 min, the percentages of total amounts adsorbed are about 99.26%, 96.28%, and 74.10% for initial OTC concentrations 50, 100, and 200 mg⋅L−1, respectively. After that, the second step is slow until the constant concentration reaches an equilibrium time within 120 min due to the available OTC molecules in solution and their slow pore diffusion into the bulk of adsorbent [42].
The results can also be related to hydrophobic interactions between OTC molecules and ACT materials [43]. Furthermore, OTC aggregation may also occur on the adsorbate surface at high OTC concentrations. The OTC adsorption capacity (qe) increases from 50 to 165 mg⋅g−1 with increasing initial OTC concentration from 50 to 200 mg⋅L−1; this behavior indicates that ACT is not efficient at high OTC concentrations, and this step elucidates the intraparticle diffusion as the dominant mechanism in the kinetic adsorption process.
4. Equilibrium isotherms and kinetic models
The equilibrium adsorption isotherm study is fundamental to reveal that the adsorption performance could indicate the surface properties, the affinity of adsorbent, and the distribution between the solution and the adsorbent phase, instead of understanding the adsorption mechanism onto activated carbon, as well as the nature of molecular forces. Besides, this isotherm is valuable in estimating the adsorption capacity and the effectiveness of the adsorbent.
The adsorption data have been suggested to Langmuir and Freundlich [35]. All these models have been generally applied to express the experimental data of adsorption [36].
The Langmuir model form is given by:
| (2) |
The Freundlich model is given by:
| (3) |
kf and n are the Freundlich constants related to the adsorption capacity and intensity, respectively. All the parameter models are summarized in the Table 3.
Isotherms parameters models and separation factor RL of OTC adsorption onto ACT
| pH | Langmuir | Freundlich | |||||
|---|---|---|---|---|---|---|---|
| R2 | b (L⋅mg−1) | qm (mg⋅g−1) | RL | R2 | n | Kf (L⋅g−1) | |
| 2.0 | 0.9937 | 0.0625 | 181.82 | 0.1379 | 0.7850 | 0.0670 | 129.02 |
| 4.0 | 0.9980 | 0.2960 | 136.98 | 0.0326 | 0.9310 | 0.0546 | 98.73 |
| 5.6 | 0.9989 | 0.5600 | 126.58 | 0.0175 | 0.9544 | 0.0753 | 87.54 |
| 8.0 | 0.9984 | 0.9050 | 105.26 | 0.0109 | 0.8653 | 0.0562 | 84.22 |
| 10.0 | 0.9950 | 0.9380 | 78.13 | 0.0105 | 0.3312 | 0.0416 | 66.49 |
Furthermore, the essential characteristic of the Langmuir isotherm is described by a separation factor or dimensionless equilibrium parameter (RL) shown in Table 3 [44]:
| (4) |
It appears from the correlation coefficient (R2) that the Langmuir model adequately fits the experimental results over the investigated concentrations range. At natural initial pH (5.6), the maximum adsorption capacity of dried ACT was qm is 126.58 mg⋅g−1 indicating that this material is promising in treating OTC solutions (50–200 mg⋅L−1).
According to the RL values calculated for the initial OTC concentrations is 0.01 < RL < 0.13. Since the RL values are within the range of 0–1, it can be concluded that the adsorption of OTC onto ACT appears to be a favorable process.
The adsorption is nonlinear when the n value is less than 1. This result indicates that the heterogeneous surfaces of ACT are weakly bonded to the adsorbate by weak free energies, so adsorption is essentially dominated by adsorption rather than partitioning [45].
The adsorption kinetic is undertaken to understand the dynamics of the adsorption reaction in terms of the rate constant and to determine the possible rate-controlling step of the adsorption mechanism.
The adsorption kinetic data were evaluated by using general linearized forms kinetic models, and the goodness of fit was estimated by the regression coefficient (R2).
The pseudo-first-order and pseudo-second-order models are given, respectively by [46, 47]:
| (5) |
| (6) |
In these equations, qt and qe (mg⋅g−1), are the adsorption capacities at time t and equilibrium k1, k2 are the rate constant for pseudo-first-order and pseudo-second-order.
The intraparticle diffusion equation is expressed as Weber and Morris, 1963, [48]:
| (7) |
The Elovich kinetic model is described by [49, 50]:
| (8) |
The initial rates of adsorption reaction are calculated according to the pseudo-first-order and pseudo-second-order model by the following equations:
| (9) |
| (10) |
Parameters of different adsorption kinetics
| Concentration (mg⋅L−1) | 50 | 75 | 100 | 125 | 150 | 175 | 200 |
| qexp (mg⋅g−1) | 48.59 | 73.49 | 99.94 | 122.12 | 143.22 | 156.68 | 164.98 |
| Pseudo-first-order | |||||||
| qe (mg⋅g−1) | 0.1962 | 2.03 | 14.63 | 32.17 | 41.82 | 44.22 | 50.09 |
| K1 (g⋅mg−1⋅min−1) | 0.0109 | 0.0089 | 0.0201 | 0.0275 | 0.0297 | 0.0344 | 0.0337 |
| h1 (mg⋅g−1⋅min−1) | 0.0004 | 0.03 | 4.30 | 28.42 | 51.96 | 67.26 | 84.52 |
| R2 | 0.0125 | 0.2641 | 0.4462 | 0.7943 | 0.8448 | 0.8698 | 0.8839 |
| Pseudo-second-order | |||||||
| qe (mg⋅g−1) | 50 | 75.02 | 99.80 | 121.95 | 142.85 | 77.94 | 71.42 |
| K2 (g⋅mg−1⋅min−1) | 0 | 0.0505 | 0.0109 | 0.0047 | 0.0035 | 0.0274 | 0.0575 |
| h2 (mg⋅g−1⋅min−1) | 0 | 284.02 | 108.76 | 69.89 | 72.04 | 166.33 | 291.60 |
| R2 | 0.9999 | 0.9997 | 0.9995 | 0.9993 | 0.9990 | 0.9967 | 0.9994 |
| Intraparticle diffusion | |||||||
| Ki (mg⋅g−1⋅min−0.5) | 2.64 | 4.26 | 5.85 | 7.62 | 9.07 | 9.72 | 10.46 |
| C | 30.66 | 43.21 | 53.81 | 58.5247 | 67.19 | 76.77 | 78.37 |
| R2 | 0.2333 | 0.3041 | 0.3525 | 0.4524 | 0.4725 | 0.4376 | 0.4637 |
| Elovich | |||||||
| 𝛼 | 110.24 | 120.44 | 132.29 | 114.94 | 127.51 | 156.91 | 152.35 |
| b | 0.1255 | 0.0796 | 0.0594 | 0.0472 | 0.0399 | 0.0369 | 0.0348 |
| R2 | 0.4766 | 0.5579 | 0.6068 | 0.7013 | 0.7175 | 0.6849 | 0.7082 |
The obtained results show the model’s applicability on the dynamic adsorption of OTC onto ACT based on the regression coefficient and qm values. In the actual study, the kinetic data were well fitted by the pseudo-second-order kinetic model. The R2 values obtained from the pseudo-second-order kinetic model were higher; this indicates the excellent agreement of this model to describe all the experimental adsorption data of OTC onto ACT material. Kinetics of OTC adsorption onto ACT process, suggests that the adsorption rate-limiting step may be the chemisorption’s adsorption. The adsorption of OTC occurs probably via surface complexation reactions at specific sorption sites, highlighting the importance of the surface functional groups activated by our experimental condition. Also, it was perceived that the calculated (qe) values increased with an increase in the initial concentration of OTC.
In addition, the calculated qe (32.3 mg⋅g−1) value close to the experimental data (30.85 mg⋅g−1) indicated that the pseudo-second-order model than the pseudo-first-order one could approximate OTC adsorption onto activated carbon more favorably. Pseudo-second-order kinetic model suggests that the predominant process here is chemisorption. Similar data were also reported by other investigates [51, 52].
Based on the results presented in the table, the Elovich model did not fit perfect linear forms (0.47 < R2 < 0.70) for the adsorption of OTC onto activated carbon.
5. Temperature effect and thermodynamic parameters of OTC adsorption
Temperature is a crucial parameter in the adsorption process [53]. It has two significant effects, i.e., it enhances the diffusion rate of the adsorbate molecules through the outer boundary layer and into the adsorbent particles’ pores by decreasing the solution’s viscosity. Moreover, it improves the solubility of the adsorbate.
To adequately understand the temperature influence on the adsorption of OTC by ACT, experiments were carried out in a temperature range from 15 to 55 °C.
This choice of temperature is justified by the climatic conditions prevailing during winter and summer, in which the elimination is carried out on an industrial scale. This study can be investigated under the operating conditions: ACT dose: 1 g⋅L−1; contact time: 120 min; OTC initial concentration: 200 mg⋅L−1 and the free pH of the solution.
Figure 10 manifests the influence of temperature on the adsorption evolution of the OTC on the ACT. It can be noticed that the increase in temperature in the studied range promotes the OTC removal rate on ACT up to reaching equilibrium. This finding could be explained by higher energy input, which can break the associations between the OTC molecules and water. This phenomenon causes a decrease in the viscosity of the solution, resulting in a rise in the motion and diffusion rate of the OTC molecules in the film surrounding the ACT grain. At the same time as the pores amount expand and improve the diffusion in the pores.
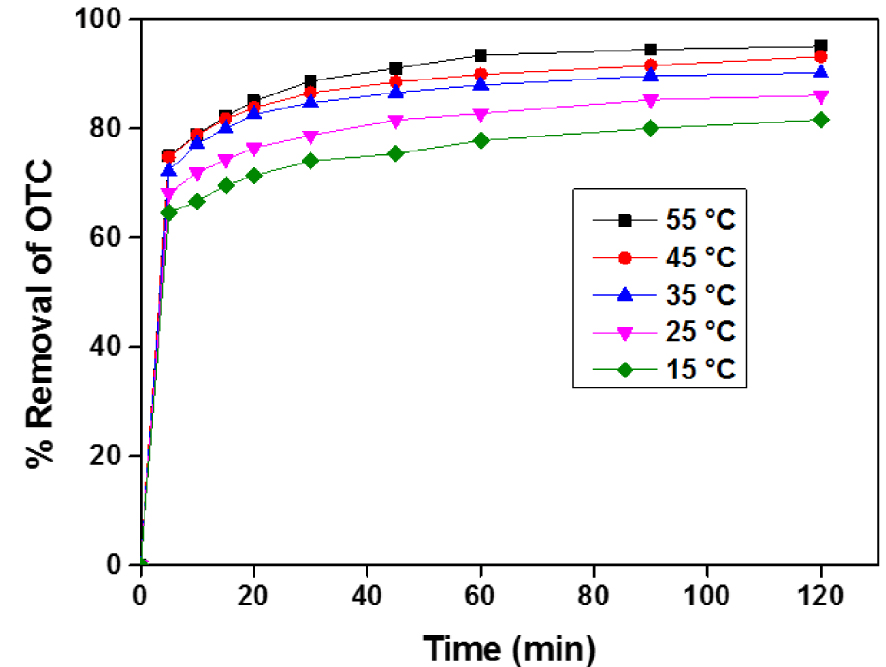
Temperature effect on Adsorption of OTC onto ACT, pH = 5.5, dose ACT = 1 g⋅L−1, [OTC] = 200 g⋅L−1.
In other words, the increase in energy in the process can reduce the restrictions in film diffusion and pore diffusion. In addition, the OTC molecules acquire more energy to establish stronger interactions with the active sites of the ACT. Several authors in the literature have reported this positive effect of temperature on adsorption [8].
The enthalpy (
| (11) |
| (12) |
| (13) |
| (14) |
Based on the results of Table 4, the negative value of
Thermodynamic parameters of OTC removal onto ACT
| 𝛥H (J⋅mol−1) | 𝛥S (J⋅mol−1⋅K−1) | 𝛥G (kJ⋅mol−1) | ||||
|---|---|---|---|---|---|---|
| 288 K | 298 K | 308 K | 318 K | 328 K | ||
| 15.5469 | 72.31 | −20.81 | −21.53 | −22.25 | −22.97 | −23.70 |
It was observed that with increasing temperature,
6. Computational studies
In this work, the configurations of OTC in water and vacuum media were optimized using DFT calculation and the corresponding FMO (Frontier Molecular Orbitals), resulting in HOMO (Highest Occupied Molecular Orbital) and LUMO (Lowest Unoccupied Molecular Orbital) are shown in Figure 11. The MEP (Molecular Electrostatic Potential) was computed to discuss the electrophile and nucleophile character position of OTC [56], illustrated by blue and red area, respectively (Figure 11).
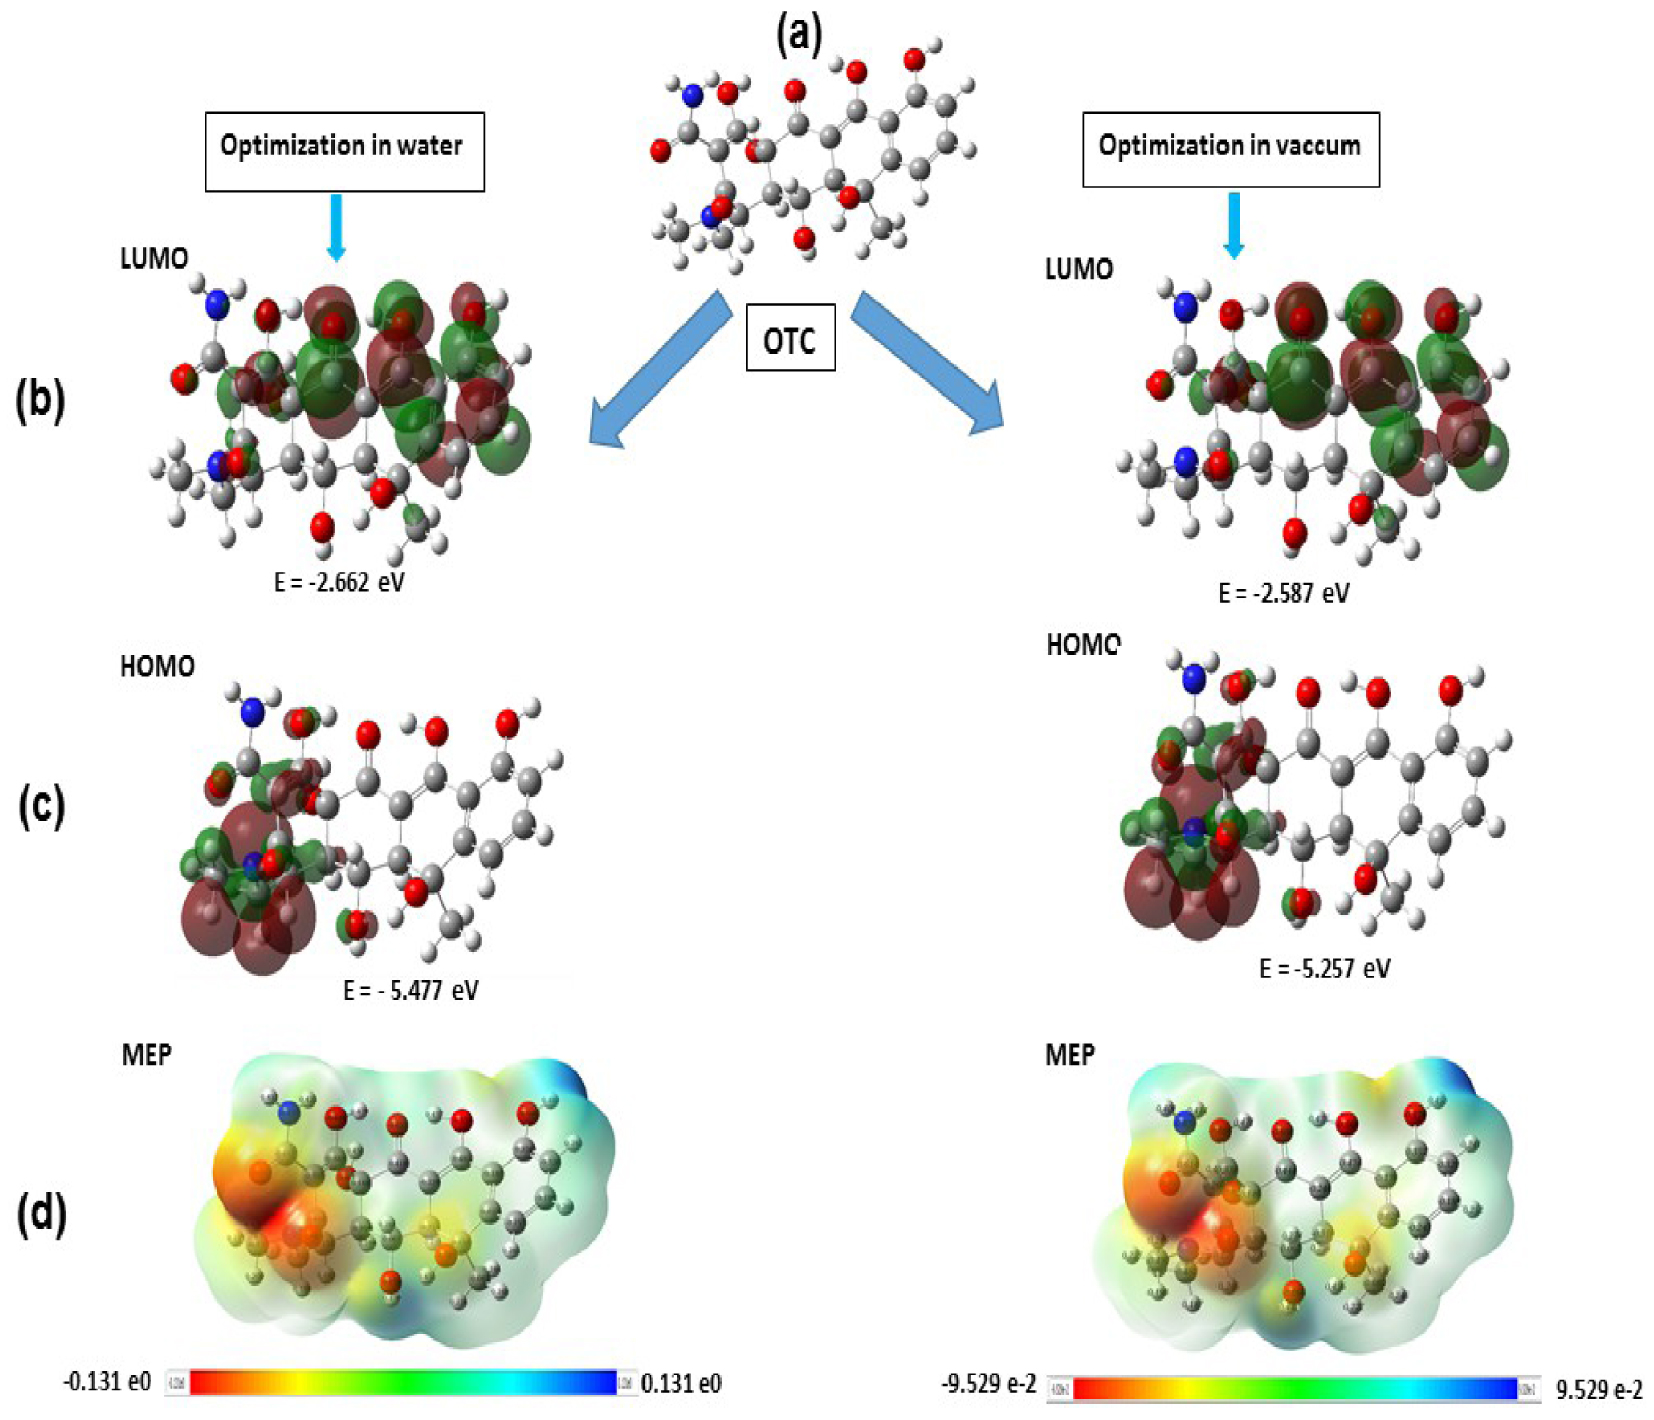
DFT-optimized configurations, FMOs (HOMO and LUMO) and MEP plots of OTC adsorption onto Cellulose and Cellulose-H2PO3 system.
The HOMO is located mainly on C=O N–C and C–OH groups. At the same time, the LUMO is situated on the C=C of the aromatic ring C–OH and a weak part on C=O, indicating that these molecular moieties are from active sites for adsorption [57]. Additionally, the MEP predicts a dominant electrophilic character of OTC except around the oxygen, in which strong negative potential was observed. This high polarity of OTC-molecule favors the intermolecular electrostatic and/or weak dipolar interactions [58].
Furthermore, an attempt has been realized to acquire in-depth erudition on the adsorption mechanism of OTC onto ACT. Two models of substrate surface were proposed, cellulose and cellulose-H2PO3, having the area of 16.40 × 20.76 Å2 (Figure 11). The choice of the two surface models illustrates the adsorption on the raw biomass (Artichoke) before and after acid treatment (ACT). Figure 11 shows that the OCT molecule adsorbed longitudinally on both surfaces. The aromatic cycle is almost in a parallel configuration, indicating that π-electronsare strongly involved in the adsorption mechanism. Besides, the oxygen atoms of OTC are tilted toward the substrates, with distances close to covalent bonds, suggesting that these last may occur. Additionally, the adsorption energy values are given in Table 6. The adsorption energy was found to be −562.92 kJ⋅mol−1 and −116.84 kJ⋅mol−1 for cellulose and cellulose-H2PO3, respectively. These high energy values confirm again that OTC molecules are strongly adsorbed, maybe through the chemisorptive process, and their negative values indicate the spontaneity of the process. Therefore, the relative stability and adsorption energy for the two surfaces follow the order:
Adsorption values using different substrates (cellulose, cellulose-
| Structure | Total energy (kJ/mol) | Adsorption energy (kJ/mol) | Rigid adsorption energy (kJ/mol) | Deformation energy (kJ/mol) | Oxytetracycline: dEad/dNi |
|---|---|---|---|---|---|
| Cellulose (2 × 2) (100) | 74.45 | −562.96 | −31.59 | −531.36 | −562.96 |
| Cellulose H2PO3 (2 × 2) (100) | 72.60 | −116.84 | −34.65 | −82.18 | −116.84 |
Furthermore, the charges distribution of molecules was illustrated by the electrostatic potential maps, and the MEP maps of OTC-cellulose, and OTC-cellulose H2PO3 were calculated using the DFT method. From Figure 11, the MEP negative regions mentioned by red and yellow colors were located on the oxygen and nitrogen, indicating that these sites are the most appropriate for electrophilic attacks. Otherwise, electron transfer increases the adsorption and favors the intermolecular electrostatic interactions [58].
7. Comparison of the adsorption of OTC on various adsorbents
To evaluate the removal efficiency, a comparison of maximum adsorption capacity obtained from the Langmuir model of the prepared ACT with investigations findings towards the OTC drug removal at the optimum operating conditions is given in Table 7.
Comparison of the OTC maximum adsorption capacity obtained from Langmuir isotherm at optimal operating conditions on various adsorbents
| No | Materials | qm (mg/g) | References |
|---|---|---|---|
| 1 | The residue of Flueggea suffruticosa | 129.9 | [59] |
| 2 | Corn stalk | 88.5 | [60] |
| 3 | Aerobic granular sludge | 91.74 | [15] |
| 4 | Surfactants modified sepiolite | 39.18 | [61] |
| 5 | Sediment | 81.8869 | [62] |
| 6 | Forest | 263.8 | [63] |
| 7 | Wood | 254.1 | [63] |
| 8 | ACT | 126.58 | This work |
The obtained results revealed that ACT exhibits a great extent of adsorption performance compared to other adsorbents materials reported in the literature for the same contaminant. Moreover, this comparative study indicated that ACT could be a promising and satisfactory adsorbent for pharmaceuticals and dyes removal.
8. Conclusion
An undeniable and low-cost activated carbon produced from agriculture by-products, using the chemical activation, has been identified as an effective adsorbent for OTC removal from wastewater. Phosphoric acid was used to promote bond cleavage reactions and the formation of crosslinks through different mechanisms such as cyclization and condensation and its combination with organic species to form phosphate and polyphosphate bridges that bond and crosslink fragments. These fragments were employed to remove OTC molecules as a pharmaceutical pollutant from an aqueous solution and achieve the status of green environmental policy. The techniques characterization of activated carbon the SEM image clearly showed a heterogeneous surface morphology of ACT signifying the presence of pores and appreciate surface area obtained after carbonization processes with H3PO4 acid treatment. The FTIR spectroscopy revealed the presence of different peaks corresponding to the functional groups formed after activation by reducing the hydroxyl group and creating a carboxylic function. XFR analysis indicates that the C, O, and P are the most elements composition. The XRD analysis confirmed that the ACT displayed a crystallinity structure characterized by an amorphous nature. The large surface area and the developed porous material structure after the activation process proved by BET analysis reveal that the adsorbent is a typical mesoporous material.
As the results of the experimental studies revealed, a minimum contact time for the adsorption equilibrium was less than 2 h, and for a fixed amount of adsorbent 1 g⋅L1−, an increase in the initial concentration of the solution reduces the contact time required to reach equilibrium. In addition, the OTC adsorption increases with an increase in the temperature, thereby suggesting the process to be endothermic.
The description of adsorption behavior by DFT calculations showed superior ability and a good agreement between experimental and theoretical investigation due to the different interaction energies of adsorbent functional groups (C=O, –OH, C-POx) OTC molecules.
Finally, this study demonstrates the outstanding adsorption efficiency of ACT materials to OTC drugs from an aqueous solution, and it has provided feasible, economical, and valuable practical water treatment applications.
Conflicts of interest
Authors have no conflict of interest to declare.
Acknowledgments
This work was supported by the King Khalid University, Abha, Saudi Arabia (by grant G.R.P./206/42). We express our gratitude to the Deanship of Scientific Research, King Khalid University, for its support of this study. The authors are thankful to DGRSDT for helping through the analysis of the emerging pollutants project, research center CRAPC, for providing instrumental facilities for characterization materials in carrying out this work.
Vous devez vous connecter pour continuer.
S'authentifier