


 CC-BY 4.0
1. Introduction
Drinking water is indispensable to human health and safe water must always be accessible in order to provide health benefits. According to the world health organization (WHO), 2.1 billion people only have access to unsafe drinking water [1]. The consumption of unsafe drinking water, in particular unsafe fluoride drinking water, may have serious consequences. Fluoride is an element that can help prevent tooth decay when present in drinking water within the safety limits, between 0.5–1.5 mg⋅L−1 as per WHO recommendations [2]. However, in excess of 1.5 mg⋅L−1, different types of fluorosis can occur, dental ( >1.5 mg⋅L−1) and/or skeletal (⩾3 mg⋅L−1), depending on the contamination level [2]. Also, damages to reproductive, nervous, immune systems and more can be related to an excess of fluoride intake [3].
Fluoride concentrates naturally into the hydrosphere via several sources, i.e., volcanism and fluoride-rich rocks, chiefly phosphate rock or fluoroapatite [Ca10(PO4)6F2], but also via wastes of different anthropological processes, i.e., phosphate, aluminum and ceramic factories [4, 5]. Many countries around the world are confronted with high fluoride concentrations in some of their drinking water resources, namely: Canada, China, India, Tunisia and so forth [6, 7]. Unfortunately, more than 260 million humans globally suffer from fluorosis (dental and/or skeletal) [4]. To date, 25% of the Tunisian population is at risk for dental fluorosis and 20% may develop skeletal fluorosis [6].
Reducing fluoride concentrations in the water is challenging [4]. Different water treatment processes have been tested, namely: coagulation/precipitation, ion exchange, adsorption, electrochemical and membrane processes [7]. Adsorption may be the most promising approach because of the high availability of adsorbents (natural and synthetic), the simplicity of the operational design and its reasonable cost [7]. Different materials have been tested as fluoride adsorbent, i.e., silica nano modified from rice husk [8], montmorillonite-clay [9], poly o-toluidine modified lanthanum phosphate [10], bone char derived from bone residue [11] and aluminum-modified activated carbon from dates stems [12], etc.
Natural clay is the fluoride adsorbent used in the present work. It is abundant in nature, environment-friendly and low-cost [13]. Different clays as well as their modified composites have been tested as fluoride adsorbent, i.e., bentonite [14], kaolinite [14], montmorillonite [15], pyrophilite [16, 17], acidified montmorillonite [18], acid activated kaolinite [19], La-modified bentonite [20], Mg-modified bentonite [21], La (III)-loaded bentonite/chitosan beads [22], MnO2 coated Na-bentonite [23], decyltrimethylammonium bromide/H2O2 solution-treated organic matter-rich clay [24], Al3+-modified bentonite [25], synthetic nelphine-hydrate from natural kaolinite [26], heated kaolinite [5] and thermally activated sepiolite [27], etc. Most of these studies were conducted using synthetic fluoride containing water and were not tested with actual fluoride contaminated drinking water. Modification of the clay, generally by adding chemical products, can enhance dramatically the defluoridation efficiency. But it can result in different limitations such as eliminating the economic value of the material and causing extra water quality problems by content release and/or by high variation in the pH of the water. For example, in the case of MnO2 coated Na-Bentonite where Mn concentration in drinking water increased from 0.02 to 1.66 mg⋅L−1 while the safety limit recommended by WHO is 0.05 mg⋅L−1 [23]. Likewise, in the case of the fluoride/thermally activated sepiolite system where the treated simulated water became alkaline (up to a pH of 12) [27] or in the case of Al3+-modified bentonite where the pH of the treated drinking water became acidic (pH decreasing from 8.8 to 4.5) [25]. Such limitations may render the adsorbent inapplicable. In summary, the ability of the clay to remove only small amounts of fluoride in drinking water, the operating water pH and the adsorption mechanism have been highlighted as issues that require more investigations [28].
The objective of the present study was to achieve a reduction in the fluoride concentration in a Tunisian contaminated drinking water using natural clay, after mild treatment, that could be used at a larger scale. The clay was characterized by X-ray diffraction (XRD), thermal analyses (ATD-TG) and Nuclear Magnetic Resonance solid-state with Magic Angle Spinning (MAS NMR). Fluoride adsorption experiments were performed under conditions representative of those observed in the field. Kinetics and adsorption equilibrium isotherms were determined; and an adsorption experiment on the drinking water sample was also performed to investigate the adsorbent performance.
2. Materials and methods
2.1. Clay treatment
The natural clay used in this study is from the Jebel Aïdoudi that is located in the southeast of Tunisia near Gabes town. First, the clay was dried at 60 °C for approximately one week to remove moisture and was then ground using an automatic agate grinder for 20 min and sieved at 100 μm. The raw material obtained was referred to as raw clay (RC).
Washing natural clay is indispensable before its use in order to remove the non-clay impurities. In this study, the washing procedure was performed without the addition of any chemical products. First, 100 g of RC was agitated gently with 500 mL of demineralized water for 2 h. The suspension was then submitted to fractionation by sedimentation for 4 days. After 4 days, the supernatant water was removed and two layers were observed in the sediment. The top layer was collected and centrifuged at 6000 rpm for about 30 min. After centrifugation, the supernatant was discarded and the pellet was resuspended in demineralized water in order to remove the insoluble non-clay impurities. This washing step consisted of shaking for 30 min the suspension with demineralized water followed by centrifugation. The supernatant was removed after centrifugation while the fine particles in the pellet were collected and transferred to another flask. Any visible impurities sinking to the bottom were removed with a spatula. This step was repeated until the suspension became difficult to centrifuge (typically 5–6 cycles). After that, the particles collected were submitted again to fractionation by sedimentation for about 2 days to ensure the existence of only a clay fraction. Finally, the suspension was dried at 60 °C, ground and sieved at 75 μm in order to obtain homogeneous dry particle size. The material obtained was referred to as dealuminated washed clay (DWC). In order to prevent the aggregation of the clay particles in the water within the adsorption process, DWC was heated at 500 °C for 4 h using a muffle furnace with a heating rate of 12.5 °C⋅min−1. The material obtained was referred to as dealuminated washed heated clay (DWHC) and used as a fluoride adsorbent in this study.
2.2. Clay characterization
The mineralogical structures of the clay were identified by X-ray powder diffraction (XRD) using a Bruker D8 advance diffractometer with Cu Kα radiation (𝜆 = 1.54 Å). The thermal behavior of the clay was investigated by the thermo-gravimetric and the differential thermal analyses (DTA-TG) using Labsys TG instrument at a heating rate of 5 °C⋅min−1 under argon atmosphere. The behavior of the clay before and after fluoride adsorption was studied by solid-state nuclear magnetic resonance with magic angle spinning (MAS NMR) using Bruker Avance III 500 MHz spectrometer. 29Si and 27Al MAS NMR were performed for all clays: RC, DWC, DWHC and the clay after adsorption (DWHCA). 19F MAS NMR was performed for DWHC and DWHCA samples as well as on a NaF salt as reference material in order to obtain the fluoride chemical shift. 29Si spectra were recorded at the resonance frequency (𝜈) of 99.38 MHz and spinning rate of 8 kHz. 27Al spectra were obtained at 𝜈 = 130.34 MHz and 14 kHz of rotation speed. 19F spectra were obtained at 𝜈 = 470.67 MHz and spinning rate of 14 kHz.
2.3. Preparation, analysis and F speciation of water samples
All adsorption experiments were carried out using freshly prepared fluoride synthetic solutions. Once the influence of the tested variables was determined, an experiment was performed using a field water sample.
Synthetic fluoride solutions were prepared by dissolving an appropriate amount of sodium fluoride (Fisher) in demineralized water. To investigate the effect of fluoride concentration on the adsorption process, different desired concentrations were prepared by successive dilution from a stock solution. All fluoride concentrations in the synthetic solutions were analyzed using an Integrion HPIC ion chromatograph (IC).
The field water (drinking water) was sampled in April 2019 from an urban zone situated in the southwest of Tunisia in the region of the Gafsa phosphate mining basin, more precisely in the Metlaoui delegation. Fluoride (F−), chloride (Cl−), nitrate (), sulfate () and phosphate () concentrations were determined by ion chromatography. Calcium (Ca2+), magnesium (Mg2+), sodium (Na+) and potassium (K+) concentrations were obtained using an Agilent 5110 dual view inductively coupled plasma-atomic emission spectroscopy (ICP-AES). A Fisher Scientific accumet AB150 pH-meter was used for pH measurement. Aqueous fluoride speciation was estimated by thermodynamic calculations using the MINEQL+ software (version 5.0). Nuclear magnetic resonance spectrometer (NMR) was also used in order to determine fluoride species. The field water sample was evaporated with nitrogen for 12 h in order to concentrate and obtain 19F NMR shift of F− ions. The 19F spectrum was recorded at 470.66 MHz, 102 400 scans and using BBFO liquid probe. A concentrated fluoride synthetic solution was used as a reference.
2.4. Adsorption experiments
The experimental procedure consisted of shaking at 280 rpm for a fixed time the desired amount of adsorbent (DWHC) with a fluoride containing solution into a closed Nalgene flask. After shaking, the suspension was centrifuged at 6000 rpm for about 30 min and the final fluoride concentration in the supernatant was analyzed.
First, adsorption was investigated on the basis of actual field conditions, i.e., initial F− solution with concentration close to field water sample (2.44 ± 0.10 mg⋅L−1), without any adjustment of pH (5.5) and at room temperature of 20 ± 2 °C. Between 0.5 and 2 g of adsorbent was used for a sample volume of 50 mL. Likewise, the kinetics of adsorption was examined over the range of 1–120 min. Second, the effect of F− concentration and the equilibrium isotherm data were determined by varying initial F− concentration over the range of 2.51–192 mg⋅L−1. Finally, an experiment with the field water sample was carried out. For this final test, 1 g of adsorbent (DWHC) was added to 50 mL of fluoride contaminated drinking water and the mixture was shaken for 10 min.
The amounts of F− adsorbed per unit weight of adsorbent at equilibrium, qe (mg⋅g−1), and the percentage of the F− removal from the water, F (%), were calculated according to (1) and (2), respectively:
| (1) |
| (2) |
2.5. Adsorption empirical models
2.5.1. Adsorption kinetics
Three adsorption kinetics models were examined to fit experimental data, namely: pseudo-first-order of Lagergren (3) [29], pseudo-second-order (4) [29] and intra-particle diffusion (5) models [30].
| (3) |
| (4) |
| (5) |
2.5.2. Adsorption equilibrium isotherm at 20 ± 2 °C
Experimental data were modeled according to the widely used equilibrium isotherm models for the F−/clay system, Langmuir (6) [31] and Freundlich (8) [32] models.
| (6) |
The dimensionless equilibrium factor of the Langmuir model (RL) which is given in (7) was examined to predict the efficiency of the adsorption process [16].
| (7) |
| (8) |
2.5.3. Model fittings
Higher regression coefficient (R2) and smaller sum of square error (SSE) (9) were considered to identify the best fitted models [27].
| (9) |
3. Results and discussion
3.1. Clay characterization
3.1.1. X-ray diffraction
The clay fraction is an interstratified smectite/illite with a small proportion of kaolinite [33]. The smectite which is the dominating fraction is naturally sodic with a dioctahedral character [33]. The XRD patterns (Figure 1) reveal that gypsum (7.59 Å) [34] and quartz (3.34 Å) [35] are the principal impurities in the raw clay (RC pattern). After washing, the peaks of gypsum and quartz disappeared (DWC pattern). The d001 of smectite expands from 12.14 to 15.33 Å. This is probably due to the partial dealumination of the smectite (migration of aluminum from the tetrahedral sheet to the interlayer space) following the washing process of the clay. The tetrahedral aluminum is known to behave as a Lewis acid in the clay [36]. Then, the aluminum migrated from the tetrahedral site to the interlayer space probably by attraction of the excess of water molecules which acted as Lewis base. After heating, the d001 of smectite collapses from 15.33 to 10.15 Å (DWHC pattern). This is due to the loss of the interlayer water. After adsorption, the d001 of smectite increases from 10.15 to 14.07 Å. This expansion in d001 has not reached the d001 observed after washing and before heating (15.33 Å). This is probably due to the partial dehydroxylation of the clay. Then, the increase of the d001 after adsorption is probably due to the rehydration of the non-dehydroxylated part of the clay. This suggests that the adsorbed fluoride has not reacted with the Al that is present in the interlayer space.
X-ray diffraction (XRD) patterns for the raw clay (RC), dealuminated washed clay (DWC), dealuminated washed heated clay (DWHC) and dealuminated washed heated clay after fluoride adsorption.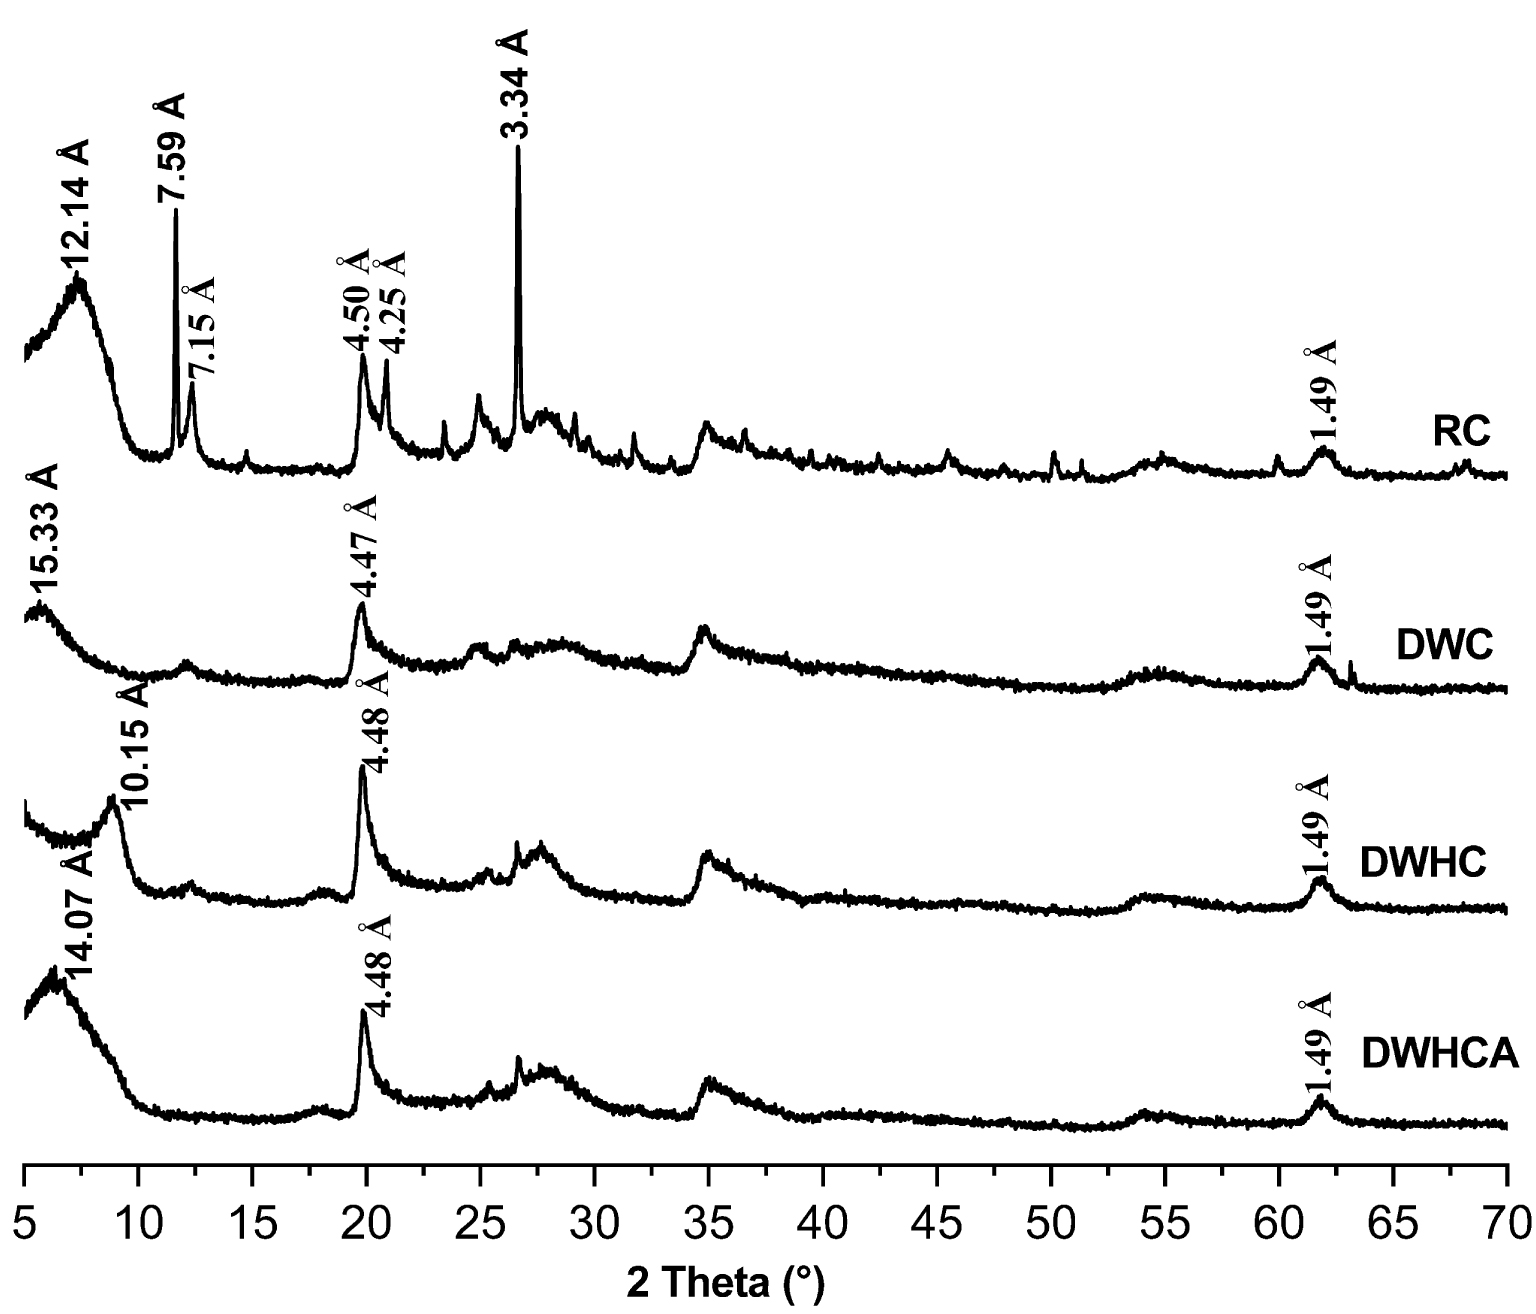
3.1.2. Thermal analyses
Figures 2–4 show the DTA-TG thermal analysis of the DWC, DWHC and DWHCA samples, respectively. The DTA curve of the DWC sample (Figure 2) displays different peaks with an endothermic character. Three peaks appear at a temperature below 200 °C which reflected the loss of hydration water molecules on heating [37]. In this temperature region, the corresponding TG curve shows a weight loss of 12.66%. A peak at 273.24 °C accompanied by a weight loss of 1.14% that appears because of the decomposition of organic impurities at this temperature [38]. A weak peak at 357.26 °C accompanied by a weight loss of 0.48% probably reflects the beginning of the destruction of the kaolinite. A significant peak at 503.51 °C appeared which can be related to the dehydroxylation of the clay [37]. This peak gives a weight loss of 4.44%.
Thermo-gravimetric and differential thermal analyses (DTA-TG) for the dealuminated washed clay (DWC); exo: exothermic, endo: endothermic.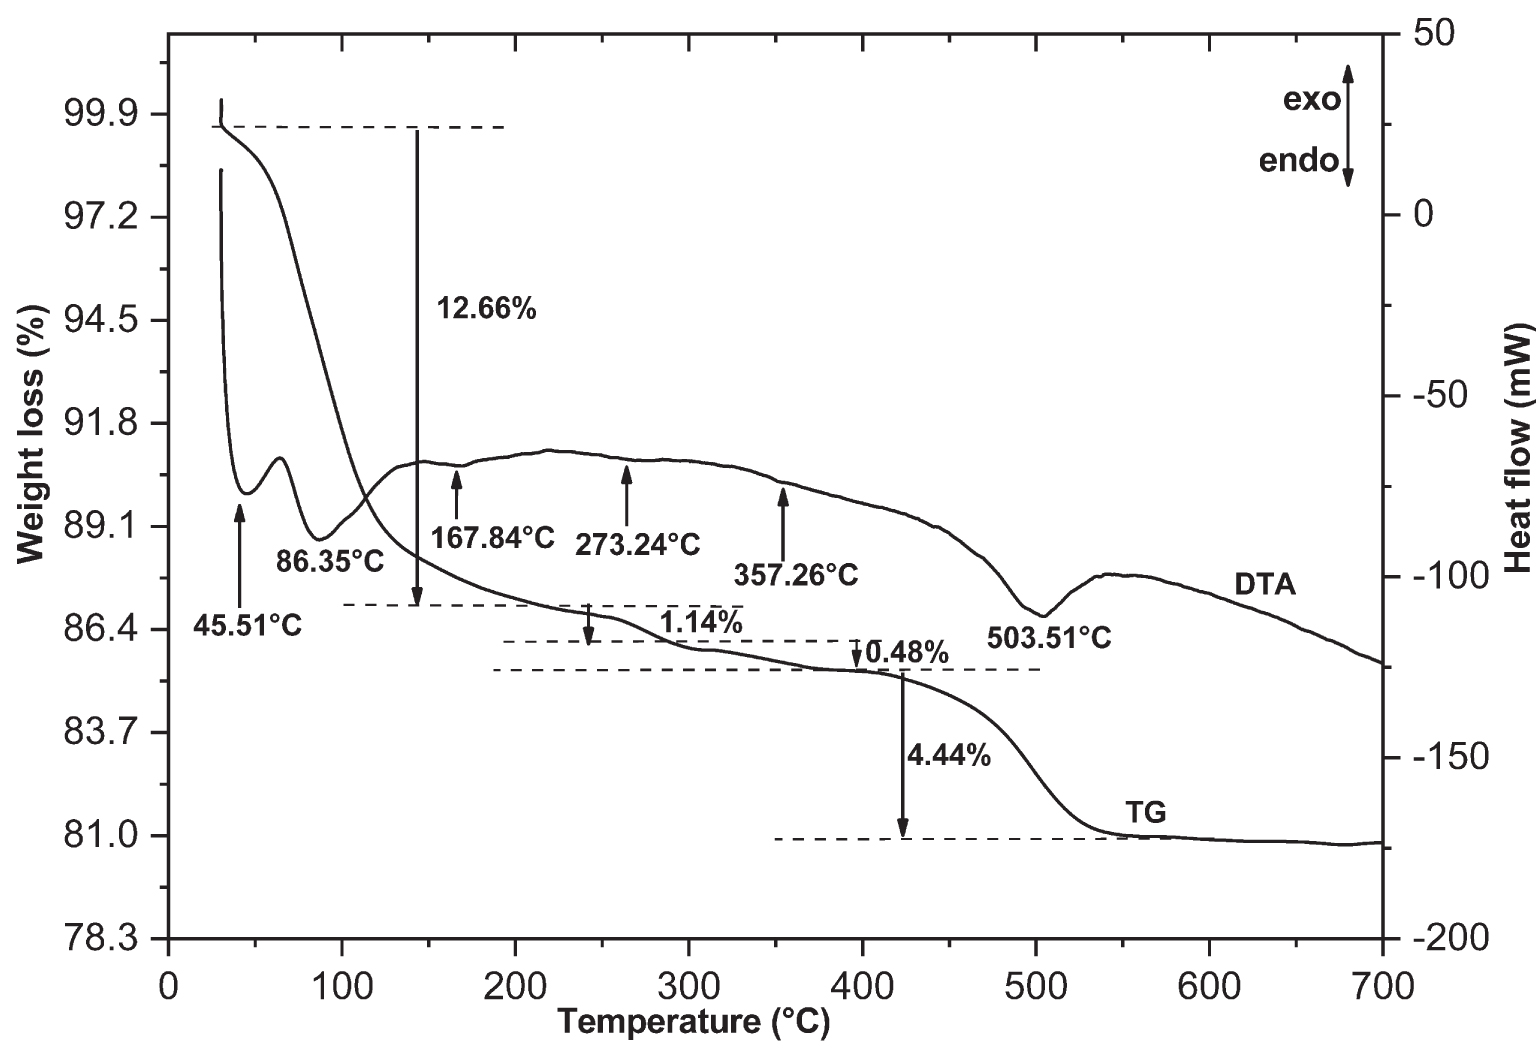
The DTA curve of the DWHC sample (Figure 3) shows three endothermic peaks related to water molecules (temperature < 200 °C) accompanied by a weight loss of 8.33%. This indicates the partial dehydration of the clay following the heat treatment. When comparing the ATD curve of DWC with that of the DWHC, the peak at 273.24 °C corresponds to the organic matter disappearance. This indicates the complete decomposition of organic matter from the DWHC sample. Two low peaks are visible at 247.00 °C and 407.63 °C with a weight loss of 1.68% and 1.80%, respectively which reflect most likely the partial destruction of the kaolinite. The presence of a peak at 503.51 °C indicates the partial dehydroxylation of the clay and resulted in a weight loss of 4.08%.
Thermo-gravimetric and differential thermal analyses (DTA-TG) for the dealuminated washed heated clay (DWHC); exo: exothermic, endo: endothermic.
Thermo-gravimetric and differential thermal analyses (DTA-TG) for the dealuminated washed heated clay after fluoride adsorption (DWHCA); exo: exothermic, endo: endothermic.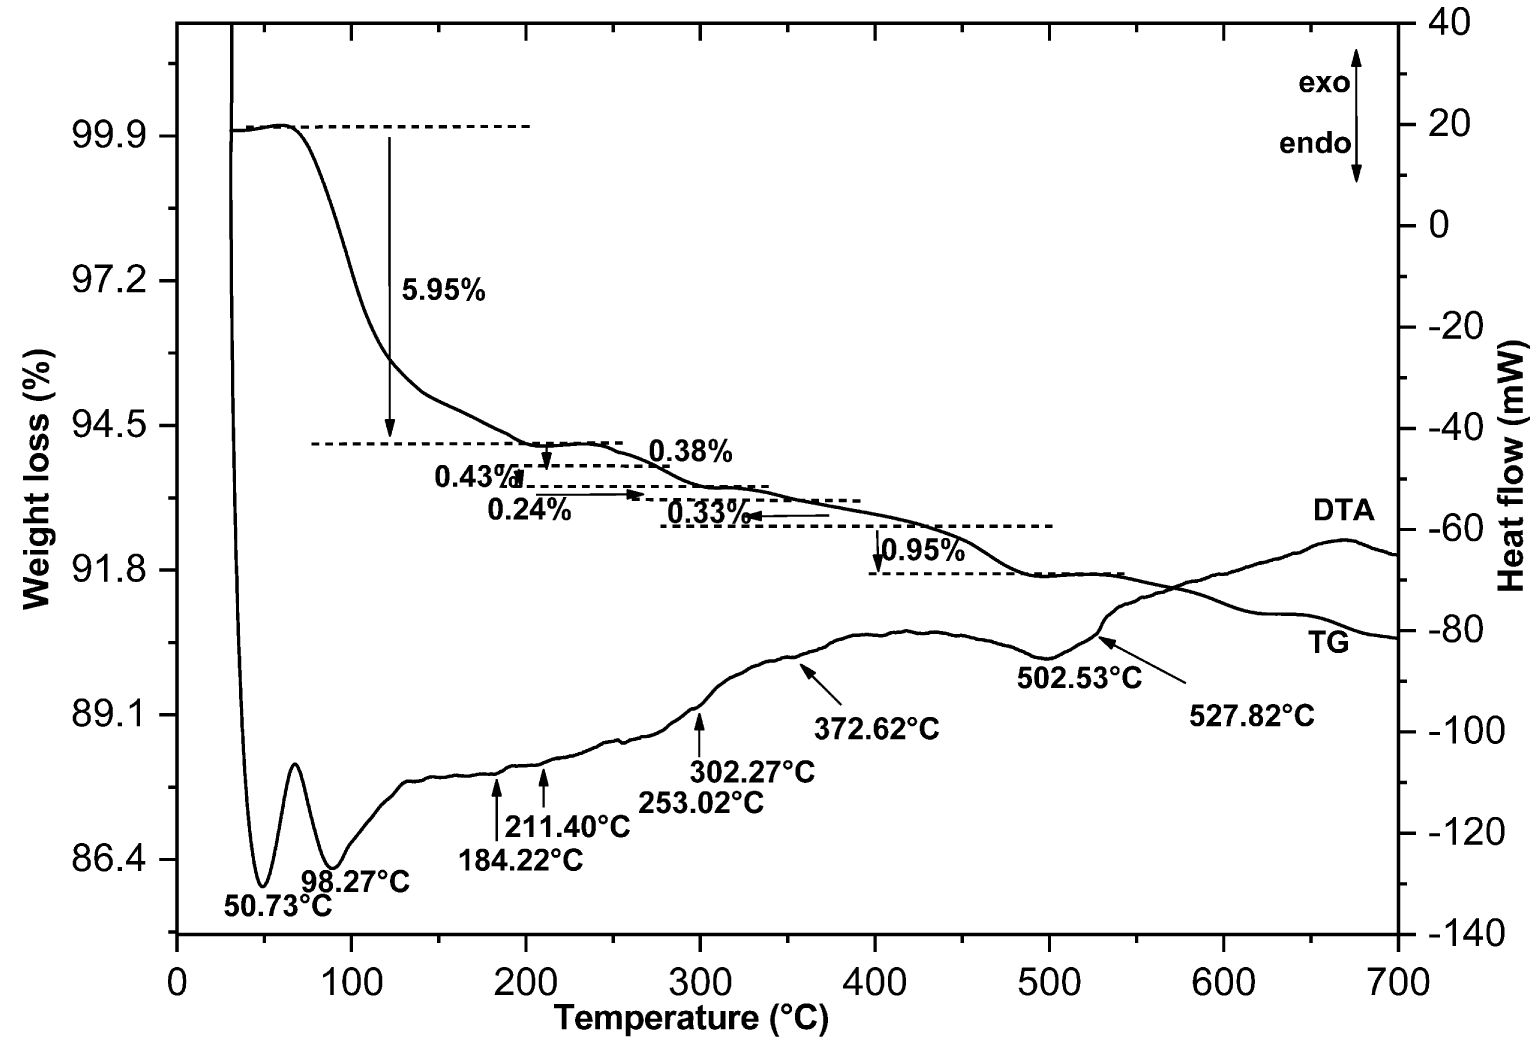
According to the TG data, the degrees of dehydration and the dehydroxylation of the clay, DTG (%), are estimated of 36.4% and 11.5%, respectively as calculated by (10):
| (10) |
where 𝛥wDWC and 𝛥wDWHC (g) are the weight loss of DWC and DWHC samples, respectively, after dehydration or dehydroxylation.
Figure 4 illustrates the DTA-TG curves of the clay after fluoride adsorption (DWHCA). Different new endothermic peaks were observed. The most interesting peak is the shoulder observed at 527.82 °C which reveals that the fluoride was probably adsorbed on octahedral sites. Additional explanations cannot be provided using ATD-TG analysis. For that purpose, a detailed study using MAS NMR spectroscopy was done.
3.1.3. Identification of the fluoride adsorption clay sites by MAS NMR spectrometer
Solid-state MAS NMR spectroscopy is an effective technique to obtain information about the structure of different solids, including aluminosilicates, at a molecular level and the local coordination of atoms [39]. We studied 29Si, 27Al and 19F MAS NMR spectroscopy in order to identify the clay sites on which the F− adsorption occurred. In the literature, F− adsorption on clay is very poorly investigated by MAS NMR spectrometer.
29Si nuclear magnetic resonance with magic angle spinning (MAS NMR) spectra for the raw clay (RC), dealuminated washed clay (DWC), dealuminated washed heated clay (DWHC) and dealuminated washed heated clay after fluoride adsorption (DWHCA).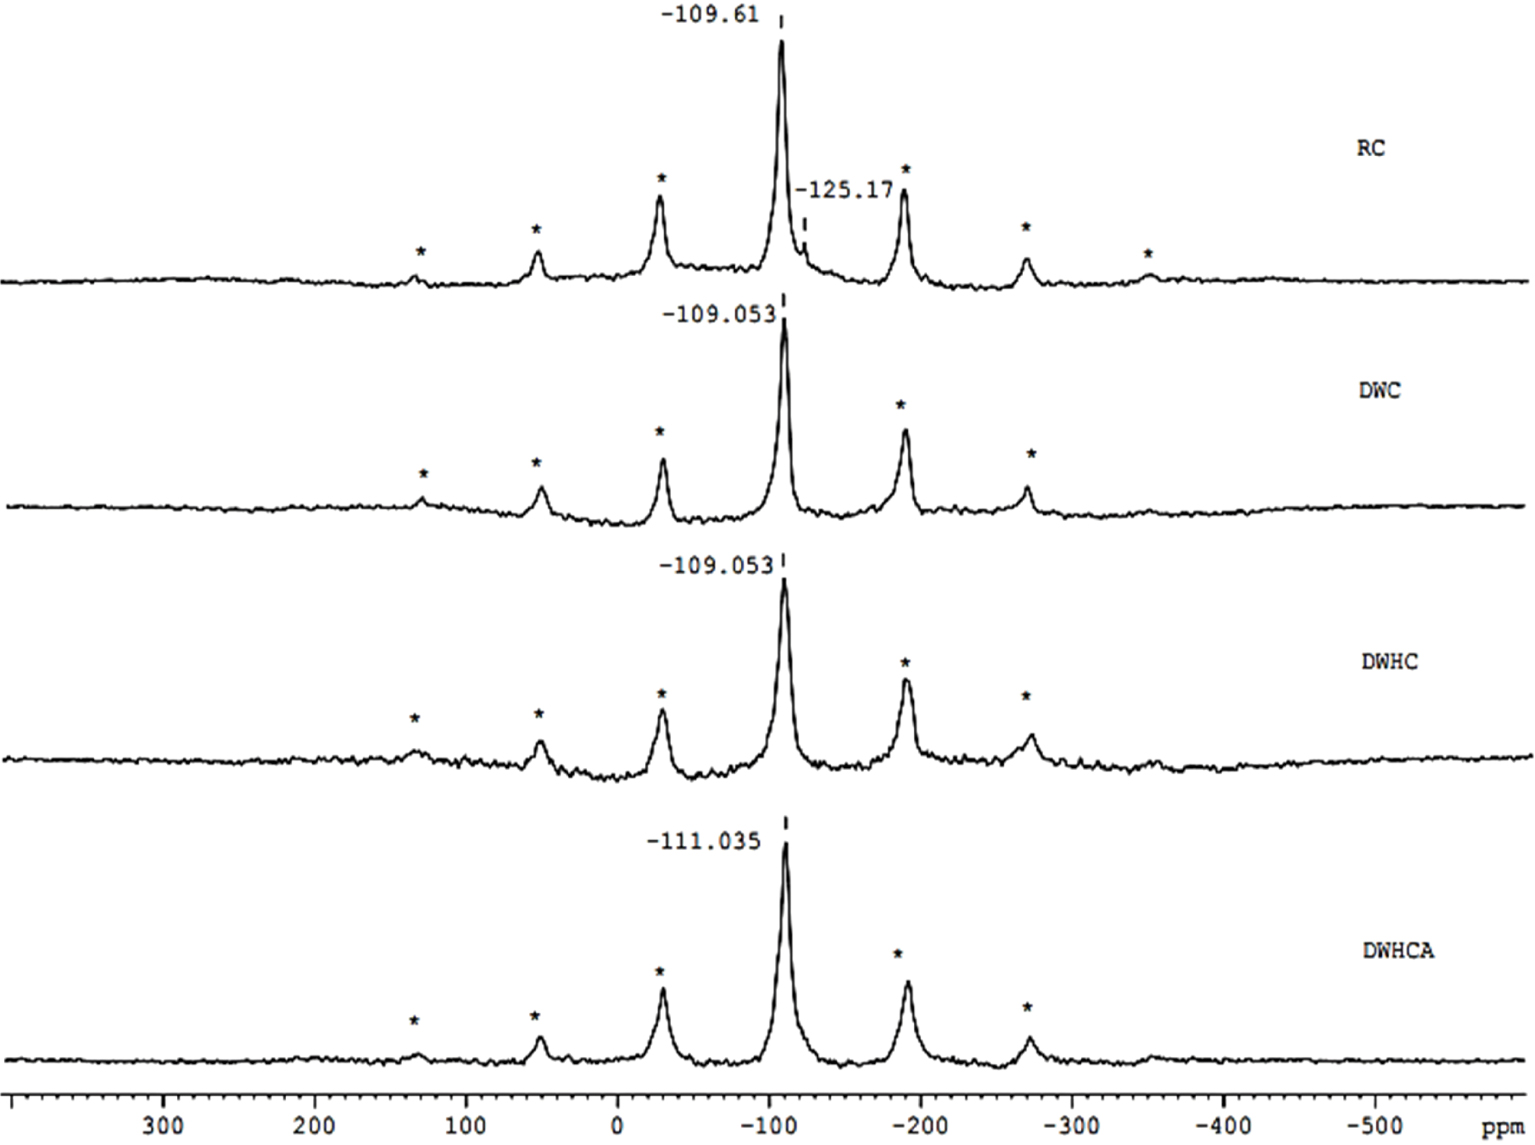
27Al nuclear magnetic resonance with magic angle spinning (MAS NMR) spectra for the raw clay (RC), dealuminated washed clay (DWC), dealuminated washed heated clay (DWHC) and dealuminated washed heated clay after fluoride adsorption (DWHCA).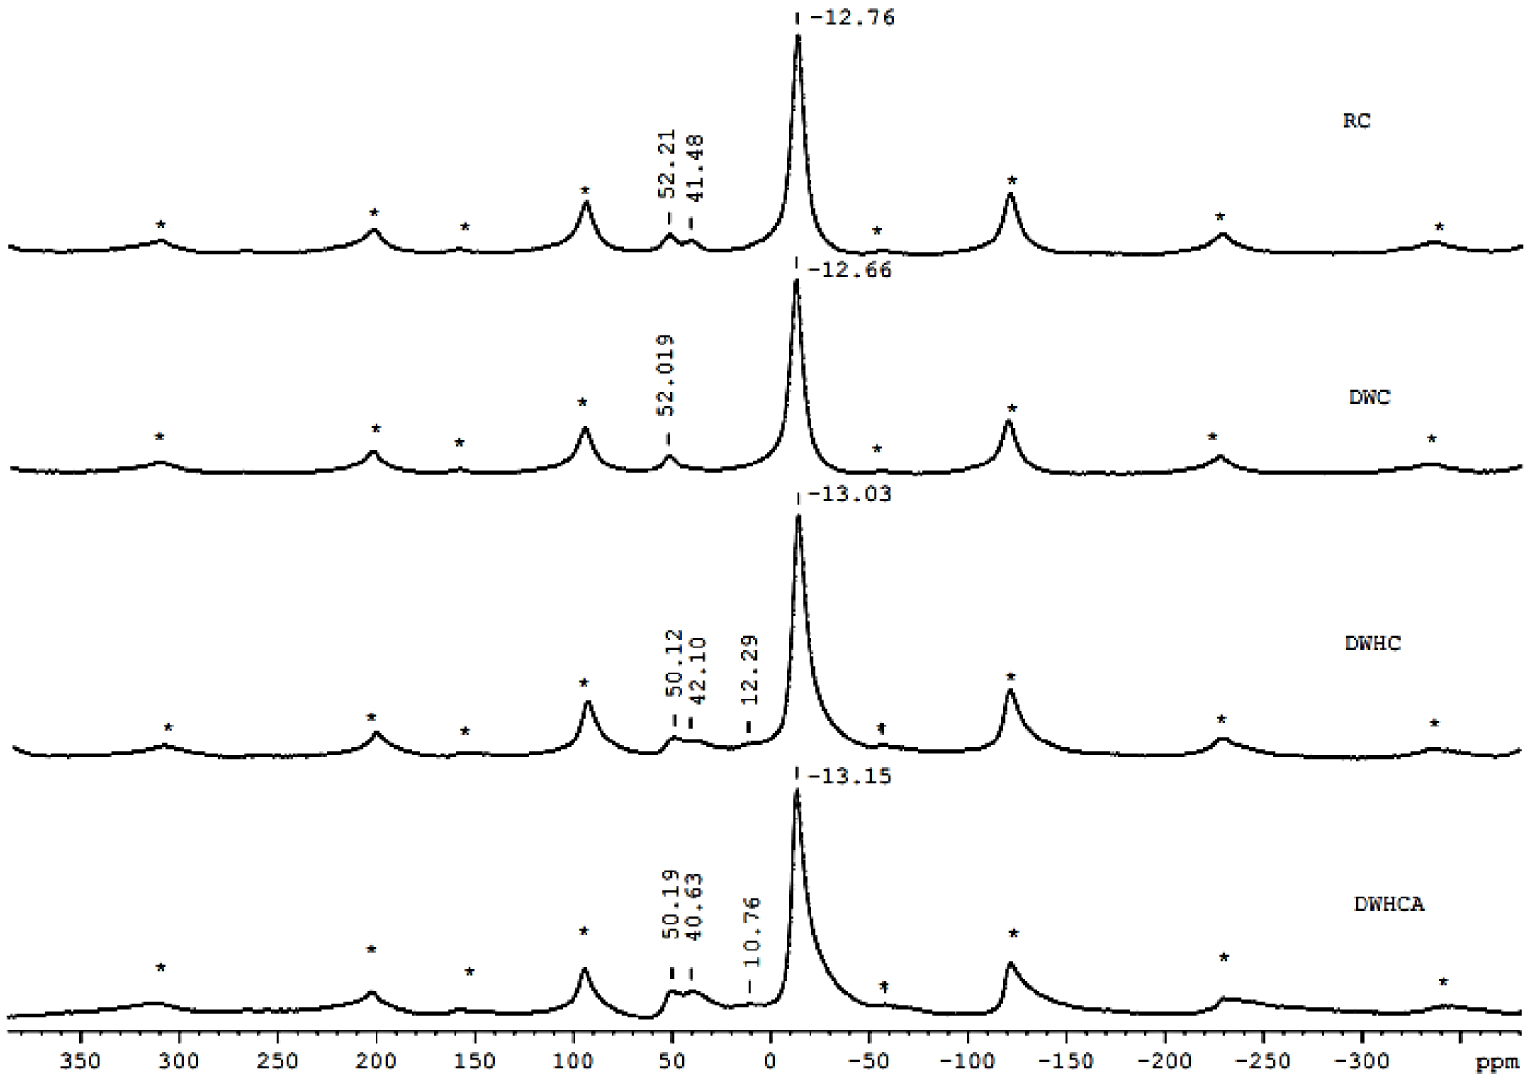
29Si spectra of the clay samples are shown in Figure 5. It is known that 29Si spectra resolve the Qm site, where Qm is tetrahedrally coordinated Si linked via oxygen bridges to m tetrahedrally coordinated cations [40]. Figure 5 shows two 29Si signals at −109.61 and −125.17 ppm and a series of spinning sidebands in the RC spectrum. The spinning sidebands are illustrated by asterisks. According to the literature, the dominant signal at −109.61 ppm is attributed to Q4 site in the tetrahedral sheet of the clay [41]. The minor signal at −125.17 ppm is attributed to a silicon impurity associated with the raw clay which disappears after washing. The Q4 signal has almost the same shift after washing as well as after the heat treatment. After adsorption, the Q4 signal shifts from −109.053 to −111.035 ppm as can be seen in DWHCA spectrum. This shift suggests that the tetrahedral-Si environment/structure changes following the adsorption process and then Q4 site is probably influenced by the adsorption process. More details were provided by 27Al and 19F MAS NMR.
27Al nuclear magnetic resonance with magic angle spinning (MAS NMR) spectrum for the purified clay (HP).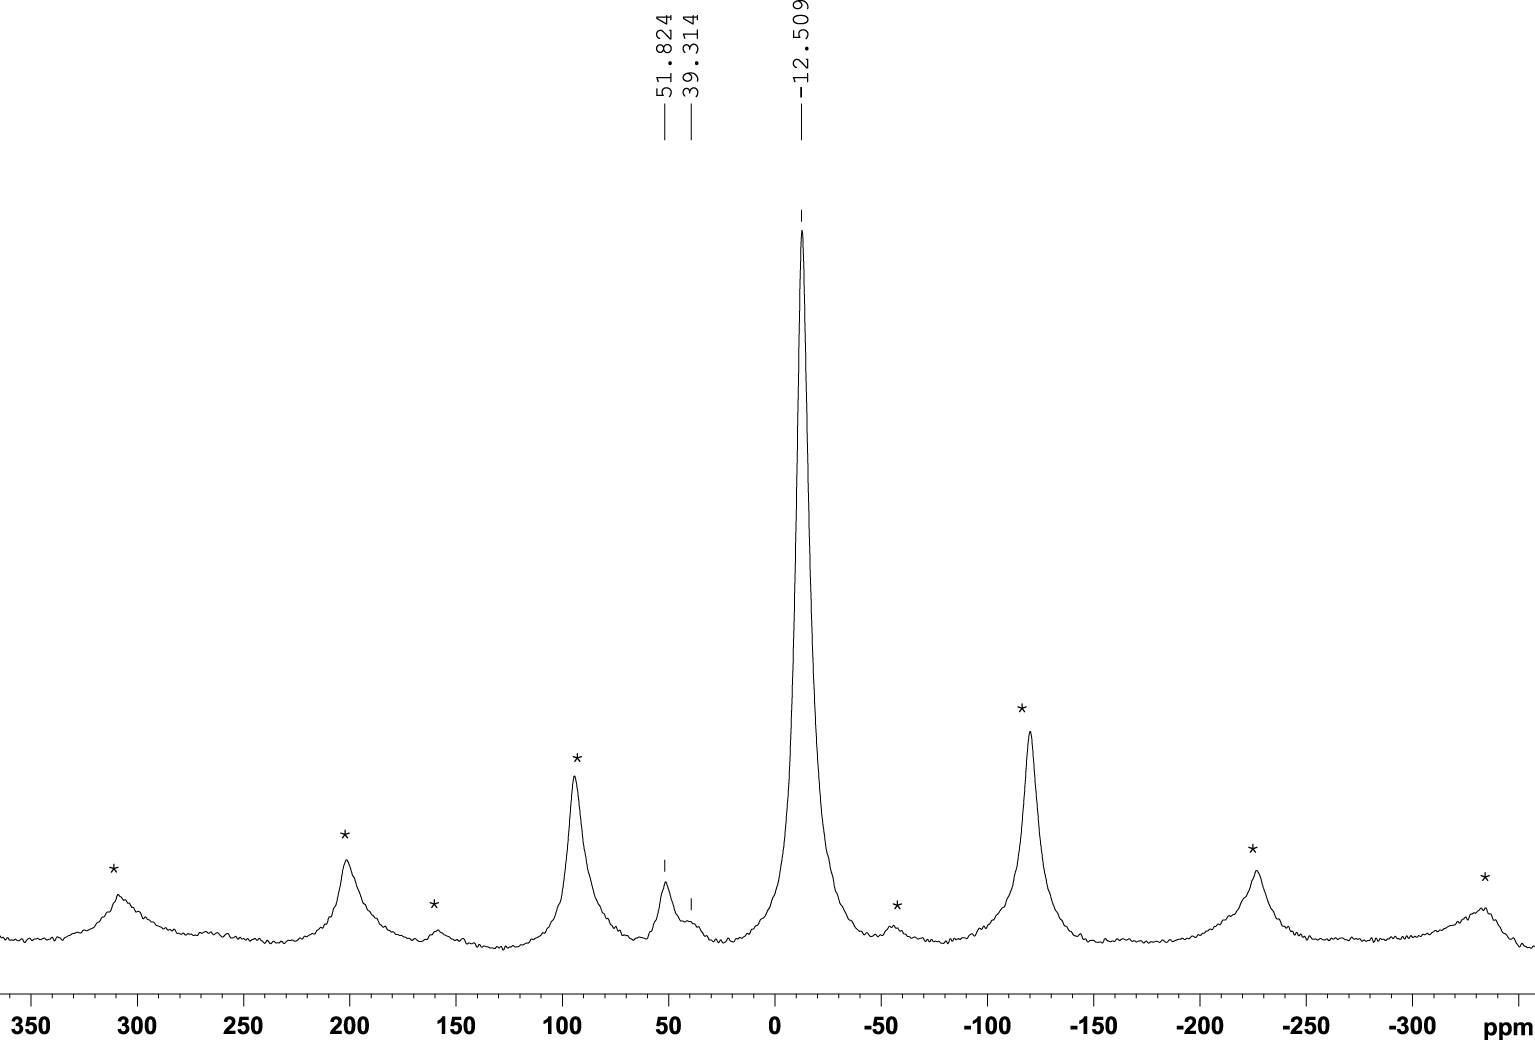
27Al spectra are given in Figure 6. The RC spectrum exhibits three signals at −12.76, 41.48 and 52.21 ppm. The signal at −12.76 ppm is ascribed to Al in octahedral coordination (AlVI). The signals at 52.21 and 41.48 ppm are ascribed to two Al sites in tetrahedral coordination (AlIV) [41]. The chemical shifts may be affected by iron which is a paramagnetic element as it is present in appreciable quantities in the raw clay (approximately 7%) [42, 33]. The high intensity of the AlVI signal indicates that the octahedral sheet contains the majority of the aluminum [43]. After washing, one of the two tetrahedral AlIV sites disappears and DWC spectrum displays two signals at 52.019 and −12.66 ppm. This most likely reflects the partial dealumination of the washed clay as mentioned in the XRD data (Section 3.1.1). To support that, a sample without dealumination (HP) purified according to Benna et al. [42] was analyzed. The 27Al spectrum of HP (Figure 7) maintains such a signal even after purification. After the heat treatment, the DWHC spectrum shows four signals at 50.12, 42.10, 12.29 and −13.03 ppm. The shift at −13.03 ppm is related to AlVI coordination confirmed the partial dehydroxylation process of the clay as illustrated in the DTA-TG data (Section 3.1.2). As expected, a new small signal appears at 12.29 ppm. This signal can be ascribed to Al in penta-coordination (AlV) [44, 45]. The presence of AlV may have originated from the partial dehydroxylation process due to the dehydroxylation process of the clay that involves the reaction of two OH groups per half-unit cell, 2(OH−) = H2O + O2−, and the removal of the structural water out the structure of the clay [46]. The signal at 42.10 ppm corresponding to the AlIV site reappeared but with further broadening and shifts toward lower frequencies. These are indications to distorted tetrahedral Al structure [44]. Indeed, the reappearance of that signal may be due to either the partial transformation of AlVI to AlV as well as AlIV following the partial dehydroxylation process [44, 45] or a possible partial realumination following the collapse of the layers as observed from the XRD data (Section 3.1.1). Also, it can be seen that the AlIV site shifts from 52.02 to 50.12 ppm. This shielding is probably due to the formation of nucleophilic group O2− following the partial dehydroxylation. After adsorption, the DWHCA spectrum exhibited four signals at 50.19, 40.63, 10.76 and −13.15 ppm. By comparison with the sample before adsorption (DWHC), the signals arising from Al in 5-coordination and the distorted tetrahedral intensify and shift to lower chemical shifts by around 1.5 ppm, a shielding by a neighboring nucleophilic group (F−). These transformations indicate probably that the adsorption process of F− ions occurs on these sites. This may suggest that F− ions can occupy the vacant OH group site of AlV and/or AlIV, derived from AlVI and/or react with the dehydroxylated octahedral-Al and the distorted tetrahedral-Al.
19F MAS NMR spectra for the samples before and after adsorption, DWHC and DWHCA, as well as the NaF salt, as reference, are shown in Figure 8. It is important to ensure that the clay material does not contain F− ions. Evidently, the DWHC spectrum does not give a 19F signal. 19F spectrum of NaF exhibits a signal at −238.616 ppm. The DWHCA spectrum displays two 19F signals (existence of two sites) at −239.517 and −225.66 ppm. It may suggest that at least two mechanisms are for F− adsorption on dealuminated heated clay.
19F nuclear magnetic resonance with magic angle spinning (MAS NMR) spectra for the dealuminated washed heated clay (DWHC), dealuminated washed heated clay after fluoride adsorption (DWHCA) and NaF salt as a reference material.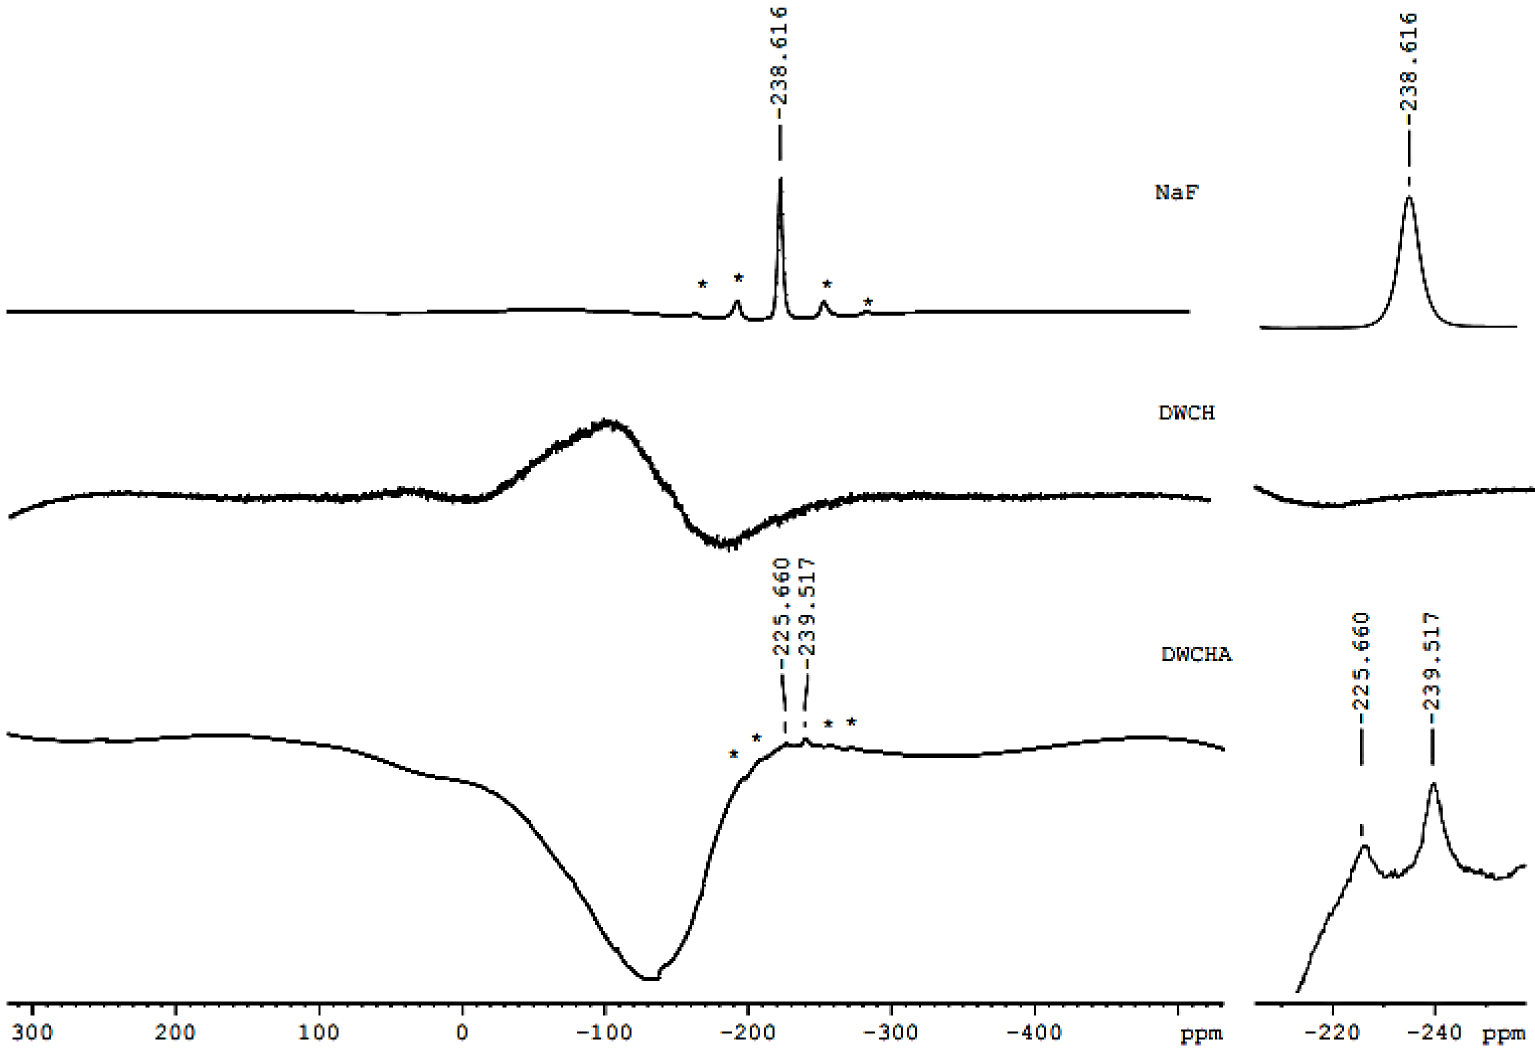
By combining the results of 29Si, 27Al and 19F MAS NMR, F− may occupy the vacancy of the OH group in the AlV coordination site since a shielding at 27Al penta-coordination signal was observed. That was confirmed by the appearance of the 19F signal at −239.517 ppm which was also obtained by the NaF reference material. Also, F− ions may react with the tetrahedral-Al after its distortion since a shielding in 27Al signal related to the distorted tetrahedral, a new 19F signal at −225.66 ppm and a shift in 29Si signal have obtained after adsorption.
3.2. Adsorption study
3.2.1. Effect of the adsorbent dosage
Figure 9 illustrates the effect of the adsorbent dosage (DWHC) on F− adsorption capacities at time t (qt) and the percentage of F− removal (F%). By increasing the DWHC dosage from 0.05 to 2 g/50 mL, F% increases from 10.1 to 79.8%, respectively. But, qt decreases from 0.240 to 0.047 mg⋅g−1, respectively. The increase of F% with more clay particles is due to the enhancement in the number of active sites. The lower qt with higher clay particles may due to the existence of many active adsorption sites for a little amount of F−. Similar qt behavior is reported by Nabbou et al. [5] and Kamble et al. [20].
Clay dosage effect on fluoride adsorption capacities (qt) and the percent of the fluoride removal (F%) (initial F− = 2.44 ± 0.10 mg⋅L−1, t = 120 min, pH = 5.5, T = 20 °C ± 2 °C, Vr = 280 rpm).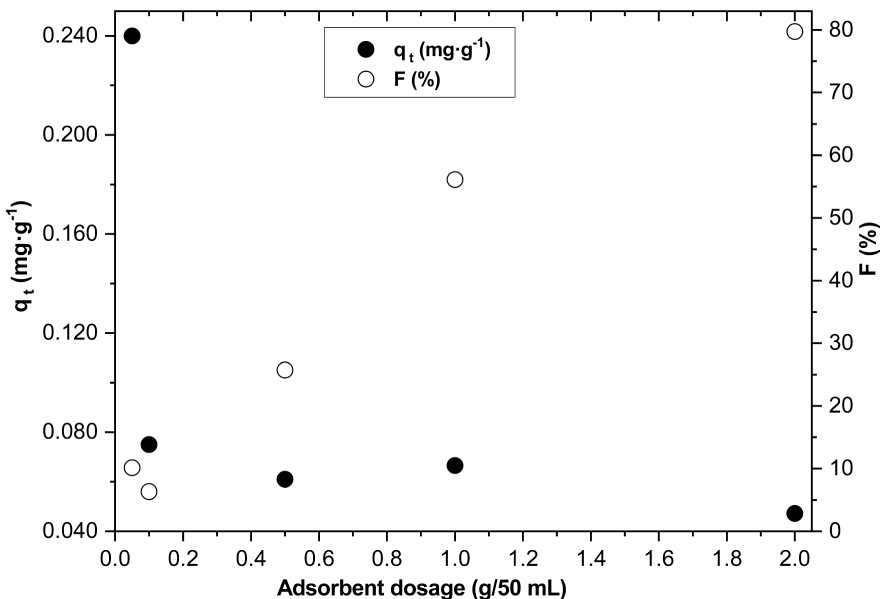
Clay dosage effect versus final fluoride concentration (initial F− = 2.44 ± 0.10 mg⋅L−1, t = 120 min, pH = 5.5, T = 20 °C ± 2 °C, Vr = 280 rpm).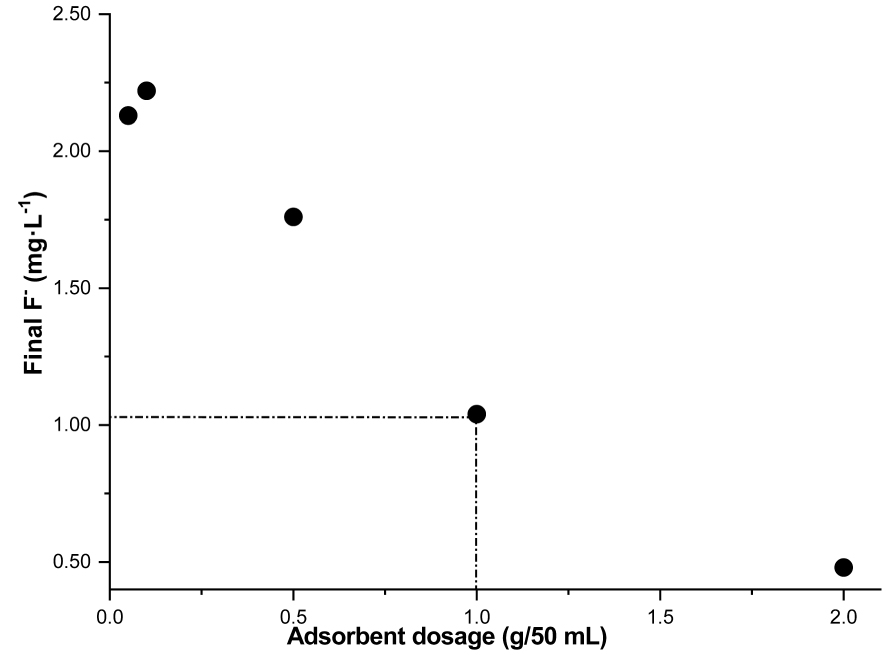
In the literature, some studies observed that F% decreases or remains constant with an increase in the water clay content above a certain level. For example, Goswami and Purkait [16] and Mobarak et al. [24] have observed such behavior at 8 and 4 g⋅L−1 of clay, respectively. This can be explained by the aggregation, overlapping and overcrowding phenomena of the clay particles in the water [16]. In our study, such behavior is not observed up to a dose of 40 g⋅L−1. This is probably a beneficial outcome of the heat treatment of the clay performed before its use as adsorbent. Indeed, when the clay is heated above 400 °C, the swelling property of the clay is reduced because of the dehydroxylation. The release of OH groups following the heat treatment makes the octahedral sheets accessible to interlayer cations (Na+) which decreases the cationic exchange capacity of the clay (CEC) which may decrease its hydrability and its dispersion in water [47].
According to the WHO, the safe F− concentration range is from 0.5 to 1.5 mg⋅L−1. The final concentration of 1.04 mg⋅L−1, achieved with 1 g of DWHC in our experiments, is thus suitable to improve potability (Figure 10). A quantity of 1 g of DWHC per 50 mL was deemed appropriate for the entire subsequent adsorption experiments.
3.2.2. Contact time effect
Figure 11 illustrates the effect of contact time as a function of qt at a fixed initial F− concentration of 2.44 ± 0.10 mg⋅L−1 as Tunisian water fluoride potability is the goal of this research work. As can be seen, qt jumps within the first minute and thereafter qt still almost constant with an average value of 0.077 mg⋅g−1 suggesting a plateau over the range of time studied [1; 120 min]. The equilibrium is thus apparently reached within a minute. That is probably due to the good availability of the active adsorption sites and/or the impossibility of F− to diffuse into the clay particles (DWHC). Note that all final F− concentrations (from 0.89 to 1.15 mg⋅L−1) fluctuated within the safe fluoride concentration range (from 0.5 to 1.5 mg⋅L−1).
Contact time effect on fluoride adsorption capacities (qt) (initial F− = 2.44 ± 0.10 mg⋅L−1, w = 1 g, V = 50 mL, pH = 5.5, T = 20 °C ± 2 °C, Vr = 280 rpm) and the nonlinear fitting plots of the pseudo-first-order (PFO), pseudo-second-order (PSO) and intra-particle diffusion kinetics models.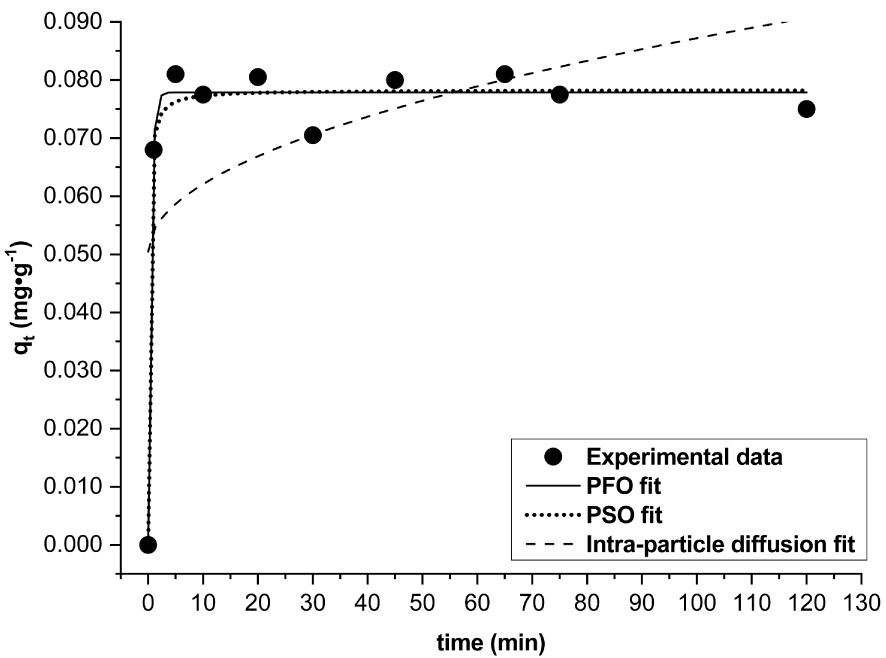
3.2.3. Effect of initial F− concentration
Initial fluoride concentration effect on adsorption capacities at equilibrium (qe) and the fluoride removal percent (F%) (w = 1 g, t = 10 min, pH = 5.5, V = 50 mL, T = 20 °C ± 2 °C and Vr = 280 rpm).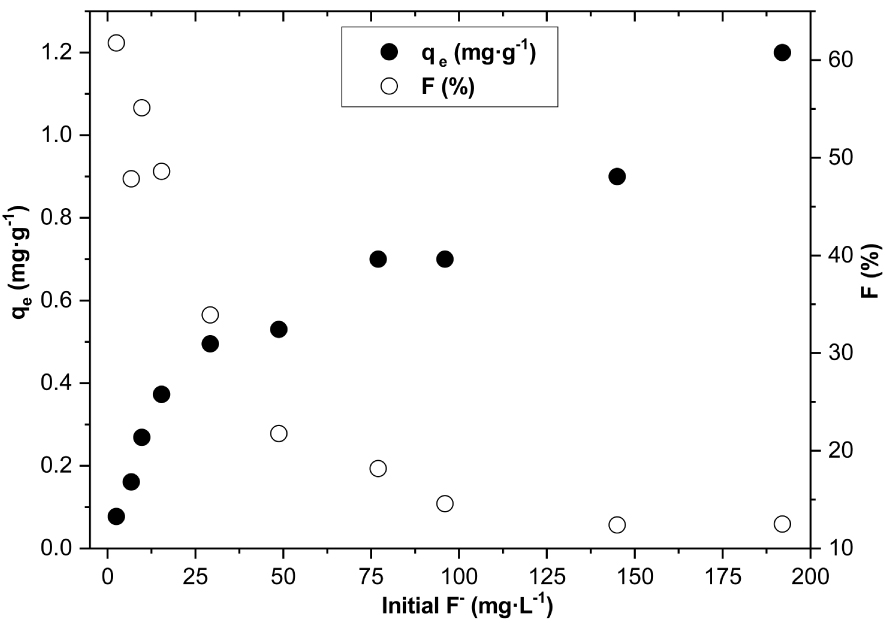
Figure 12 illustrates the effect of the initial F− concentration on the adsorption capacities at equilibrium (qe) and the percentage of F− removal (F%). It is observed that when initial F− concentration increased from 2.51 to 192 mg⋅L−1, qe increased from 0.081 to 1.2 mg⋅g−1 while F% decreased from 61.8 to 12.5%. Such trends in both qe and F% were also observed by Thakre et al. [21]. The decrease in F% with higher F− concentration is probably due to (i) the competition between F− for the active adsorption sites [16] and/or (ii) the exhausting of the binding capacity of the clay [21, 23].
Adsorption kinetics parameters for pseudo-first-order, pseudo-second-order and intra particle diffusion models
| Models | Parameters | Values | R2 | SSE |
|---|---|---|---|---|
| Pseudo-first-order | k1 (min−1) | 2.07 | 0.983 | 0.00009 |
| qecal (mg⋅g−1) | 0.0779 | |||
| Pseudo-second-order | k2 (min−1) | 96 | 0.980 | 0.0001 |
| qecal (mg⋅g−1) | 0.0783 | |||
| Intra-particle diffusion | ki (min−1) | 0.004 | 0.279 | 0.004 |
| I (mg⋅g−1) | 0.050 |
3.3. Adsorption modeling
3.3.1. Adsorption kinetics
Kinetics experimental data were modeled according to the pseudo-first-order, pseudo-second-order and intra-particle diffusion models. The nonlinear regression fits and their corresponding kinetics parameters are given in Figure 11 and Table 1. The intra-particle diffusion model could not be fitted successfully to the experimental data (R2 = 0.279). Determination coefficients, R2, of the pseudo-first-order (PFO) and the pseudo-second-order (PSO) models are 0.983 and 0.980, respectively. Sum of square error of PFO and PSO are 0.00009 and 0.0001, respectively. Both SSE are very low but that of PFO is the lowest. The parameter qe calculated using PFO (0.0779 mg⋅g−1) and PSO (0.0783 mg⋅g−1) models both gave values well close to the experimental value (0.081 mg⋅g−1). It may be concluded that experimental data can be fitted with both PFO and PSO models. This suggests that the rate-limiting step may be controlled by physisorption as well as chemisorption.
3.3.2. Adsorption equilibrium isotherm
Adsorption isotherm and the nonlinear fitting plots of the Langmuir and Freundlich isotherm models.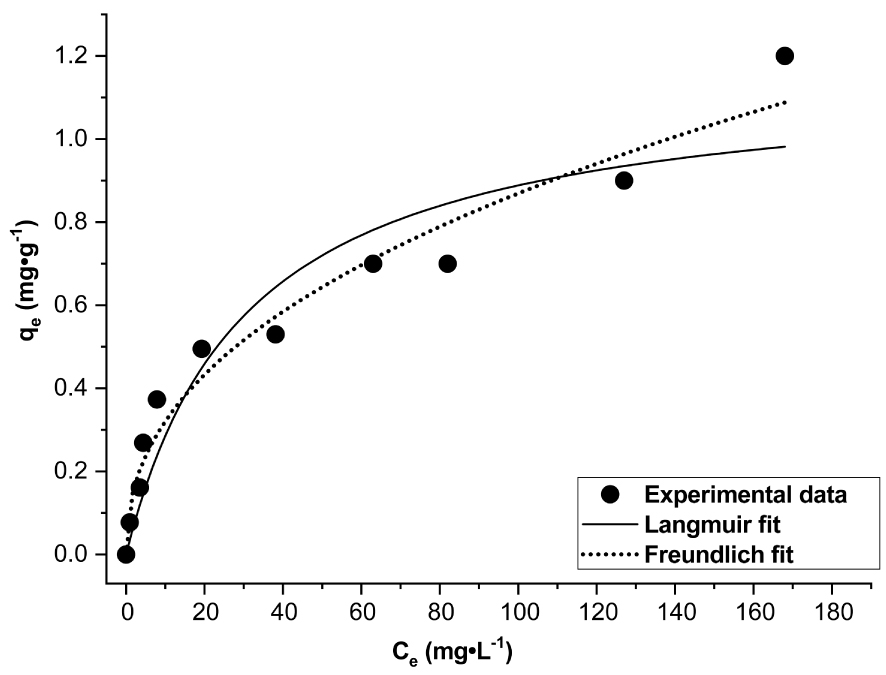
The adsorption isotherm at T = 20 ± 2 °C is shown in Figure 13. The isotherm is of L-type as the curve shape is concave [48, 49]. The curve doesn’t reach a plateau and the sorption capacity of the clay increases as the solute concentration rises [49]. Experimental data followed Langmuir and Freundlich models. The fitted plots and their corresponding parameters are illustrated in Figure 13 and Table 2. The maximum adsorption capacity of DWHC (qm) is of 1.16 mg⋅g−1. Values of RL calculated at the different initial F− concentrations (Figure 14) are between 0 and 1 which indicates that the F−/DWHC system is favorable for adsorption [23, 50]. The value of n is between 2 and 10 which indicates effective adsorption process features [24]. On the basis of R2 and SSE values, experimental data can be fitted with Freundlich and Langmuir models with the Freundlich model giving better results. This suggests that the adsorption process is dominated by multilayer formation on heterogeneous active sites.
Values of the dimensionless equilibrium factor of the Langmuir model (RL).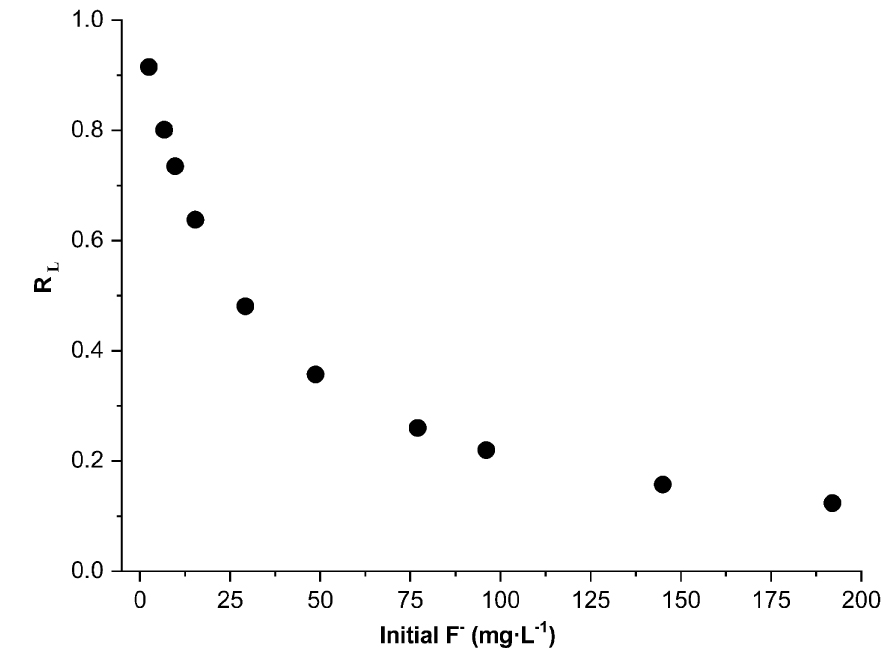
Adsorption isotherm parameters obtained by non-linear regression fitted to Freundlich and Langmuir models
| Models | Parameters | Values | R2 | SSE |
|---|---|---|---|---|
| Langmuir | qm (mg⋅g−1) | 1.16 | 0.904 | 0.129 |
| KL (L/mg) | 0.033 | |||
| Freundlich | n | 2.31 | R2 | SSE |
| KF (mg/g) (mg/L)1∕n | 0.118 | 0.966 | 0.045 |
3.4. Water hardness effect on fluoride speciation
The physico-chemical analysis results of the field water are listed in Table 3. The F− concentration (2.51 mg⋅L−1) exceeded the recommended safety limit. The water hardness was 947.1 mg⋅L−1 CaCO3 which indicates very hard water [51] with high Ca (213 mg⋅L−1), Mg (101 mg⋅L−1), Na (318 mg⋅L−1) and K (9.8 mg⋅L−1) concentrations.
Physico-chemical parameters of the field water sample before and after fluoride adsorption
| Parameters | Before adsorption | After adsorption |
|---|---|---|
| pH | 7.50 | 7.62 |
| F− (mg⋅L−1) | 2.51 | 1.15 |
| Cl− (mg⋅L−1) | 286 | 299 |
| (mg⋅L−1) | 16.7 | 17.5 |
| (mg⋅L−1) | 1025 | 1095 |
| (mg⋅L−1) | <0.3 | <0.3 |
| Ca2+ (mg⋅L−1) | 213 | 192 |
| Mg2+ (mg⋅L−1) | 101 | 72 |
| Na+ (mg⋅L−1) | 318 | 360 |
| K+ (mg⋅L−1) | 9.8 | 50.9 |
Thermodynamic calculations indicated that fluoride in the field water sample were present mostly as free F− ions (83.4%) while MgF+ and CaF+ complexes can also be present in low proportions (estimated at 13.7% and 1.6%, respectively). It can be concluded that the hardness has little effect on fluoride speciation which is in agreement with the literature [52]. Note that NaFaq can also be present (1.2%).
19F NMR spectra are shown in Figure 15. The 19F spectrum related to the F− synthetic solution shows a shift at −122.69 ppm of F− ions. Likewise, such a shift (−119.25 ppm) has been obtained from the 19F spectrum of the field water sample. That also indicates that fluoride is present as free F−. However, CaF+, MgF+ and NaFaq complexes could not be detected because of their very low proportions.
19F Nuclear Magnetic Resonance (NMR) spectra for the field water sample and the fluoride synthetic solution as a reference.
3.5. Batch process applicability
The objective of this study was to provide a treatment solution to improve the potability of Tunisian drinking water in terms of fluoride, which poses a risk to the population. The operational conditions (t = 10 min, pH of the drinking water, T = 20 ± 2 °C, w = 1 g, V = 50 mL and Vr = 280 rpm) were constrained to realistic ranges in the hope of a subsequent field application of the treatment. The F− concentration in the groundwater drinking water was 2.51 mg⋅L−1 before adsorption and was reduced after adsorption to 1.15 mg⋅L−1. Successfully, the final F− concentration was well in the safe range. Moreover, no significant variation in water pH was observed. This is a promising result as the adjustment and readjustment of water pH is a major limitation which may render the adsorption process inapplicable [7, 24]. Likewise, no significant increases in anion concentrations were observed. However, a decrease in Ca2+ and Mg2+ concentrations was observed. This was offset by an increase in Na+ (318–360 mg⋅L−1) and K+ concentrations (9.8–50.9 mg⋅L−1) due to the CEC of the clay and to its leaching from the adsorbent (probably from the illite), respectively. Such a result is a better outcome than that of Mudzielwana et al. [23] who observed an increase in K+ concentration from 2.74 to 113 mg⋅L−1.
4. Comparison of different adsorbents for fluoride adsorption from water
Comparison of different adsorbents for fluoride adsorption from water
| Adsorbent | Dosage (g⋅L−1) | Initial F− (mg⋅L−1) | pH | F (%) | Adsorption capacity (mg⋅g−1) |
|---|---|---|---|---|---|
| Ca-modified Mg–Zr mixed metal oxides [53] | 0.5 | 100 | 7 | 72.03 | 144.05 |
| Zr (IV)-impregnated Fe3O4/ chitosan/graphene oxide [54] | 1 | 10 | 4 | 57.8 | 5.78 |
| Hydrothermally and chemically treated aluminosilicate clay [55] | 20 | 6 | 5.8 | 53 | 1.75 |
| Coated Fe3O4 on granular activated carbon [56] | 1 | 4 | 3 | 68.5 | 2.74 |
| Dealuminated/realuminated dehydroxylated clay [This study] | 20 | 2.51 | 5.5 | 61.75 | 0.078 |
| 20 | 6.73 | 5.5 | 47.86 | 0.1 |
Table 4 presents different adsorbents suggested in the literature for fluoride adsorption from water. It seems that the adsorbent developed in this study has a smaller adsorption capacity of 0.078 mg⋅g−1 with 61.75% fluoride removal at an initial concentration of 2.51 mg⋅L−1. The dealuminated/realuminated dehydroxylated clay can reduce the fluoride concentration, without any adjustments of water pH and the aggregation of the clay particles in the water, below the permissible limit recommended by WHO (1.5 mg⋅L−1). As well, it is natural, treated without the adding of any chemical products and relatively inexpensive. These results suggest that the dealuminated heated clay can be a promising fluoride adsorbent for drinking water.
5. Conclusion
Our findings show that clay dealuminated by repeated washing and heated is appropriate for removing fluoride from drinking water without any problem neither of pH readjustment nor of aggregation. Distorted tetrahedral-Al coordination and penta-Al coordination clay sites were responsible for fluoride adsorption. Adsorption equilibrium was achieved very quickly and kinetics data followed both pseudo-first-order and pseudo-second-order models indicating that adsorption occurred by physisorption and chemisorption. Adsorption isotherm data fitted better to the Freundlich model suggesting multilayer adsorption on heterogeneous sites. Using field-collected water, the F− concentration can be lowered from 2.51 mg⋅L−1 to 1.15 mg⋅L−1. The Tunisian fluoride drinking water potability range was thus successfully reached.
The dealumination/relaumination and dehydroxylation of the clay are the main phenomena that improve the efficiency of the clay as a fluoride adsorbent. Hence, the degree of dealumination/realumination, the degree of dehydroxylation that can affect the clay properties (such as the CEC and the specific surfaces area, etc …) require further investigations in order to understand their effects on the fluoride adsorption efficiency. Also, the reusability of the adsorbent, the desorption studies and the field design process are needed for a future industrial application.
Conflicts of interest
Authors have no conflict of interest to declare.
Acknowledgments
Scholarships awarded to MC by the ministry of higher education and scientific research of Tunisia for travel to the Institut National de la Recherche Scientifique, Centre Eau Terre Environnement (INRS-ETE) in Quebec, Canada, are gratefully acknowledged. Research conducted at INRS-ETE was supported by the Canada Research Chair program [grant 950-231107 to CF].