


 CC-BY 4.0
1. Introduction
Plastic materials are widely used in many domains such as bottling, packaging, agriculture and industry. However, their excessive employment and their disposal in green places can cause serious environmental problems. To reduce or solve these ecological issues, plastics should be transformed into value-added products. In the Site “Invest in Tunisia”, it was stated that the incentives in the plastics-processing industry are quite evident and a list containing the strengths and relevant opportunities to investors in plastics-manufacturing industries was also included. However, it is worth noting that in 2015 foreign investment in plastics-manufacturing industries contributed to the creation of 11,000 jobs across the country [1].
At present, Tunisia does not impose strict regulations to minimize environmental pollution, as the Government has not yet introduced a serious policy on waste reduction. In 2020, Tunisia produced about 2.6 million tons of solid waste and about 245 thousand tons of plastics [2]. It was the 4th consumer of plastic products in the Mediterranean region and 60% of this amount of solid waste were sent to landfills, 16% were openly thrown away into Nature and only 4% were recycled [3]. Waste management should give priority to recycling and recovery, which makes it possible to complete the circular economy cycle [4].
The municipal solid waste can be transformed into adsorbent materials, such as activated carbons (ACs). The production of ACs from a diversity of carbonaceous raw materials, of natural or synthetic origins, (e.g. charcoal, peat, lignite [5], bituminous coal, cork, olive pits [6], Prosopis juliflora [7], polyacrylonitrile [8] and pure polyethylene terephthalate) was widely dealt with in previous research works [9, 10]. It was proven that ACs can be produced by chemical or physical activation of the precursor. Moreover, a review showing the results obtained with different activating agents was presented by Heidarinejad and co-authors in 2020 [11]. Physical activation happens at a temperature varying between 650 and 900 °C, in an oxidizing atmosphere [5]. The textural properties of the ACs change depending on the precursor and the activating agent as well as the activation temperature. Indeed, carbon dioxide favours the development of microporosity while water vapour leads to a more developed porosity [12, 13, 14]. On the other hand, chemical activation takes place under an inert gas flow at temperatures ranging from 400 to 800 °C. During this process, the precursor is mixed dry with the activation agent or impregnated in an aqueous solution, before heating. The most referenced activating agents are phosphoric acid [7, 15] sodium hydroxide, potassium hydroxide [10, 16, 17] and potassium carbonate [10]. Indeed, chemical activation prevents the excessive loss of AC mass observed during physical activation and leads to ACs with a better-developed porosity [10, 16, 17, 18].
ACs have been successfully utilized in several fields such as emission control, filtration and purification of gases, decolourization, adsorption of dyes [19], gaseous pollutants [20], heavy metals, pharmaceuticals [21] and pesticides [10, 22].
Nowadays, the main concern of the research community is how to treat the liquid effluents containing pesticides and herbicides and reuse in the agriculture without damaging Nature. These sources of pollution, eutrophication and unaesthetic disturbance to aquatic life present a potential danger of bioaccumulation. They can be removed from liquid effluents, using a thermal, physical, biological or chemical process. Among a diversity of processes available, the adsorption on ACs scores well in a review paper made by Hattab and Ghaly in 2012 where 18 methods used to treat pesticides were evaluated in terms of operational cost, implementation area, detoxification ability and ease of use [23].
Most AC materials utilized as solid fuel, for energetic purpose, or as adsorbent, for pollutants removal from the liquid phase, are derived from biomass resources which are also used in the feeding of animals. For that reason, the present work focuses on precursor derived from plastic waste instead of biomass. Two modes of valorization were studied. The first one is the conversion of PET waste into AC and its potential use as an adsorbent for herbicides removal and the second mode is the potential conversion of PET waste into a solid fuel for energetic purposes.
2. Materials and methods
2.1. Production of char and activated carbons
2.1.1. Char production
The precursor used in this study is PET recuperated from a plastic waste point collection, in Mourouj, Ben Arous, Tunisia. Waste bottles were cut into small pieces with dimensions varying between of 0.5–1 cm. Char was produced in a furnace by PET carbonisation under a nitrogen flow of 70 mL⋅min−1. The furnace is equipped with a temperature control programmer, allowing the control of the temperature rate (10 K⋅min−1) and final temperature (between 973 and 1073 K) (Figure 1).
Small pieces of waste PET and the rotative furnace used for char and activated carbon production.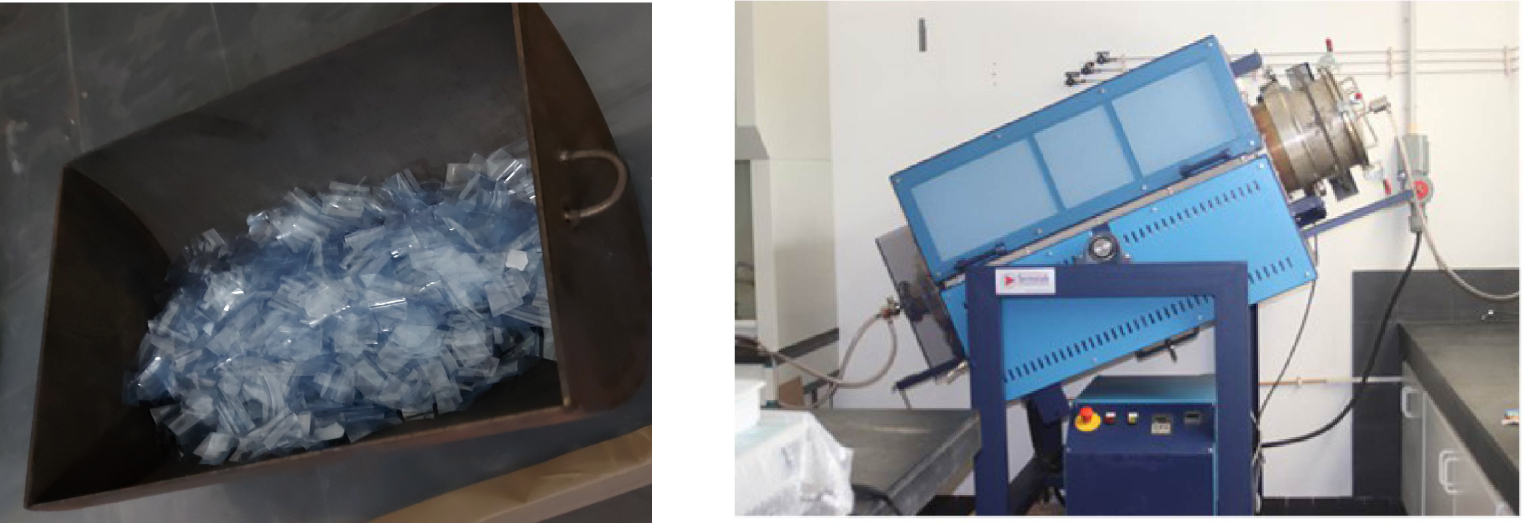
2.1.2. Activated carbon production by physical activation
After applying a step similar to that of the char production, the recuperated char was physically activated using carbon dioxide, at 973 K and 1073 K, or air at 1073 K under a fixed flow of 110 mL⋅min−1 during time intervals ranging from 15 to 240 min.
2.1.3. Activated carbon production by chemical activation
To carry out chemical activation, 200 g of PET waste were placed in a beaker and mixed with previously-crushed 200 g of KOH (Sigma). The mixture was put in a stainless-steel container, brought to the furnace and submitted to a heating rate of 10 K⋅min−1 from room temperature to a final temperature of 753, 873 or 1073 K. The samples were activated and cooled in the presence of nitrogen flow of 70 mL⋅min−1. The carbonaceous materials were taken out of the furnace and washed extensively with distilled water, until the pH of the washing water reached almost 7.
2.2. Activated carbons characterization
All ACs were structurally and chemically characterized, at 77 K by nitrogen adsorption, Scanning Electron Microscopy with energy-dispersive X-ray spectroscopy (SEM-EDX), X-ray diffraction (XRD), Fourier Transform Infrared spectroscopy (FT-IR), and elemental analysis as well as by determining the point of zero charge (pHzpc).
2.2.1. Textural characterisation of the carbon samples
A full textural characterization of an AC material requires specifying its apparent surface area, external area, total porous volume (macro, meso and micropores), mean pore size and pore size distribution. These characteristics were obtained from the nitrogen isotherm, carried out at 77 K. The ACs, degassed under a vacuum system for 12 h at 493 K, were placed in an appropriate cell. The latter was, then, put into the Quantachrome Autosorb iQ2-C Series equipment where the data obtained by the adsorption isotherm were recorded.
2.2.2. XRD
The X-ray diffraction spectra were provided using an X’Pert Pro Pan analytical X-ray diffractometer, D8 ADVANCE, from Bruker, USA. Subsequently, different diffractograms were processed by X’pertHight Score Plus software.
2.2.3. SEM
Scanning Electron Micrographs of the selected samples were obtained employing a Quanta 3D FEG electron microscope purchased from FEI Company, with a resolution of 30x–200,000 Kx, and an accelerating voltage varying between 0.2 and 30 kV. These analyses were conducted by the Servicio de Apoyo à l’Investigación, at the Servicio de Análisis Elemental y Molecular of the University of Extremadura, Spain.
2.2.4. FTIR
The ACs’ chemical functional groups were identified based on the FTIR spectra, obtained using a Perkin Elmer Two FTIR Spectrophotometer, from Perkin Elmer, USA, by applying the KBr disc method with a resolution of 4 cm−1 and 20 scans between 4000 and 450 cm−1.
2.2.5. Determination of the point of zero charge
The pHzpc was evaluated by first suspending a mass of 7% (w/v) of AC in solutions of HNO3, NaOH or NaNO3 (Riedel). The suspensions were maintained for 2 days in a thermostatic stirring bath at room temperature. Then, they were filtered, and the pH of the solution was measured, to identify the pHzpc of ACs.
2.3. Herbicides removal from the aqueous phase
Two herbicides were used. The first is 2-Methyl-4-chlorophenoxyacetic acid (MCPA—C9H9ClO3) (Sigma), which is a powerful and widely used hormone-selective systemic herbicide, with a water solubility of 825 mg⋅L−1 at 298 K [24]. The second herbicide is 2,4-Dichlorophenoxyacetic acid (2,4-D—C8H6Cl2O3) (Sigma), which is an herbicide belonging to the phenoxy acetic acid family, with a water solubility of 660 mg⋅L−1 at 298 K [25].
In an Erlenmeyer, 10 mg of AC were added to 25 mL of an aqueous solution of MCPA or 2,4-D, with concentrations varying between 5 and 250 mg⋅L−1. To study the kinetics of MCPA and 2,4-D removal from the liquid phase, the suspensions were kept under agitation in a thermostatic shaker bath, for a period varying between 15 min and 48 h and at 22 °C, 30 °C and 40 °C. The effect of pH of the solution on maximum adsorption capacity of the ACs was also evaluated, at pH solutions ranging from 1.7 to 11.2.
To quantify the herbicide present in the solution, after different equilibrium times, small aliquots were collected, filtered with a nylon membrane filter of 0.45 μm (Filtres Fioroni, France) and analyzed by UV/Vis spectroscopy, using a UV–Vis spectrophotometer, Nicolet Evolution 300. The quantification was done at a wavelength of 228 and 280 nm, for MCPA, as well as 230 and 285 nm for 2,4-D, respectively. Both herbicides were quantified employing an external pattern and the amount Qads (mg⋅g−1) of the adsorbed herbicide was determined applying the following equation:
| (1) |
2.4. Potential use of the activated carbons as a solid fuel
2.4.1. Elemental analysis
The elemental analysis, which determines the percentages of carbon, hydrogen, sulphur, nitrogen and oxygen present in each AC, was carried out by the Servicio de Apoyo a l’Investigación, at the Servicio de Análisis Elemental y Molecular of the University of Extremadura. Other elements, present on the ACs surfaces, such as potassium, iron and calcium, were identified by SEM-EDX.
2.4.2. Higher calorific value (HCV) and energy content
The HCV of the ACs was determined by using elemental analysis and applying the following equation [26]:
| (2) |
3. Results and discussion
3.1. Characterization of the ACs
The char and the ACs were produced on a semi-industrial pilot horizontal furnace, with a rotative system, at the University of Évora, Portugal. Such furnace allows producing a large amount of AC in each batch. Although the pilot furnace is still in the early stages of operation, it plays an important role in improving the industrialization of the ACs production.
During the physical activation with CO2 or airflow, the burn-off of the produced ACs increased while the yield decreased with the rise of the activation time. Concerning the ACs prepared by chemical activation, with KOH, the yield decreased with the augmentation of the activation temperature. However, the yield was always higher than that obtained with physical activation, as presented in Table 1.
Textural parameters of carbonaceous samples obtained from the analysis of the nitrogen adsorption isotherms
| Physical activation | Chemical activation | |||||||||
|---|---|---|---|---|---|---|---|---|---|---|
| Carbonisation | CO2 | Air | PET/KOH 1:1 | |||||||
| Activation time (min) | Temperature (K) | |||||||||
| 60 | 120 | 15 | 240 | 723 | 873 | 1073 | ||||
| Sample name | Char | PET-860-CO2 | PET-8120-CO2 | PET-815-Air | PET-8240-Air | PET-KOH-450 | PET-KOH-600 | PET-KOH-800 | ||
| Yield (%) | 19.1 | 18.8 | 18.5 | 15.9 | 14.4 | 27.0 | 22.5 | 20.2 | ||
| ABET (m2⋅g−1) | 4.3 | 20.2 | 77.8 | 25.2 | 621.2 | 16.6 | 50.2 | 732.7 | ||
| As (m2⋅g−1) | 27.3 | 42.2 | 38.9 | 25.9 | 22.7 | 26.0 | 98.6 | 93.2 | ||
| Vs (cm3⋅g−1) | 0.001 | 0.001 | 0.039 | 0.022 | 0.26 | 0.004 | 0.019 | 0.31 | ||
| V0 (cm3⋅g−1) | — | 0.004 | 0.002 | 0.007 | 0.17 | 0.005 | 0.007 | 0.21 | ||
| L0 (nm) | — | — | — | 4.6 | 1.18 | — | — | 2.86 | ||
| pHzpc | 9.13 | 8.81 | 8.36 | 9.28 | 7.77 | 8.17 | 8.34 | |||
ABET (m2⋅g−1): BET surface area, As (m2⋅g−1): Apparent surface area, L0 (nm): mean pore size, Vs (cm3⋅g−1): porous volume, V0 (cm3⋅g−1): micropore volume, pHZPC: pH at the point of zero charge.
3.1.1. Textural characterization of the produced activated carbons
Figure 2 shows the nitrogen adsorption isotherms, obtained at 77 K for the carbonized sample (char) and ACs prepared from PET waste by physical activation with airflow and CO2 at 1073 K, or by chemical activation with KOH at different temperatures. The textural parameters obtained from the analysis of the N2 isotherms, provided by applying the Brunauer–Emmelt–Teller (BET) and Dubinin-Radushkevich (DR) equation and alfa-s method, are included in Table 1.
Nitrogen adsorption isotherms obtained, at 77 K, of different ACs prepared, from waste PET, by chemical activation with KOH, and by physical activation with CO2 and airflow. Open symbols—adsorption, filled symbols—desorption.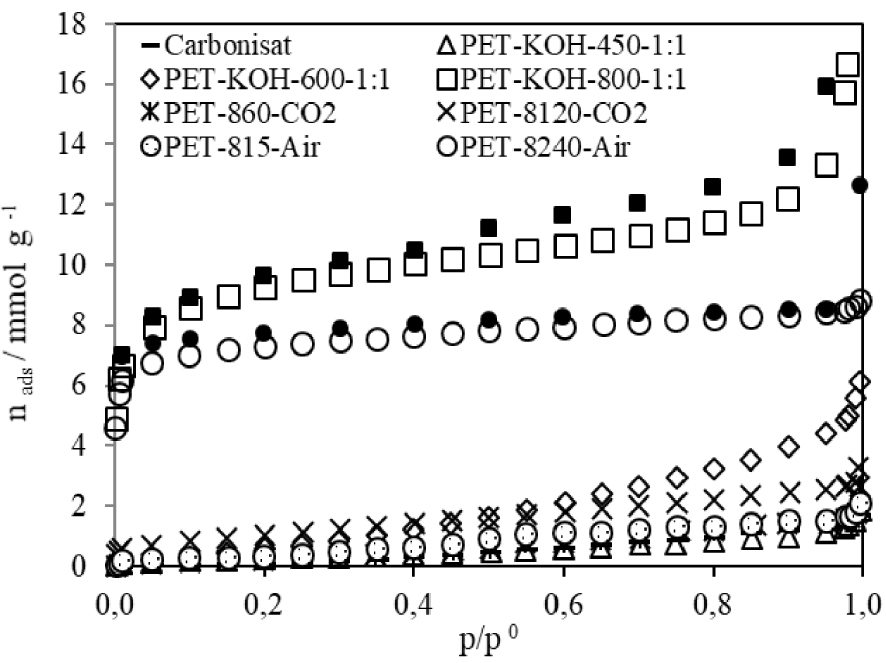
The char presents low affinity and adsorption capacity for N2 molecules which does not exceed 2 mmol⋅g−1 and a low specific surface area of 4.3 m2⋅g−1. The isotherms of ACs prepared by physical activation shows a hysteresis cycle that extends to a low relative pressure. This hysteresis cycle was more evident in samples having lower volume and narrow mean pore size (PET-860-CO2, PET-8120-CO2, PET-815-Air, PET-KOH-450-1:1 and PET-KOH-600-1:1). However, a similar hysteresis cycle was presented for PET-8240-Air, which confirms the presence of narrow pores, whose average dimension was 1.18 nm.
The physical activation with airflow seems more effective than that with CO2: at the same temperature, the burn-off obtained with airflow after 15 min was superior to the burn-off with CO2 after 60 min. Obviously, the increase in the activation time favoured the development of textural parameters, producing AC with a surface area of 621.2 m2⋅g−1 and a pore volume of 0.26 cm3⋅g−1 (PET-8240-Air), after an activation time equal to four hours.
As far chemical activation is concerned, and with the same ratio of PET and KOH (1:1), the apparent surface area and porous volume increased significantly with the rise in the activation temperature. The AC produced at 1073 K (PET-KOH-800-1:1) exhibited an apparent surface area of 732.7 m2⋅g−1 and a porous volume of 0.31 cm3⋅g−1. In some previous works [9, 10], authors published data about the production of ACs from recycled PET. However, the carbon materials produced were obtained in a small furnace, where all parameters were judiciously controlled. The use of this pilot furnace allowed obtaining a higher amount of AC than that provided on a laboratory scale. Whereas the time spent for each batch was similar in both situations, the amount of the monthly-produced ACs was about 100 times higher than that produced with the laboratory furnace, which reduced the AC final price production.
3.1.2. SEM-EDX spectroscopy
The ACs were analysed based on SEM-EDX spectroscopy. Figure 3 shows some representative images of the SEM and EDX micrographs obtained for char and ACs. It was difficult to identify a porous structure on the surface of the char sample, which is in accordance with the low micro-pore volume obtained from the N2 isotherm. Two different areas were identified on the PET-8240-Air. The area in the foreground corresponds to a porous structure, while in the background the AC seems completely compact without any identified porous structure. For PET-KOH-800-1:1, the activation allowed larger porous structure.
SEM and EDX micrographs of char and ACs (each mark corresponds to: (a) 40 μm, (b) and (c) 50 μm.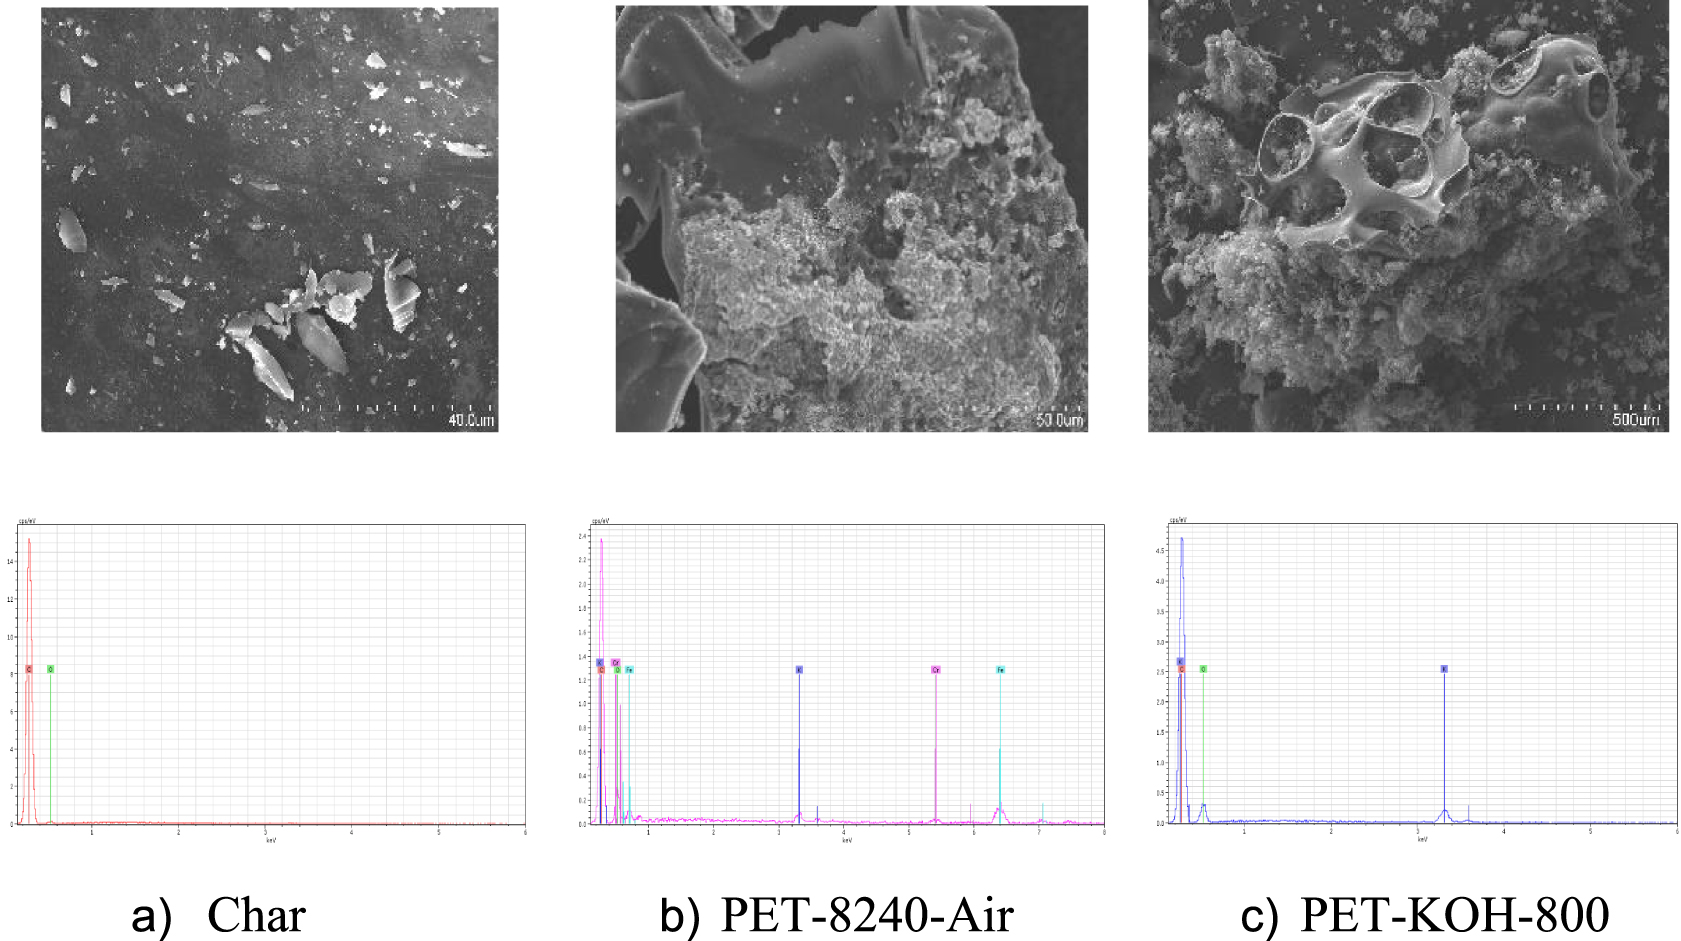
It is clear that potassium was present in the ACs produced by chemical activation with KOH. The ACs activated with CO2 contains also a small amount of potassium. In the ACs activated with airflow, some heteroatoms (e.g. iron, silicon, aluminium, chromium and calcium) were present. The presence of these impurities was attributed to the low quality of the airflow used in the activation process.
3.1.3. Characterization of the activated carbon by FTIR
The FTIR spectra of the ACs prepared by chemical activation with KOH and physical activation with airflow at 1073 K are presented in Figure 4. The stretching vibrations of OH groups (alcohols, phenols and carboxylic acids) present on aromatic rings were observed between 3000 and 3500 cm−1 [27]. The stretching and deformation of NH2 and N–C–N bonds were identified in the ranges 3200–3400 cm−1 and 570–620 and 1140 cm−1–1190 cm−1, respectively. The C–H stretching bands at about 2925 and 2852 cm−1 were present with different intensities for both samples [27]. The absorption band noticed at 1600 and 1623 cm−1 corresponds, respectively, to the C=C and C=O stretching vibrations of the carbonyl groups near the NH2 group. However, the bands at 1034 and 1106 cm−1 are associated with C–O stretching vibrations. The bands appearing at 1600 cm−1 refer to the axial deformation of the carbonyl groups [17], while those at 1400 cm−1 correspond to C=N stretching and C–O stretching of the carboxyl groups and CH2 bending [17, 27]. The absorption bands at 656–568 cm−1 and 685 cm−1 show N–H bending out of the plan and the ring deformation in the plane, respectively.
FTIR spectra of PET-KOH-800-1:1 and PET-8240-Air.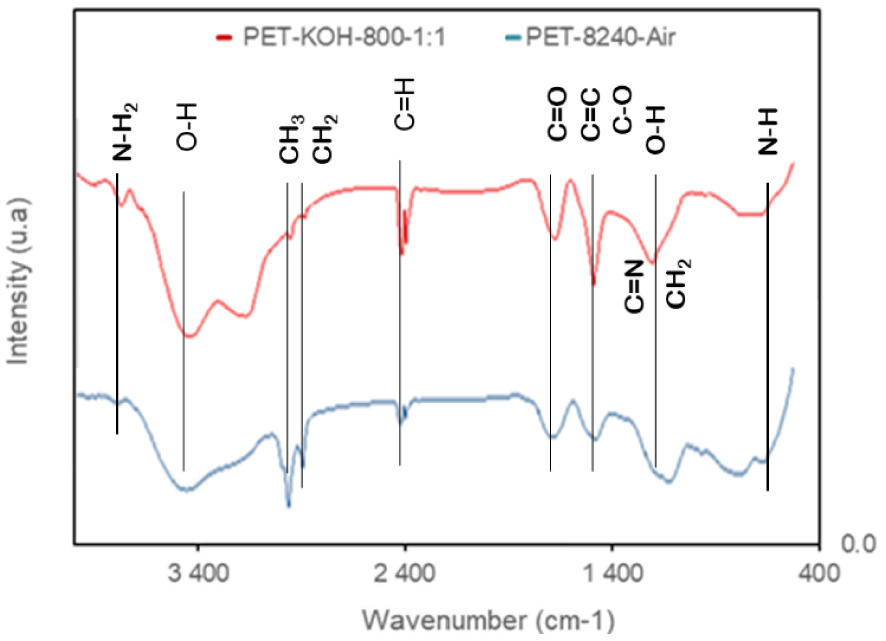
Some thermally-stable aromatic groups, such as pyrrole and pyridinic-like functionalities, were identified, in overlap with the bands corresponding to the stretching mode associated to C–N, C=N, on the profile of IR spectra around 1034–1106 cm−1.
3.1.4. Determination of the pH at the point of zero charge
The pH at the point of zero charge (pHzpc) of the ACs was assessed and the values are included in Table 1. The ACs produced by physical activation have a more basic character (pHzpc from 8.36 to 9.28), compared to the ACs prepared with chemical activation (pHzpc from 7.77 to 8.34).
3.1.5. Characterization of the activated carbon by XRD
PET-8240-Air and PET-KOH-800-1:1 were characterized by X-ray diffraction and the spectra are presented in Figure 5. The spectra have the same global aspect. In the range between 10° and 50°, both profiles exhibit a very broad diffraction peak and the absence of a sharp peak reveals a predominantly amorphous structure. The XRD pattern exhibits two broad peaks at ∼25° (attributed to 002 plane) and 42° (attributed to 100 plane), resulting from the stacking of some graphene-like layers in both ACs.
Diffractogram of PET-KOH-1:1-800 and PET-8240-Air.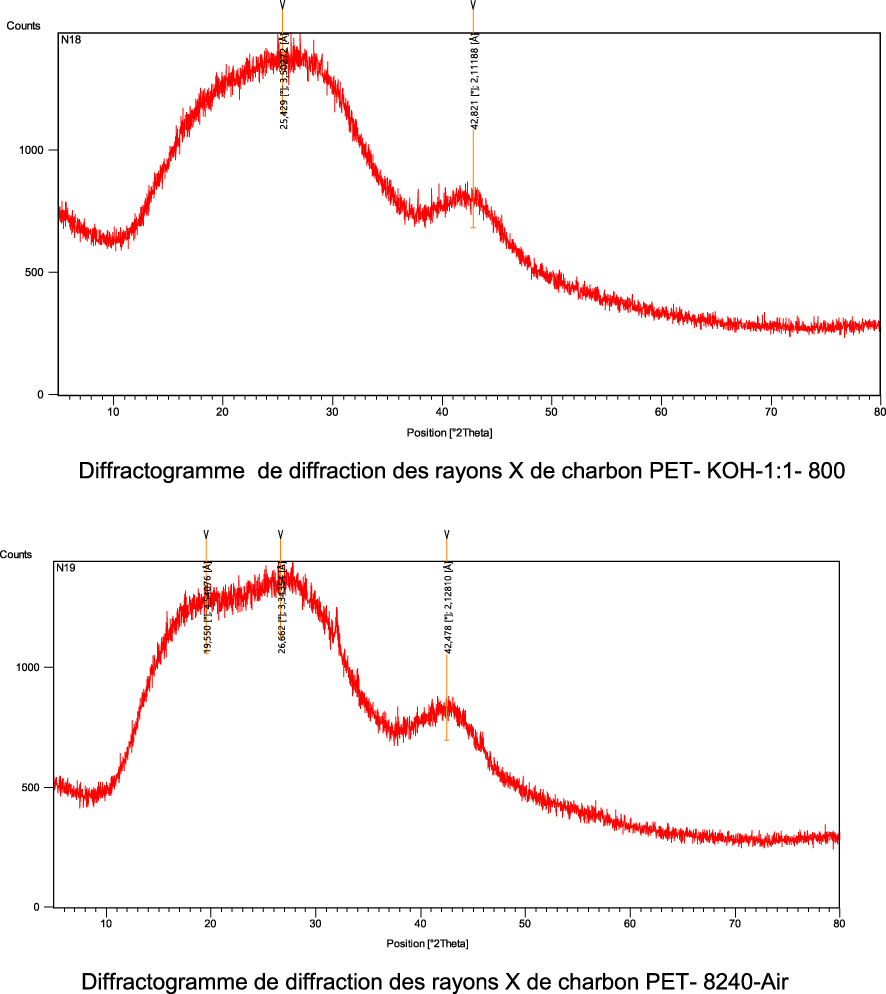
3.2. The use of the activated carbons to remove herbicides from the liquid phase
The efficiency of the ACs presenting the highest surface area and micro-pore volume in removing MCPA and 2,4-D present on the liquid phase was tested. The influence of pH, contact time and temperature on the herbicide removal was also studied.
3.2.1. MCPA and 2,4-D adsorption
Figure 6 shows the performance of the different ACs in removing MCPA and 2,4-D from the liquid phase. The latter reveals that 2,4-D maximum adsorption capacity varies from 30 mg⋅g−1 for PET-KOH-600 to 290 mg⋅g−1 for PET-KOH-800-1:1. However, the maximum adsorption capacity (Qmax) of MCPA ranges from 70 mg⋅g−1 for PET-8120-CO2 to 192 mg⋅g−1 for PET-KOH-1:1-800. The difference in the maximum adsorption capacities displayed by various ACs highlights the importance of their textural properties. In the presence of a well-developed porous volume with an average pore size accessible to the herbicides, a favourable pH of the solution can improve the performance of the ACs.
2,4-D and MCPA isotherms adsorption onto different prepared ACs.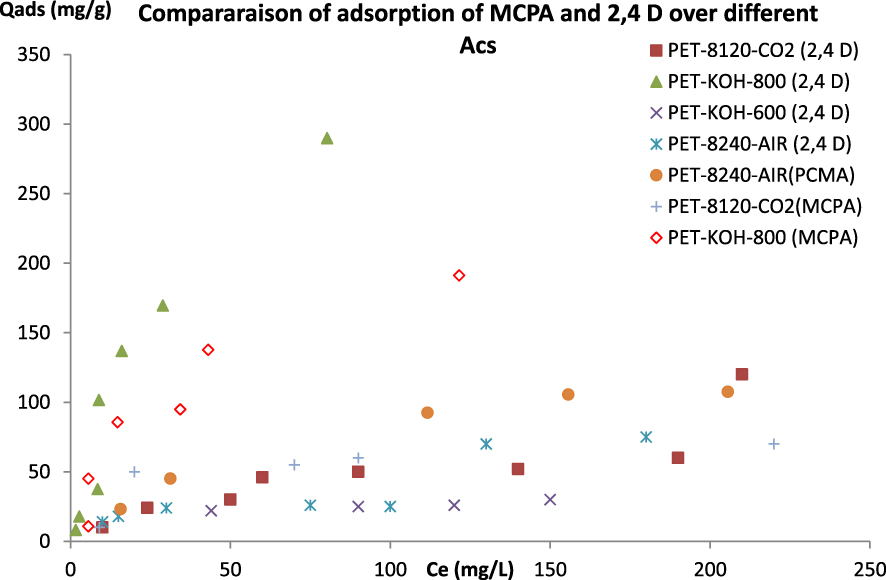
The comparison of the Qmax of PET-KOH-800-1:1 with some adsorbents cited in the literature is presented in Table 2. It is interesting to report that the ACs prepared from waste PET provided the best Qmax. It is also obvious that waste PET plastic could be a good precursor for the preparation of adsorbent to treat agriculture wastewater.
Comparison of the maximum adsorption capacity (Qmax) of 2,4-D and MCPA in ACs prepared during this work with data found in the literature
| Adsorbent | Herbicide | Experimental condition | Qmax (mg⋅g−1) | Ref. |
|---|---|---|---|---|
| PET-8120-CO2 | MCPA | Physical or chemical activation of waste PET, done at 1073 K | 48.8 | Our study |
| 2,4 D | 120 | |||
| PET-KOH-800-1:1 | MCPA | 192 | ||
| 2,4 D | 290 | |||
| PET8240 AIR | MCPA | 41 | ||
| 2,4 D | 75 | |||
| Polyaniline-Fe3O4 | 2,4D | Solvothermal method | 60.97 | [28 ] |
| Polypyrrole-Fe3O4 | 2,4D | 96.15 | ||
| Graphene oxide coated with porous iron oxide | 2,4D | Solvothermal process | 67.26 | [29] |
| Cotton plant ash | 2,4D | Thermal process | 0.64 | [30] |
| Cotton plant char | 2,4D | 3.93 | ||
| Activated charcoal decorated with Fe2O3 nanoparticles | 2,4D | Green synthesis | 255.10 | [31] |
| Nano-activated carbon derived from palm coir waste | 2,4D | Single-step carbonization-KOH activation approach | 50.25 | [32] |
| Corn cob biochar | 2,4D | 600 °C for 4 h + HF modification | 37.40 | [33] |
| Groundnut shell | 2,4D | Combustion | 0.87 | [34] |
| Groundnut shell biochar | 2,4D | Pyrolysis | 3.02 | |
| Groundnut shell AC | 2,4D | Chemical activation | 250 | |
| Carbonaceous materials C–C2Cl6 and C–C6Cl6 | 2,4D | Combustion of the mixtures containing hexachloroethane or hexa-chlorobenzene with sodium azide | 895 | [35] |
| Polymer-based activated carbon-polyvinyl alcohol | 2,4D | 55.9 | [36] | |
| Commercial granular activated carbon Filtersorb 300 (GAC F300) | 2,4D | Commercial | 181.82 | [37] |
| Iron doped graphitic carbon cotton nanostructures | 2,4D | Impregnation with a FeCl36H2O + microwave irradiation | 33 | [38] |
| Iron doped graphitic carbon filter paper nanostructures | 2,4D | Impregnation with a FeCl36H2O + microwave irradiation | 77 | |
| Activated carbons from wood composites | MCPA | Physical activation with carbon dioxide | 413 | [39] |
| Switchgrass biochar | MCPA | Fast pyrolysis switchgrass biochar | 50 | [40] |
| Organic polymer resin Lewatit VP OC 1163 | MCPA | Commercial | 92.55 | [41] |
3.2.2. Influence of the temperature on the efficiency of different ACs to remove MCPA and 2,4-D from the liquid phase
The influence of the temperature on 2,4-D and MCPA adsorption was evaluated. The amounts of herbicides adsorbed by each AC at different equilibrium concentrations are presented in Figure 7. It is clear that the increase in temperature had a slight influence on the efficiency of the ACs in removing 2,4-D. However, the adsorption of MCPA can be considered as an endothermic process. Jui et al. concluded that the adsorption of Swiss blue by Acacia nilotica was an endothermic process [42].
Temperature influence on the MCPA and 2,4-D adsorption on PET-KOH-1:1-800.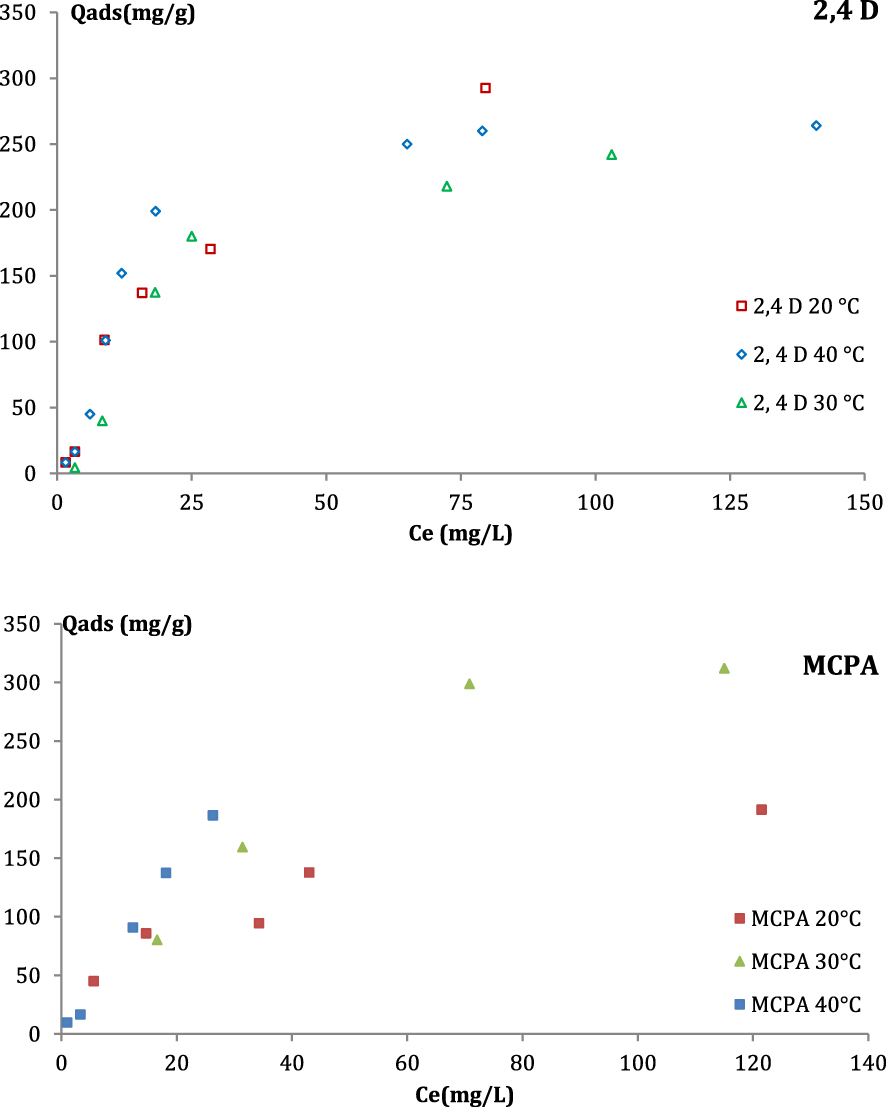
3.2.3. Influence of pH
To study the interaction between ACs and both herbicides when pH of the solution changes, it is necessary to compare the pHzpc of different adsorbents with the pKa of herbicides. The pHzpc is defined as the pH value where, in the liquid, the surface charge of the adsorbent is about zero. At a pH solution lower than pHzpc, the adsorbent surface is positively charged and at a pH solution greater than pHzpc, the AC surface has a net negative charge. The pHzpc value of PET-KOH-1:1-800 is equal to 8.34. The (pKa) of a chemical compound determines the degree of ionization of the molecule at different pH solutions.
For pH solution higher than pKa value, the compound exists predominantly in an anionic form. The pKa values of the MCPA and 2,4 D are 3.1 and 2.73, respectively. The adsorption trends of both herbicides on ACs, as a function of the pH solution, are similar, as presented in Figure 8. The latter reveals that the adsorption of MCPA and 2,4 D decreases rapidly in the pH region between 2–4. The highest adsorption capacity values are attained at pH almost equal to 2. At this value, at which the neutral form of the two herbicides is predominant, the surface charge of the AC is positive. At pH solution near 2, the interaction between the neutral forms of both herbicides and ACs are more favourable. The decrease in the maximum adsorption values at pH above 7 is due to electrostatic repulsion between the negatively-charged adsorbent surface (pH > pHzpc) and the anionic form of the herbicide molecules (pH > pKa).
Influence of pH on MCPA and 2,4 D adsorption onto PET-KOH-1:1-800.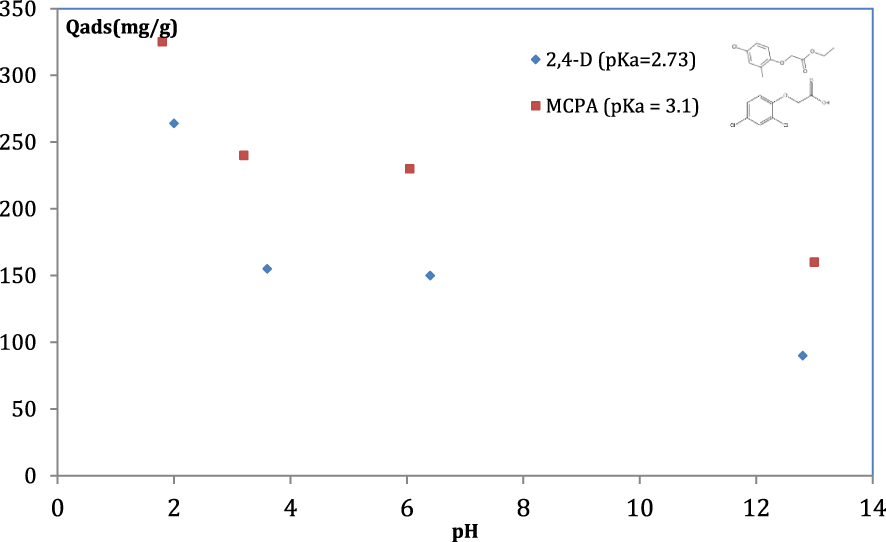
3.2.4. Kinetic study
The adsorption kinetics of MCPA and 2,4-D on PET-KOH-1:1-800 is presented in Figure 9. It is obvious that, in the first minutes of contact, the adsorption of both herbicides is rapid and the equilibrium is reached after approximately 7 h. It is also obvious that the adsorption equilibrium is achieved for all considered concentrations after a contact time of 24 h between 2,4-D and the adsorbent. In the same experimental conditions, the adsorption capacity of PET-KOH-800-1:1 is lower for 2,4-D compared to MCPA, which highlights the slower adsorption kinetics for 2,4-D at 298 K. The MCPA isotherm shape suggests a monolayer coating of the activated carbon surfaces.
Kinetic study of MCPA adsorption, with different initial concentrations, on PET-KOH-1:1-800 at pH = 6.5.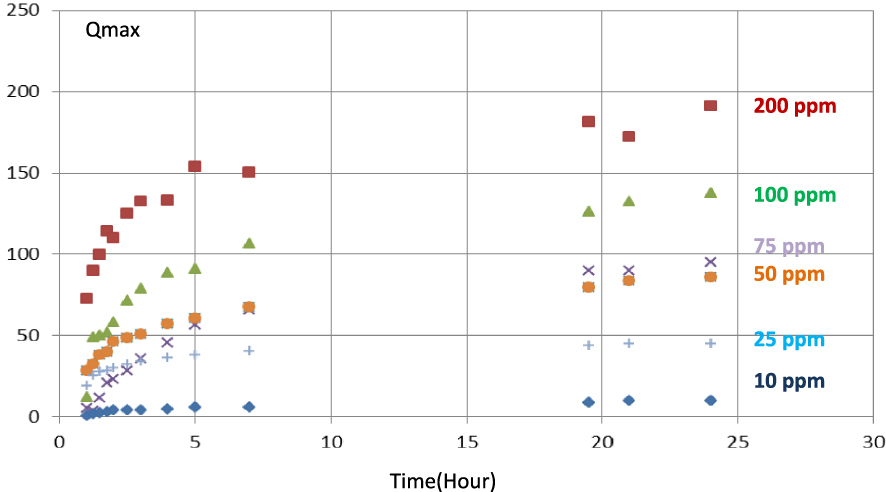
Nevertheless, the high removal of both herbicides, mainly from diluted solutions, in a short period, presented by this AC allows removing herbicides from the liquid phase more economical. On the other hand, the optimisation of the nitrogen flow, activation temperature, and activation time during the ACs production improves the control of the textural characteristics of the ACs produced. As some of these parameters can still be adjusted, ACs more efficient in removing herbicides from the liquid phase may be obtained.
Kinetic modeling
Herbicides adsorption onto activated carbons could be modelled by the first-order, second-order and Elovich models.
Pseudo first order kinetic model
The integrated form of the pseudo first order kinetic model is expressed by the following equation:
| (3) |
The pseudo second-order model
The integrated pseudo-second order model is represented by the following equation:
| (4) |
Elovich model
The integrated form of this model is expressed using the following equation:
| (5) |
Figure 10 presents the fitting of the results provided by the kinetic models (pseudo first-order and second-order model and Elovich model) while Table 3 resumes the kinetic parameters for the different models. For the pseudo first-order model, the values of qe obtained experimentally are not in agreement with those calculated, which shows the inapplicability of the model in herbicides adsorption ACs. On the other hand, the pseudo second-order model fits well with high R2. The resulting qe values are closer to the calculated qe than those obtained by the pseudo-first order model. It can be also noticed that the Elovich model is efficiently employed to describe chemisorption on highly heterogeneous adsorbents. R2 coefficients of Elovich model are relatively lower, compared to those of the second order model, but they are better than those provided by the first-order model. In addition, it can be seen that the values of 𝛼 and 𝛽 vary as a function of the initial MPCA and 2,4 D herbicide concentration. In fact, with the increase in initial herbicide concentration from 10 to 200 mg⋅L−1, 𝛼 rises from 0.08 to 25.95 for MCPA, and from 1.09 to 8.03 for 2,4 D. On the other hand, 𝛽 decreases from 0.38 to 0.029 for MCPA, and from 0.156 to 0.020 for 2,4 D. Thus, 𝛽 minimizes with the increase of the herbicide initial concentrations and 𝛼. The same observations were reported in the literature [39, 40]. This trend in 𝛼 and 𝛽 reflects the enhancement of the reaction rate with the increase in initial concentration [41].
Kinetic modeling of MCPA and 2,4-D onto KOH-800.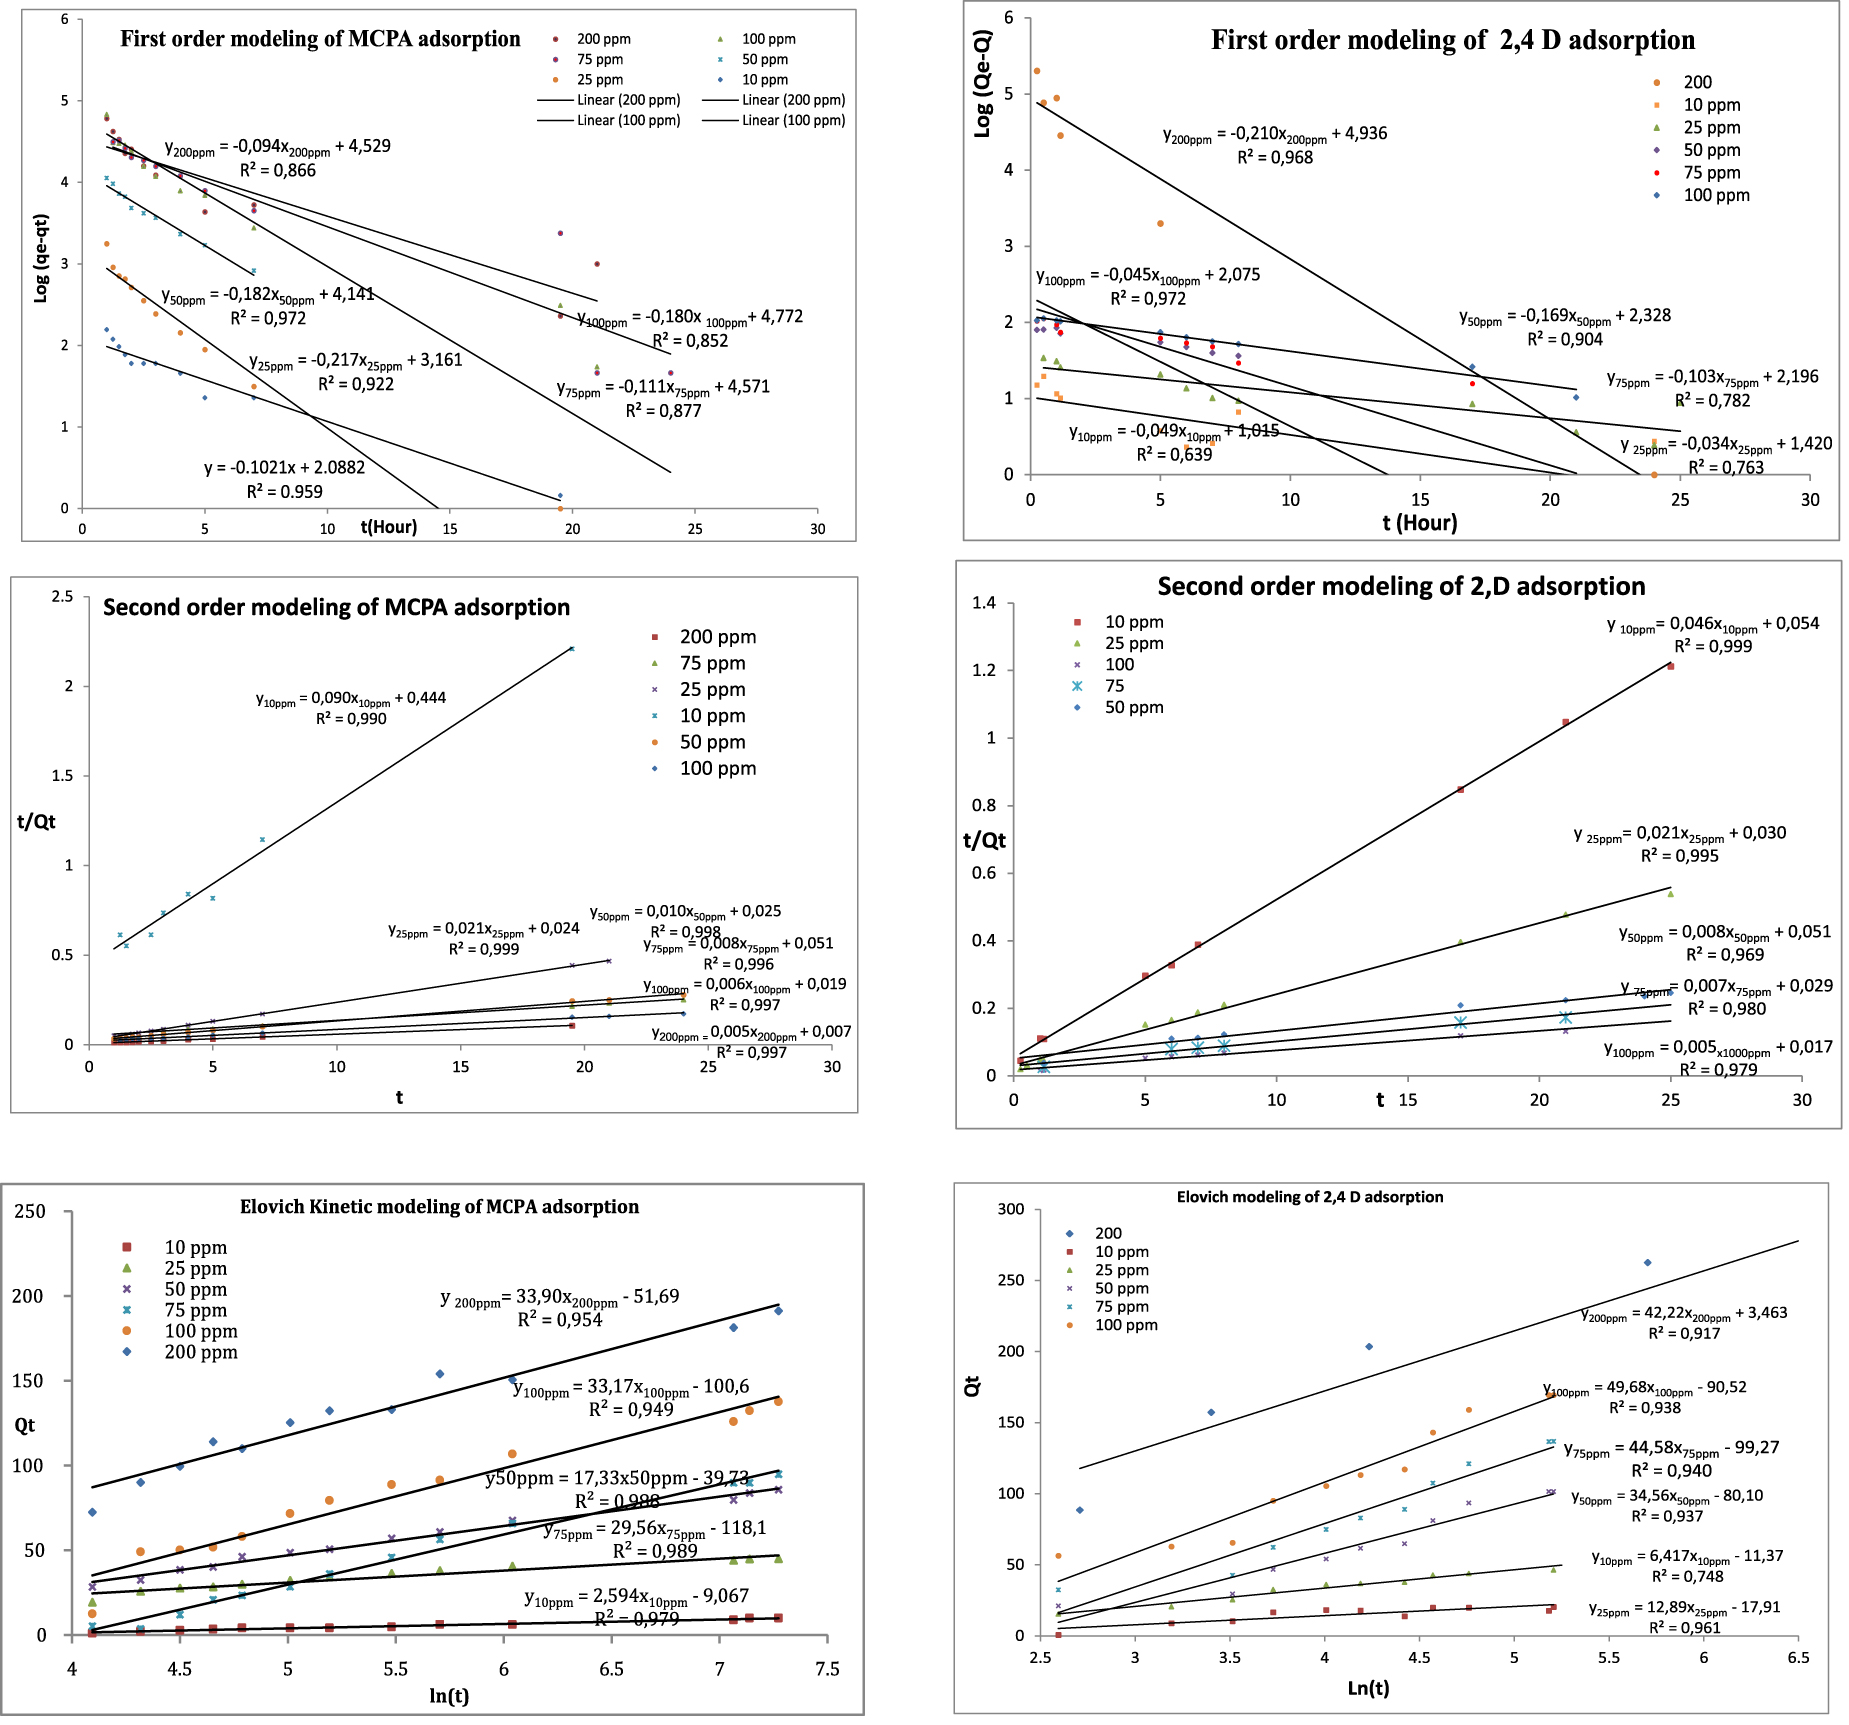
Comparison between the experimental and calculated qe values of first, second-order adsorption kinetics and at different initial concentrations (10–200 ppm) of 2,4-D and MCPA
| Pollutant | Initial concentration (ppm) | k1 (h−1) | First-order kinetic model | Second-order kinetic model | Elovich model | ||||||||
|---|---|---|---|---|---|---|---|---|---|---|---|---|---|
| qe (cal) | R2 | qe (cal) | qe (exp) | k2 (h/mg) | R2 | 𝛼 | 𝛽 | R2 | |||||
| MCPA | 10 | 0.1 | 8 | 0.96 | 11.11 | 10 | 0.02 | 0.990 | 0.08 | 0.38 | 0.98 | ||
| 25 | 0.23 | 23.6 | 0.92 | 47.62 | 45 | 0.018 | 0.999 | 1.96 | 0.14 | 0.93 | |||
| 50 | 0.18 | 65.8 | 0.97 | 100 | 86 | 0.004 | 0.998 | 10.28 | 0.058 | 0.99 | |||
| 75 | 0.11 | 96.5 | 0.88 | 125 | 95 | 0.001 | 0.996 | 21.76 | 0.034 | 0.99 | |||
| 100 | 0.18 | 118 | 0.85 | 166.7 | 138 | 0.002 | 0.997 | 25.24 | 0.030 | 0.95 | |||
| 200 | 0.1 | 99.5 | 0.87 | 200 | 192 | 0.003 | 0.997 | 25.95 | 0.029 | 0.95 | |||
| 2,4-D | 10 | 0.05 | 2.9 | 0.64 | 21.37 | 21.74 | 0.04 | 0.999 | 1.09 | 0.156 | 0.75 | ||
| 25 | 0.034 | 4.14 | 0.76 | 47.39 | 47.62 | 0.015 | 0.999 | 3.21 | 0.077 | 0.75 | |||
| 50 | 0.17 | 10.3 | 0.9 | 123.46 | 125 | 0.0013 | 0.97 | 3.41 | 0.029 | 0.96 | |||
| 75 | 0.1 | 9.02 | 0.78 | 138.89 | 142 | 0.0017 | 0.98 | 4.81 | 0.0224 | 0.94 | |||
| 100 | 0.045 | 8.17 | 0.97 | 172.41 | 200 | 0.0015 | 0.999 | 8.03 | 0.0201 | 0.94 | |||
| 200 | 0.21 | 134.3 | 0.97 | 289 | 333 | 0.0055 | 0.999 | 7.7 | 0.02 | 0.92 | |||
3.2.5. MCPA and 2,4-D adsorption isotherms
MCPA and 2,4-D adsorption isotherms are presented in Figure 11. The isotherms were analysed by applying the Langmuir and Freundlich equations used in several research works [10, 43, 28]. The Langmuir equation was essentially applied to isotherms obtained on homogeneous solids, where the adsorption was limited to the monolayer. However, the Freundlich equation was mainly employed to describe the adsorption on heterogeneous adsorbents where the adsorption is non-linear. By fitting Langmuir and Freundlich equations to the experimental data, the following parameters were determined: nmL monolayer capacity, KL Langmuir constant, KF Freundlich constant and nF Freundlich exponent. As some produced ACs had a less developed porous structure, the adsorption isotherms of MCPA and 2,4-D were more irregular, due to the constraints of the herbicides to access the interior of the pores, and the fit to the Langmuir and Freundlich equations were more difficult to obtain. In most of the MCPA-adsorbent systems, the adjustment to the Langmuir equation was normally better. The MCPA isotherm obtained on PET-KOH-800-1:1 after a contact time of 24 h shows that the parameters provided by the Langmuir fit were nmL = 232.6 mg⋅g−1 and KL = 0.049 dm3⋅mol−1. However, those given by Freundlich fit were nF = 1.74 and and the maximum adsorption capacity inferred directly from the isotherm was nmax = 196.9 mg⋅g−1. On the other hand, the 2,4-D isotherm obtained on PET-KOH-800-1:1 after a contact time of 24 h demonstrates that the parameters provided by the Langmuir fit were nmL = 192.3 mg⋅g−1 and KL = 0.26 dm3⋅mol−1. However, those given by Freundlich fit were nF = 3.38 and and the maximum adsorption capacity obtained directly from the isotherm was nmax = 267.1 mg⋅g−1.
Adsorption isotherms of MCPA (left) and 2,4-D (right) were obtained after different equilibrium times.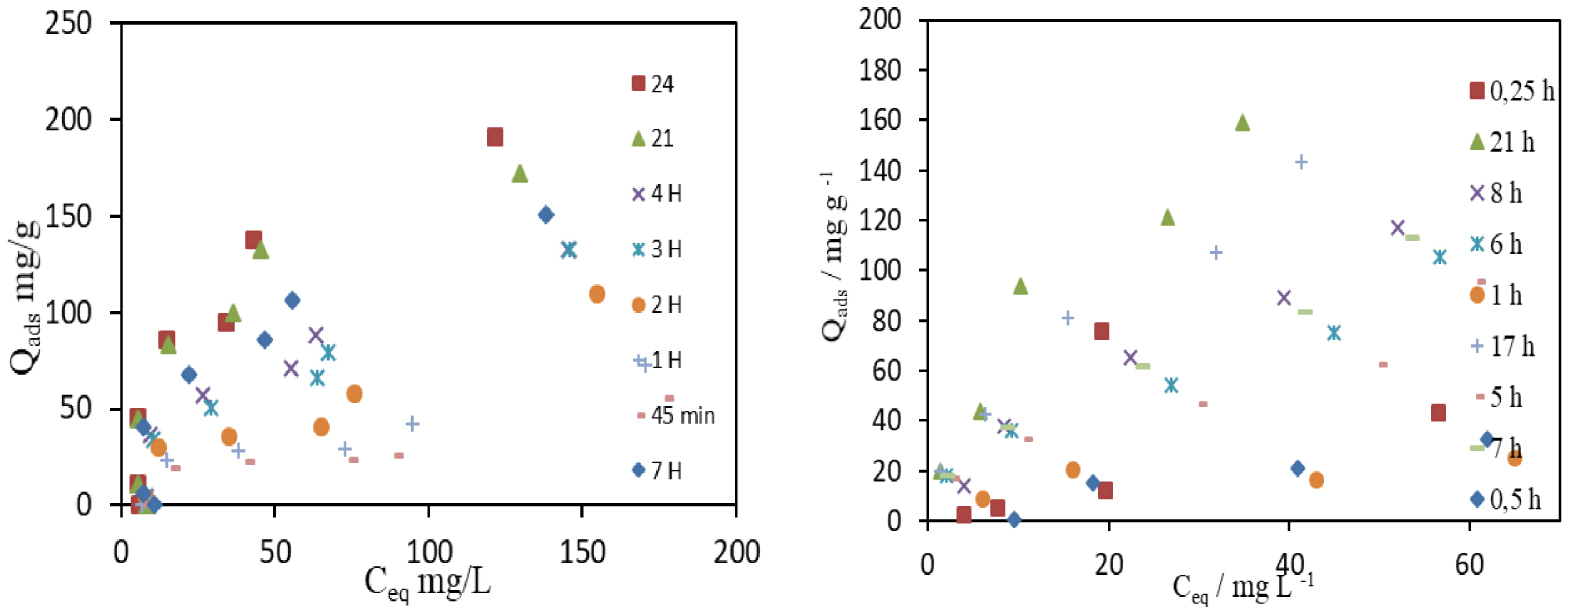
On the isotherms presented in Figure 10, the adsorbent does not attain its maximum adsorption capacity. The nL and KF values are very close, but lower than the maximum adsorbed amount (nmax), obtained experimentally. PET-KOH-800-1:1 has an apparent maximum adsorption capacity similar to the values obtained by ACs commonly used in wastewater treatments. Thus, the achieved maximum adsorption capacity is higher than the value indicated in Table 2 since a well-defined step has not yet been obtained.
3.3. Application of the ACs as a solid fuel
3.3.1. Ultimate analysis of the ACs
Char and different ACs samples were chemically characterised by elemental analysis and the C, H, S, N and O percentages were determined. The two major elements identified directly were carbon and hydrogen. The N was present in trace amounts and the S was not quantified, as presented in Table 4. The latter shows that C percentage ranges from 79.8 to 84.4% and the hydrogen varies between 1.0 to 3.0%. Using physical activation, the carbon increment can be explained by the increase in activation time and the appearance of C=N and C–O functional groups at the surface of the carbonized sample. These groups are useful, especially in catalysis and adsorption applications.
ACs elemental composition
| Samples | C/% | H/% | N/% | O/%∗ | C/% (EDX) | O/% (EDX) | pHzpc |
|---|---|---|---|---|---|---|---|
| Carbonized | 87.9 ± 2.5 | 2.4 ± 0.1 | 0.02 | 9.68 | 87.9 ± 1.8 | 12.1 ± 1.8 | — |
| PET-860-CO2 | 79.8 ± 0.9 | 1.3 ± 0.13 | 0.01 | 18.9 | 63.1 ± 3.7 | 30.6 ± 3.7 | 9.13 |
| PET-8120-CO2 | 79.9 ± 3.9 | 1.3 ± 0.4 | — | 18.8 | 58.1 ± 5.2 | 35.9 ± 2.9 | 8.81 |
| PET-815-Air | 80.8 ± 1.9 | 1.3 ± 0.03 | — | 17.9 | 64.7 ± 2.3 | 25.6 ± 3.1 | 8.36 |
| PET-8240-Air | 83.4 ± 1.1 | 1.0 ± 0.04 | — | 15.6 | 61.7 ± 12.8 | 30.9 ± 7.8 | 9.28 |
| PET-KOH-450-1:1 | 80.9 ± 2.5 | 3.0 ± 0.1 | — | 16.1 | 69.7 ± 15.5 | 27.1 ± 12.9 | 7.77 |
| PET-KOH-600-1:1 | 84.4 ± 1.4 | 2.8 ± 0.3 | — | 12.8 | 74.4 ± 5.7 | 24.2 ± 5.7 | 8.17 |
| PET-KOH-800-1:1 | 82.9 ± 1.9 | 2.0 ± 0.4 | — | 15.1 | 79.9 ± 3.7 | 19.2 ± 3.5 | 8.34 |
∗ The O2 percentage was determined by difference to 100%.
The carbon and oxygen contents at the char and ACs external surface were also evaluated by EDX. For the char sample, only a slight difference was observed between the EDX and EA results. However, EDX provided significantly lower carbon percentage and higher oxygen percentage, compared to EA. This difference was clearer for ACs prepared by physical activation. It is well known that the analysis performed through elemental analyzers is based on the combustion of the sample and the analysis of the corresponding evolved gas products [44]. For example, carbon, hydrogen, nitrogen, and sulfur elements release CO2, H2O, NOx and SO2, respectively.
It is worth noting that the elemental analysis conducted in EXD technique is limited to the detection of the functional groups at the surface of the samples. Thus, the results obtained by applying EDX and EA prove that the functional groups containing O were mainly localised at the external surfaces and were introduced during the activation process. More evidence about the nature of these groups can be drawn from FTIR analysis.
The preparation of the ACs by chemical activation with KOH demonstrates that, as the activation temperature increased, the difference between the carbon and oxygen content, on the external surface area and AC matrix, was less observed. This result demonstrates the remarkable stability of the ACs prepared by chemical activation at higher temperatures, which agrees with the findings of Borghei et al. [17] and Chen et al. [18].
3.3.2. The Van Krevelen graph and energy content
In general, the Van Krevelen graph is used to illustrate the elemental composition results and cross-plot the H:C atomic ratios as a function of the O:C atomic ratios of fuels [45]. A lower ratio of H/C and O/C indicates the improvement in the energy potential of fuels since low H/C and O/C ratios generate less CO2, water vapor and smoke. The molar ratios of H/C and O/C obtained for char and ACs are presented in Figure 12. It is well known that high energy-content fuels, such as anthracite and bituminous coal, show low H/C and O/C molar ratios due to the high degree of coalification. On the other hand, low-rank fuels, such as biomass, show the opposite H/C and O/C ratio trend [46]. It is obvious that carbonaceous materials with lower ratio of H/C and O/C are considered as promising solid fuels [47].
Van-Krevelen diagram of char and ACs.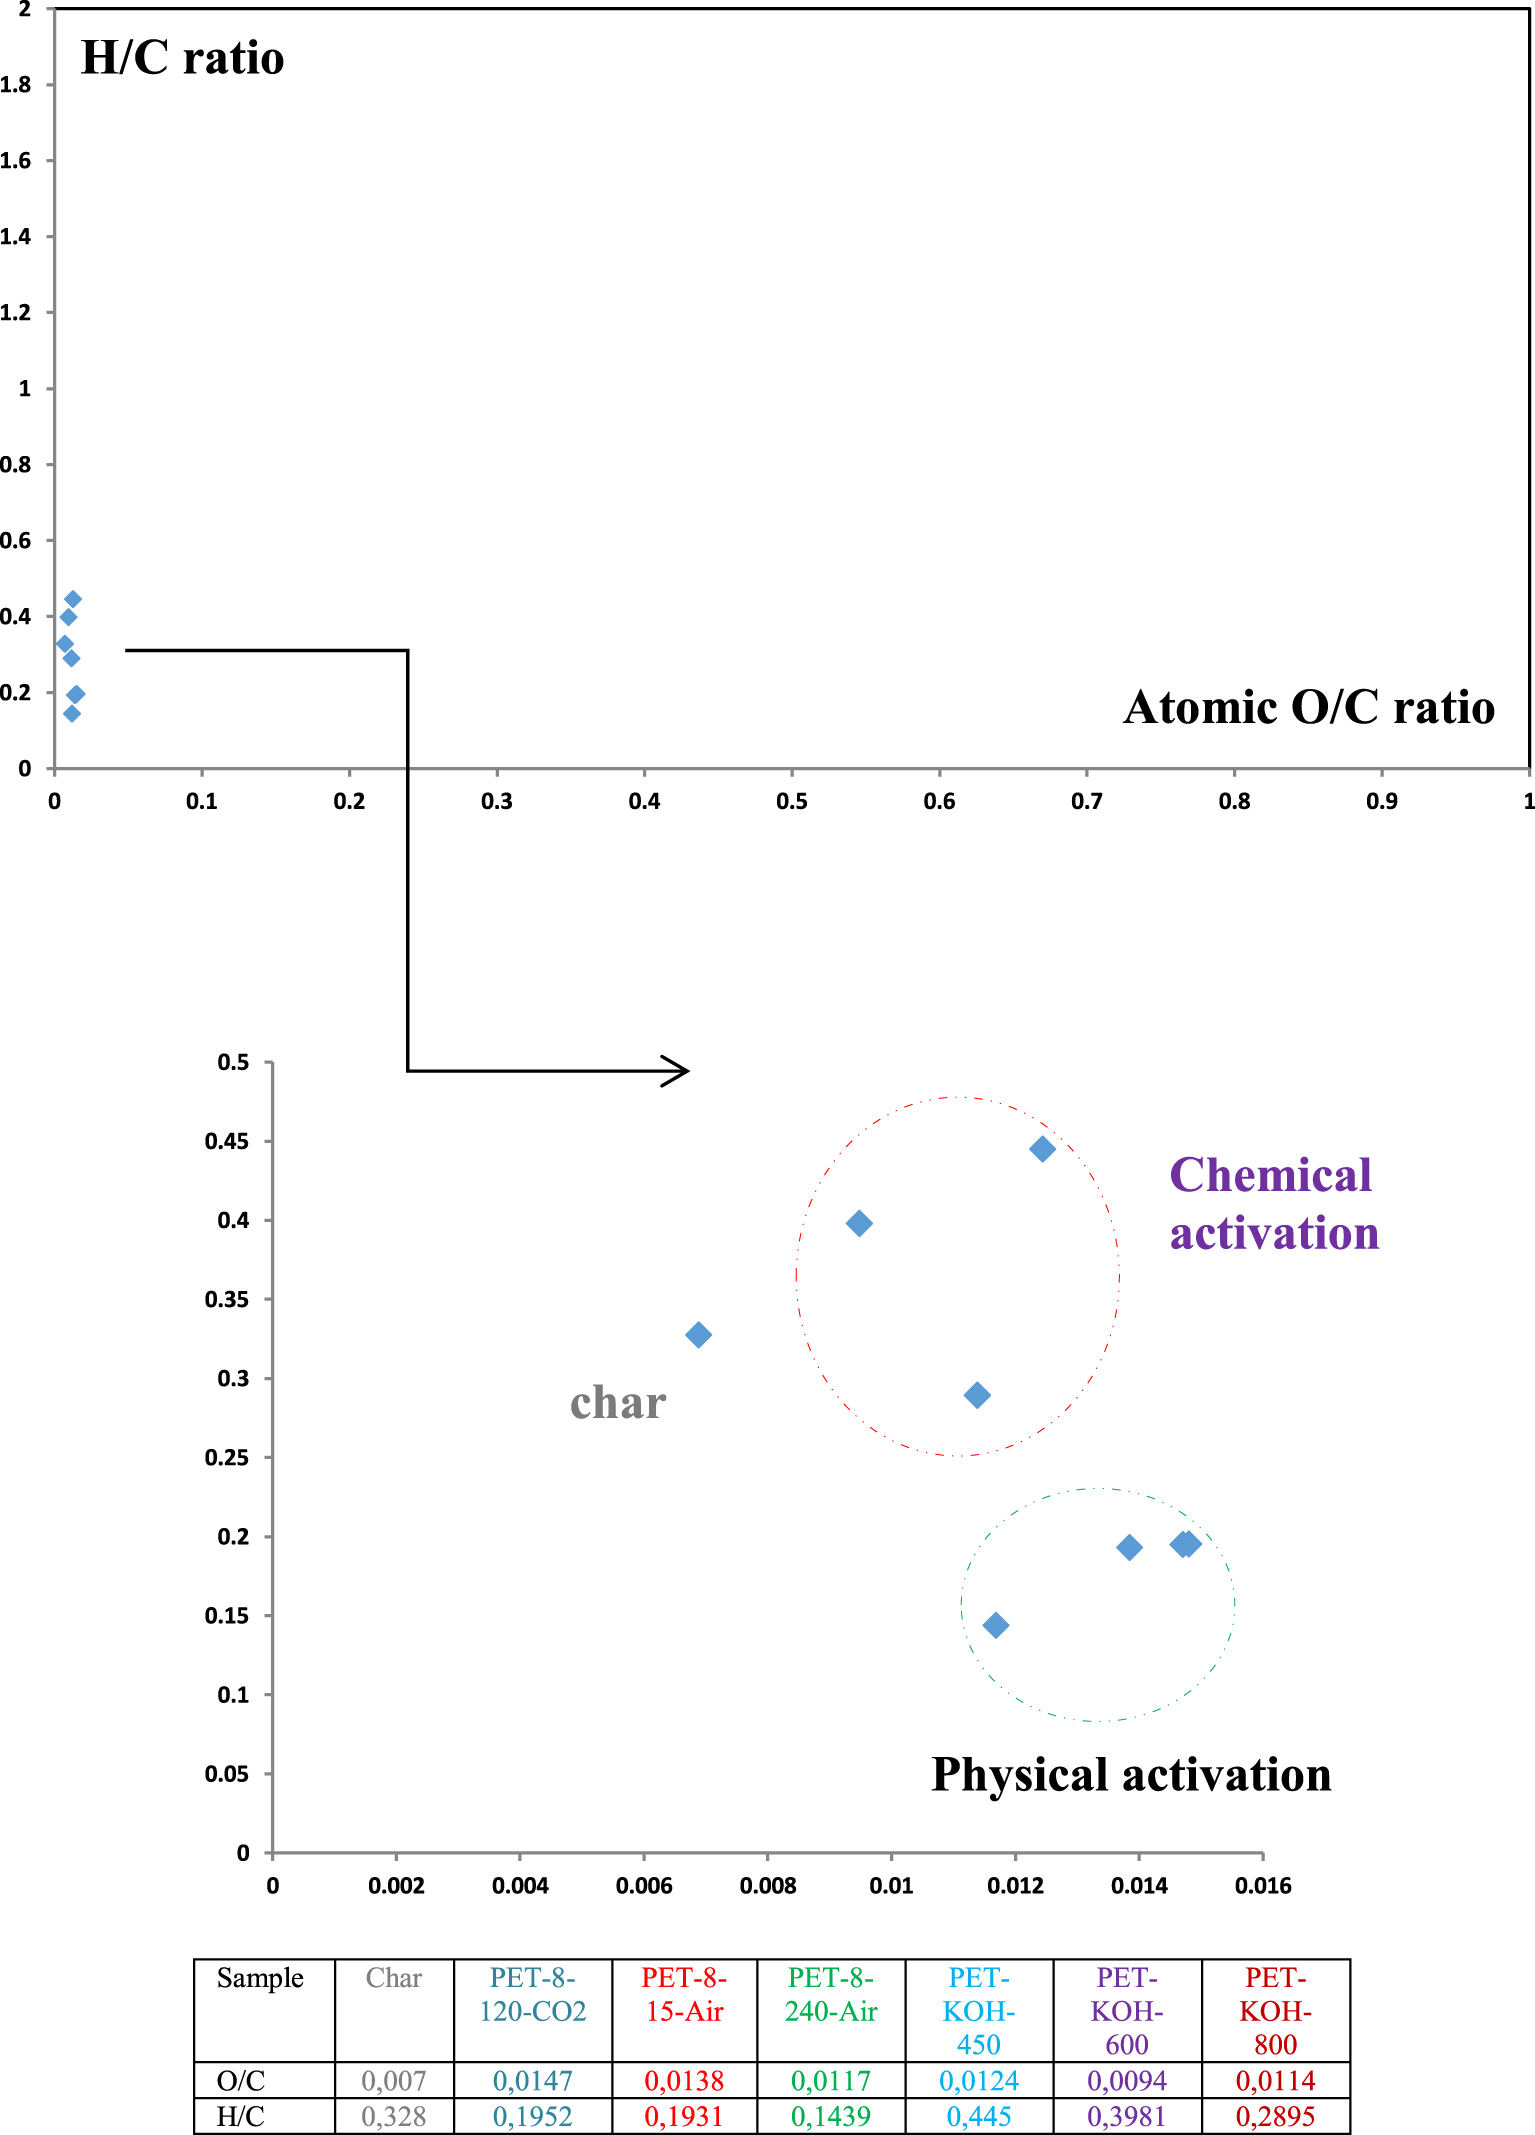
3.3.3. Energy content and higher heating values
The high heating values (HHV) of the char, produced ACs and conventional solid fuels are included in Figure 12 and their comparison is presented in Figure 13. The HHV obtained by different ACs are 11.89, 10.05, 10.06, 10.18, 10.32, 11.4 and 10.95 MJ/kg for char, PET-860-CO2, PET-8120-CO2, PET-815-Air, PET-8240-Air, PET-KOH-450, PET-KOH-600 and PET-KOH-800, respectively. The results indicate that various prepared carbonaceous materials have comparable energy content and are in the same range as the conventional solid fuels, as shown in Figure 13.
HHV comparison with different conventional solid fuels.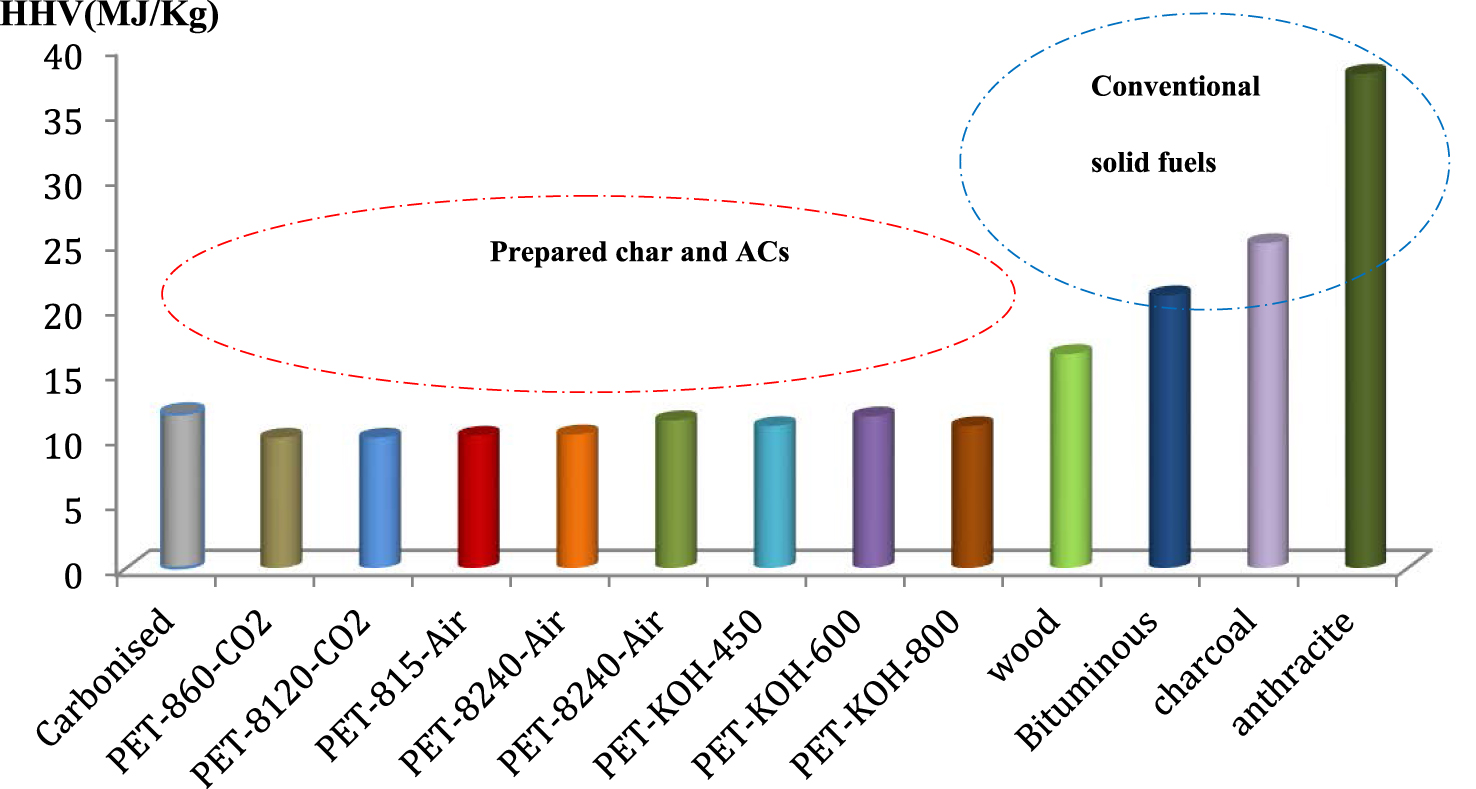
4. Conclusion
The present research is a contribution to the circular economy. It highlights the importance of common urban waste valorization by converting PET waste into ACs used as solid fuel or as adsorbents to remove herbicides.
The activated carbons, produced in a lab-scale furnace by physical activation with CO2 or water vapor or by chemical activation with KOH, were successfully used to remove herbicides from liquid effluents. The ACs produced by physical or chemical activation showed interesting porous development. However, the chemical activation produced ACs with higher apparent surface area and pore volume. Due to its important textural and chemical characteristics, the PET-KOH-1:1-800 was employed as an adsorbent to remove MCPA and 2,4-D from the liquid phase. For PET-KOH-1:1-800, the herbicides adsorption was predominantly controlled by the total porous volume and the apparent surface area. PET-KOH-1:1-800 presented at 298 K a maximum adsorption capacity of 192 mg⋅g−1 and 290 for MCPA and 2,4-D, respectively. It must be noted that the adsorption of both herbicides fits well the pseudo second order kinetic.
Van Krevelen diagram revealed that the H/C and O/C molar ratios of char and ACs were similar to those of sub-bituminous and bituminous materials. From this study, it can be concluded that the use of PET plastic as raw material for the ACs production has ecological and economic benefits. This material can be used in the future for the treatment of liquid effluents or as solid fuels instead of biomass.
Conflicts of interest
Authors have no conflict of interest to declare.
Acknowledgements
The authors gratefully acknowledge the Tunisian Ministry of Higher Education and Scientific Research for funding this research under a scholarship for an internship and to the Fundação para a Ciência e a Tecnologia (FCT, Portugal) national funds – (PEst-OE/QUI/UI0619/2014).