


 CC-BY 4.0
1. Introduction
Butadiene-1,3 (BD) is an important product in petrochemical synthesis. It is used as a monomer to obtain synthetic rubber, ABS, MBS and other types of plastics [1]. The world production capacity of BD exceeded 17 million tons in 2020, with a growth of about 5% annually) [2, 3]. Currently, the main industrial method for BD production is pyrolysis of naphtha to ethylene. BD is obtained as a by-product with a low yield (about 4–5%) [3, 4, 5, 6]. The existing capacities for BD production by pyrolysis of naphtha cannot meet the growing demand of consumers. This leads to a shortage of BD and the search for alternative technologies for its synthesis [3, 7]. At the same time, the production of bioethanol has been actively developing in the world in recent years. More than 120 billion liters of bioethanol were produced in 2021, and stable growth is projected at 10–12% per year over the next decade [8, 9, 10]. These two factors are the reason that the ethanol to butadiene (ETB) process has become relevant and in demand again. In addition, it is important to consider current environmental initiatives, such as the introduction of carbon footprint taxes, which will steadily increase the cost of pyrolysis-derived BD.
These circumstances led to an increased interest of scientific groups in the processes of Lebedev and Ostromyslensky [3, 4]. Lebedev process is the one-step process and refers to the direct gas-phase conversion of ethanol to butadiene over polyfunctional catalysts. The main reaction proceeds in 5 stages (scheme 1) [11]:
- dehydrogenation of ethanol to acetaldehyde (AA);
- aldol condensation of two AA molecules to form 3-hydroxybutanal (acetaldol);
- dehydration of acetaldol to crotonaldehyde (CA);
- Meerwein–Ponndorf–Verley reaction between CA and EtOH molecules to form crotyl alcohol;
- dehydration of crotyl alcohol to BD.
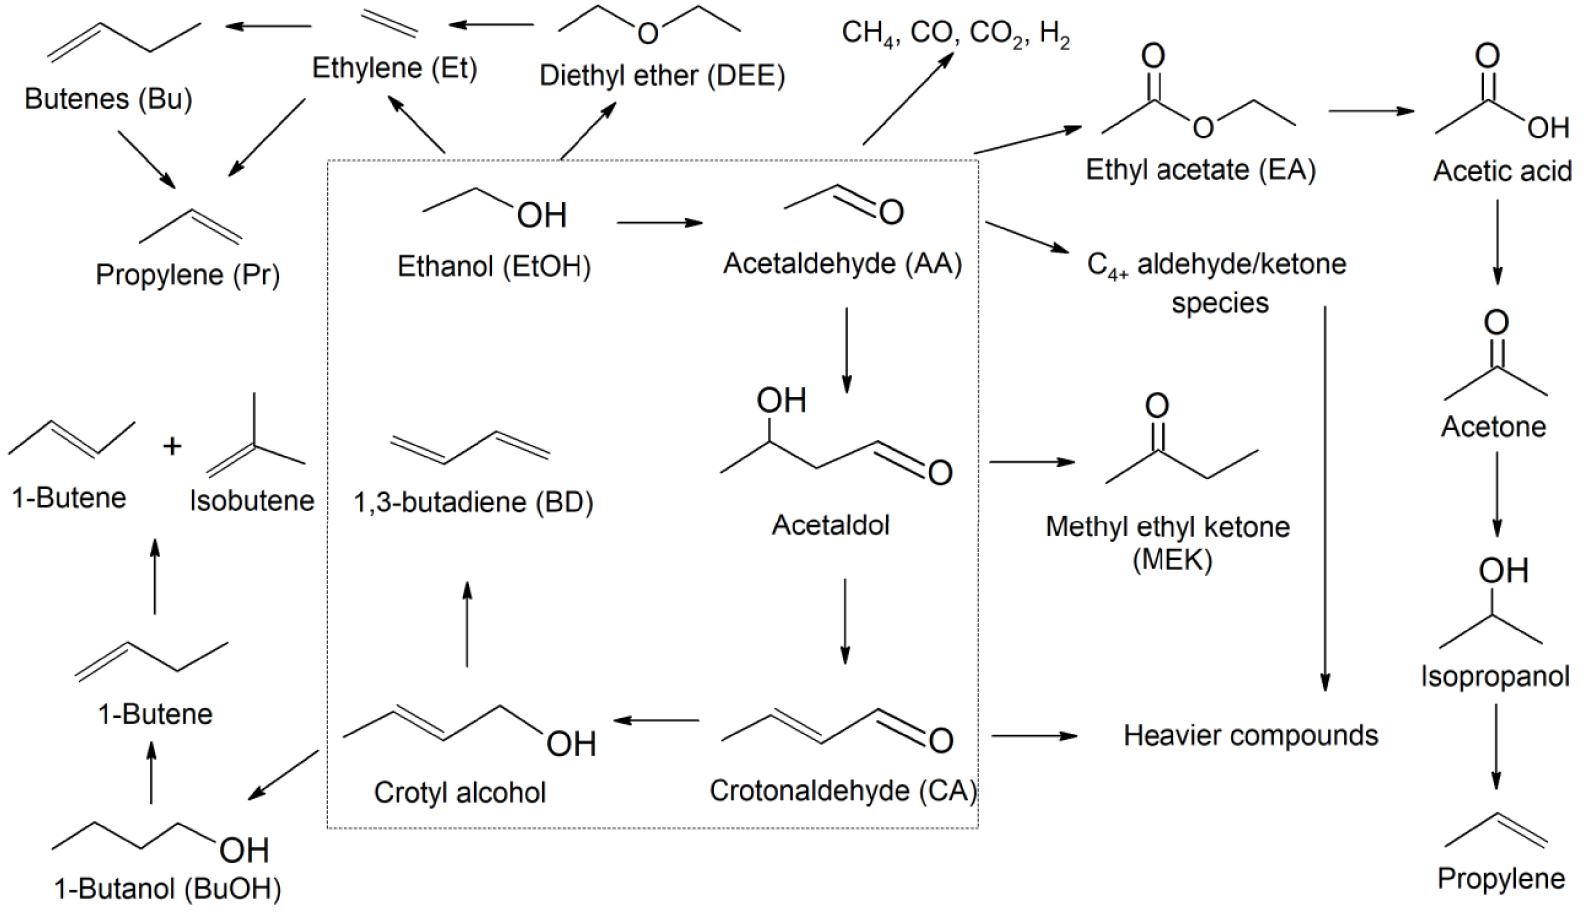
Reaction scheme of the Lebedev process.
The Ostromyslensky process is a two-stage process and the production of acetaldehyde from ethanol occurs separately. After hydrogen separation, ethanol is added to the reaction products and the resulting mixture enters the second reactor to form BD. The Lebedev process also uses the addition of the resulting acetaldehyde to increase the BD yield by recycling. But if in a two-stage process the ratio of EtOH:AA is 3:1, then in a one-stage process the amount of AA depends on the catalyst used in each individual case. The development of new polyfunctional effective catalysts for the Lebedev reaction is an extremely difficult task due to its complex chemistry.
Some stages of this mechanism take place at the redox sites of the catalyst, while other steps are at the acid-base sites. For this reason, the catalyst must be composed of several components. The catalyst bifunctionality and difficulty in controlling the selectivity of the process leads to the formation of undesirable reaction products (Et, Bu and others).
The review by Pomalaza et al. [3] contains a lot of data on new catalysts, but it also reports many unresolved issues. They relate to the economic competitiveness of the Lebedev process compared to the joint production of BD with ethylene. For example, there are practically no data on the rate of the catalyst deactivation, their performance over a full cycle of operation, methods of regeneration and the activity of catalysts in subsequent cycles. Another important issue is the composition of the feedstock, namely the concentration of H2O, AA and other intermediate products. These components affect the activity and selectivity of the catalyst, the rate of its deactivation and, accordingly, the operating time.
Experiments to study the activity of catalysts were often carried out under conditions that are not used in industry for the ETB process. In particular, the authors of [12, 13, 14, 15, 16, 17, 18, 19, 20] used multiple dilution of ethanol with an inert gas flow and small catalyst loads. This method allows one to study the activity of the catalyst, chemistry and kinetic parameters, but it does not give an idea of the catalyst’s operating time under the conditions of a real industrial process. The formation of a significant amount of particles-precursors of carbon deposits does not occur at low ethanol feeds. As a result, the samples studied in this mode are quite stable in laboratory studies, but are limited in their use as industrial catalysts.
Catalyst cost and availability are important factors in terms of process economics. The use of large quantities of expensive or hard-to-reach materials [14, 15, 16, 17, 21] with a limited service life leads to an increase in the cost of BD. It is also necessary to isolate valuable components from the spent catalyst before disposal.
In terms of availability and cost, the oxide systems Zn–Zr, La–Zn–Zr, Cu–Zr, Cu–Zn supported on silica gel are quite promising catalysts [18, 19, 20]. The yield of BD is up to 52.5% in their presence [20]. However, there are some uncertainties in these works and it does not allow us to evaluate the possibility of using these catalysts in industry. These include multiple dilutions of the feedstock with a carrier gas, low catalyst load, and often a lack of understanding of the moment of fixing the process parameters over time. The last uncertainty is very important, because many catalysts with good performance in the first hour of operation are quickly deactivated and cease to show good results. In addition, silica gel was used in the form of a powder, and the resulting catalyst was not shaped.
In this study, the prospects of using catalytic systems with Zn, Zr, La, and Cu oxides supported on granular SiO2 for the Lebedev reaction were determined. The parameters for ETB process using ethanol, acetaldehyde and water as feedstock without any additional inert diluents were also determined. The stability of the optimal catalyst was studied. Unlike other works, the process conditions are close to those used in the industry for a real evaluation of the catalyst performance.
2. Experimental
2.1. Materials
For the synthesis of catalysts, ZrO(NO3)2⋅2H2O (99%, Merck SA), Zn(NO3)2⋅6H2O (98%, Merck SA), La(NO3)3⋅6H2O (99,99%, Merck SA), and Cu(NO3)2⋅3H2O (99%, Merck SA) were used as precursors. Granular industrial silica gel was used as a carrier (KSKG, Salavat Catalyst Plant). The granule size was 4–6 mm. Ethanol (96%, Rosspirtprom), acetaldehyde (99,5%, Merck SA) and distilled water were used during the experiments. All reagents were used without additional purification. The initial and added amount of water in ethanol was taken into account in all calculations.
2.2. Catalyst preparation
Synthesis of catalysts was carried out by impregnation according to moisture capacity. Before impregnation, silica gel (SiO2) was calcined at 500 °C for 12 h, then it was cooled to room temperature, and impregnated with the calculated amount of precursor salts in water. After 12 h, the sample was dried at 200 °C for 2 h, and then calcined at 500 °C for 5 h.
2.3. Catalyst testing
100 cm3 of the catalyst sample after calcination was loaded into a glass reactor with a diameter of 40 mm and a height of 400 mm, which has a thermocouple sleeve along the entire height of the catalytic layer. The remaining space inside the reactor was filled with inert packing glass rings. The reactor was heated using a Nabertherm B180 electric furnace. The temperature regime was reached in a stream of nitrogen. Ethanol or its mixture with water or acetaldehyde was cooled in a vessel using a cryostat with a heat carrier temperature of −20 °C. The feedstock was fed into the evaporator using a Heidolph PD 5201 pump. The superheater was placed between the reactor and the evaporator to match the temperature of the stream to the desired temperature of the catalytic layer. The reaction products were cooled in a condensing system with a circulating heat carrier at a temperature of −20 °C. Liquid products were weighed and analyzed by gas chromatography on a Chromatek Crystal 2000 using a 2 m Porapak Q column and a TCD. The gas flow rate was recorded using a RITTER TG05/7 counter. Hydrocarbon gases were analyzed by gas chromatography on a Metachrom CrystalLux 4000M using a 50 m Al2O3/KCl-Plot column and a FID. Hydrogen, CO and CO2 were analyzed using a 3 m NaX column and a TCD. Catalysts were regenerated in the same reactor by feeding 2% O2 by volume in N2 flow. The regeneration temperature was 400–500 °C.
Ethanol conversion (XEtOH), product selectivity (Si), yields (Yi) and butadiene productivity of the catalyst (PBD) were calculated as follows:
2.4. Catalyst characterization
The bulk density of the samples was determined according to [22]. The nitrogen physisorption isotherms were obtained using ASAP-2020. Specific area was determined by BET technique while the pore volume was determined by the t-plot method. The elemental compositions were identified by the XRF analysis (ARL Perform’x Sequential XRF with 2.5 kW power). The phase composition was determined by XRD (Rigaku Rotaflex RU-200, CuK𝛼 radiation). The acid properties were investigated with the TPD-NH3 method using USGA-101 equipped with a TCD; the samples were placed into a quartz reactor, heated under He flow to 500 °C, calcined at this temperature for 1 h and finally cooled to 60 °C. Ammonia adsorption was carried out using a dry NH3∕N2 gas mixture (1/9) for 15 min and then, physically adsorbed NH3 was removed at 100 °C in a He flow for 1 h, after which the temperature in the reactor was linearly increased to 600 °C (rate 8 °C⋅min−1). The TPR-H2 was carried out on USGA-101 chemisorption analyzer. The samples were placed into a quartz reactor, heated under Ar flow to 400 °C, calcined at this temperature for 0.5 h and finally cooled to 60 °C. The reduction was carried out using a H2/Ar gas mixture (1/9) with a flow rate of 30 ml⋅min−1. The temperature was linearly increased to 800 °C (rate 9 °C⋅min−1). The XPS measurements were performed using a “PREVAC EA15” electron spectrometer. In the current work, AlK𝛼 (h𝜈 = 1486.6 eV, 150 W) was used as a primary radiation source. The pressure in the analytical chamber did not exceed 5 × 10⁻⁹ mbar during spectra acquisition. The binding energy scale was precalibrated using the positions of Ag3d5∕2 (368.3 eV) and Au4f7∕2 (84.0 eV) from silver and gold foils, respectively. The powdered catalyst samples were supported onto double-sided conducting scotch tape. To take into account the effect of surface charging, the C1s at Eb = 284.8 eV from the carbon contamination was used as an internal standard. The coke content for the spent catalyst was measured by a Mettler Toledo TGA/DSC3+ thermogravimetric analyzer. The spent catalysts were heated in 150 μL alumina crucible from 30 to 1000 °C under air flow (50 mL⋅min−1) with a heating rate of 10 °C⋅min−1. The element distribution in fresh and regenerated catalyst samples was obtained by energy-dispersive X-ray spectroscopy (EDX) using a Hitachi TM3030 Plus microscope. The FTIR analysis (PerkinElmer Spectrum Two) was used to identify the bonds related to organic compounds on the deactivated samples. The PerkinElmer Spectrum Two was used with the registration of the absorption spectrum in the range from 4000 to 500 cm−1 with a resolution of 4 cm−1.
3. Results and discussion
3.1. Catalyst characterization
Table 1 shows the practical compositions of the samples according to XRF and the textural and catalytic characteristics obtained by the BET and TPD-NH3 methods. All catalyst samples have a bulk density of 0.48–0.50 g⋅cm−3. Comparison of the XRD patterns of the catalysts and the support (Figure S1) shows that the use of metal oxides does not lead to the appearance of new peaks and all samples remain X-ray amorphous. Nitrogen adsorption–desorption isotherms (Figures S2–S13) for all samples belong to type IV isotherms according to the IUPAC classification with a hysteresis loop of type H2. This type of isotherms is typical for micromesoporous materials with heterogeneous pore size distribution [23].
Catalyst characteristics (XRF, BET, TPD-NH3)
| Catalyst | Practical concentration, wt% (XRF) | BET | TPD-NH3 | ||||||||||
|---|---|---|---|---|---|---|---|---|---|---|---|---|---|
| SSA (m2⋅g−1) | Vp (cm3⋅g−1) | CAS (Mmol⋅g−1) | tMAX (°C) | ||||||||||
| ZnO | ZrO2 | CuO | La2O3 | Before | After | Before | After | ||||||
| SiO2 | - | - | - | - | 384 | - | 0.93 | - | 159 | 230 | |||
| Zn/Zr | 0.51 | 1.51 | - | - | 368 | 317 | 0.90 | 0.83 | 103 | 227 | |||
| Cu/Zn/Zr | 0.52 | 1.50 | 1.01 | - | 355 | 292 | 0.88 | 0.79 | 161 | 225 | |||
| La/Zn/Zr | 0.50 | 1.50 | - | 2.31 | 352 | 308 | 0.90 | 0.81 | 166 | 230 | |||
| Cu/La/Zr-1 | - | 1.48 | 0.99 | 1.51 | 346 | 304 | 0.87 | 0.80 | 180 | 221 | |||
| Cu/La/Zr-2 | - | 1.49 | 2.01 | 2.32 | 359 | 271 | 0.91 | 0.88 | 222 | 233 | |||
| Cu/La/Zr-3 | - | 1.51 | 2.00 | 1.48 | 355 | 304 | 0.89 | 0.82 | 236 | 240 | |||
| Cu/La/Zr-4 | - | 1.51 | 2.02 | 3.26 | 312 | 267 | 0.92 | 0.85 | 240 | 228 | |||
| Cu/La/Zr-5 | - | 2.03 | 1.99 | 2.30 | 349 | 316 | 0.82 | 0.76 | 255 | 238 | |||
| Cu/La/Zr-6 | - | 1.02 | 2.01 | 2.32 | 358 | 314 | 0.89 | 0.82 | 234 | 237 | |||
| Cu/La/Zr-7 | - | 1.51 | 1.03 | 2.29 | 347 | 310 | 0.85 | 0.81 | 154 | 220 | |||
| Cu/La/Zr-8 | - | 1.50 | 0.48 | 2.33 | 364 | 313 | 0.87 | 0.81 | 130 | 227 | |||
The study of the acidic properties of catalysts by the TPD-NH3 method (Figures S14–S25) showed that an increase in the concentration of copper leads to an increase in the amount of desorbed ammonia during the procedure (Figure 1). At the same time, there is no direct correlation between the change in the concentration of La or Zr (Figures S26–S27) and the number of acid sites. For all catalysts, the peak temperature of the curve (tMAX) is in the range of 220–240 °C, which is typical for weak acid sites. Apparently, the Cu compounds on the surface act as weak acid sites, while La and Zr have only a modifying effect on them and do not act as independent sites.
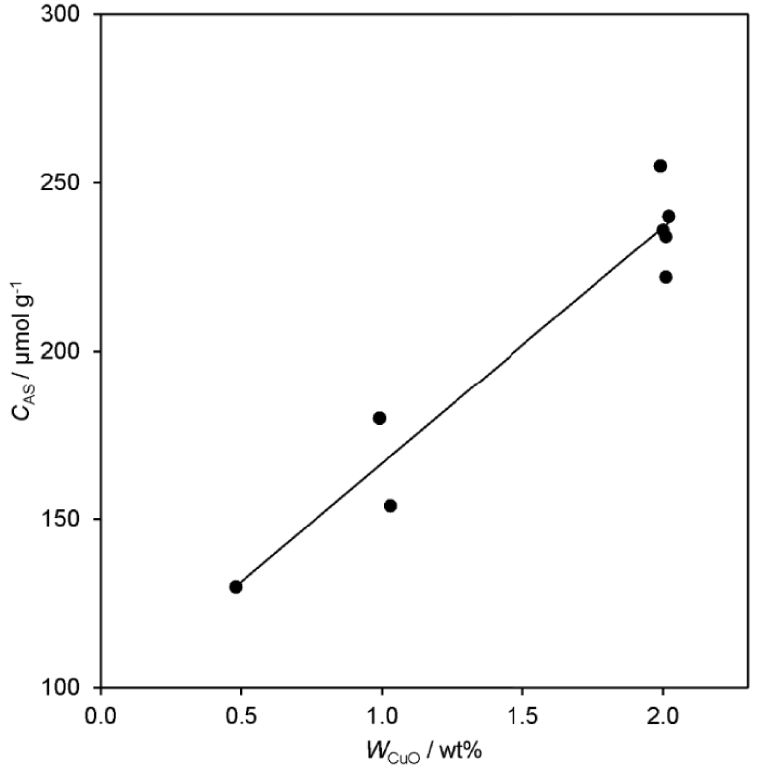
Acid site concentration as a function of copper content in Cu/La/Zr catalysts.
Figure S28 shows the TPR curves for synthesized catalysts. The resulting curves were analyzed by deconvolution in order to evaluate the contribution of centers with different temperature activities on the catalyst surface. For Zn-containing catalysts, there is a peak with low intensity at a temperature of 540 °C, which is typical for the reduction of zinc oxide [24]. In the case of La- and Zr-containing samples, a wide peak is observed with a maximum in the region of 400–450 °C. For copper catalysts, a peak is observed with a maximum in the temperature range of 260–300 °C, which is typical for the reduction of CuO. For Cu/La/Zr samples, there is a pronounced asymmetry of this peak. In particular, for Cu/La/Zr-1 and Cu/La/Zr-2, this asymmetry is noticeable even without deconvolution, and an additional peak appears in the range of 150–200 °C. According to [25], the interaction of CuO with La2O3 leads to an increase in the reduction ability of the catalyst due to surface stabilization and facilitation of the formation of Cu2+ particles. As a result, this leads to the facilitation of the reactions of the redox cycle Cu2+–Cu+. On the curve of the Cu/La/Zr-2 sample, the peak in the low-temperature region has the highest intensity. Apparently, the unique low temperature redox properties causes its high activity in comparison with other Cu/La/Zr samples.
According to the results of the XPS for Cu/La/Zr-2 and Cu/La/Zr-3 (Figure 2), the change in the initial concentration of the components does not affect the oxidation state of the main components of the catalyst (Figures S29–S31). At the same time, the results indicate different atomic concentrations of the components on the surface of the catalyst. Concentrations were obtained for the Cu/La/Zr-2 sample: 0.90 wt% Cu, 1.44 wt% La and 1.89 wt% Zr. In turn, for the Cu/La/Zr-3 concentrations are 1.25, 1.15 and 2.67 wt%, respectively. But during the synthesis, only the concentration of lanthanum differed and it is confirmed by XRF. Apparently, a change in the concentration of lanthanum leads to a change in the surface dispersion of the active component, thereby causing a change in the activity and selectivity of the catalyst.
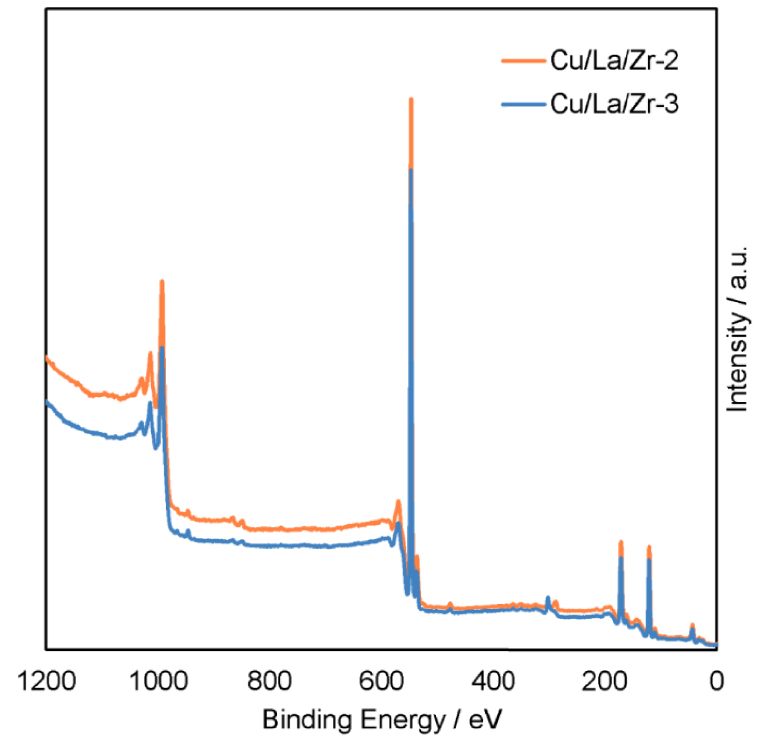
XPS analysis of samples Cu/La/Zr-2 and Cu/La/Zr-3.
3.2. Catalyst testing
3.2.1. Selection of active catalyst components
To compare the activity of the five selected catalyst prototypes, conditions were used to obtain XEtOH in the range of 30–50% (Table 2). T = 360 °C and LHSV = 1.15 h−1 meet the test conditions for most active catalysts for the Lebedev reaction [3, 4]. At the same time, the catalytic systems previously used in industry require higher temperatures and lower feed rates. Under these conditions, the prototype Zn/Zr proved to be inefficient for the production of BD, and ethylene was the main reaction product. Addition of Cu and La into the Zn/Zr catalyst leads to an increase in the selectivity for the formation of BD, as well as intermediate AA and CA.
Catalytic performance in BD production at 360 °C, LHSV = 1.15 h−1 at 4 h
| Catalyst | YBD (%) | XEtOH (%) | Product selectivity (Si) (%) | ||||||
|---|---|---|---|---|---|---|---|---|---|
| BD | AA | DEE | CA | BuOH | Et | Bu | |||
| Zn/Zr | 6.4 | 31.3 | 20.4 | 22.8 | 13.9 | 1.1 | 1.3 | 34.8 | 0.6 |
| Cu/Zn/Zr | 11.2 | 37.1 | 30.3 | 38.1 | 4.8 | 1.9 | 4.6 | 5.6 | 5.9 |
| La/Zn/Zr | 11.5 | 30.0 | 38.4 | 31.0 | 5.4 | 1.4 | 5.3 | 9.4 | 1.9 |
| Cu/La/Zr-1 | 16.6 | 42.6 | 39.0 | 25.2 | 4.5 | 2.1 | 6.5 | 10.4 | 5.0 |
| Cu/La/Zr-2 | 20.0 | 49.3 | 40.5 | 26.3 | 2.0 | 3.6 | 7.8 | 4.0 | 7.3 |
After 24 h of continuous experiment with La/Zn/Zr catalyst, YBD is reduced to 8.0% (XEtOH = 25.3%, SBD = 31.4%,
The combination of Cu, La and Zr is more promising. The first two samples under the same conditions show a significant increase in ethanol conversion due to Cu catalysis of the AA formation reaction. SBD is observed no less than when using La/Zn/Zr. According to the results of TPD-NH3, the introduction of copper into the catalyst composition leads to an increase in the number of acid sites. At the same time, according to the results of TPR, the interaction of CuO with La2O3 increases the activity of catalysts due to an increase in the rate of their reduction.
XEtOH, fixed after 1 h of the experiment with Cu/La/Zr-1, steadily increases with increasing temperature in the range of 345–390 °C (Figure S32). SBD increases up to 360 °C and then it remains stable at 41.5–42.0%. However, an increase in temperature negatively affects the ratio of the rates of dehydration and dehydration reactions and this can be seen from the change in SAA and SEt. Also, a high process temperature leads to faster deactivation of the catalyst. At 380 °C, the key process parameters are initially higher (Figure S33), but they decline much faster. At 340 °C, the composition of the products is more stable and, as a result, the average
In the LHSV range from 1.0 to 1.4 h−1 at 340 °C, XEtOH increases linearly with decreasing feedstock supply (Figure S34), and the composition of the reaction products remains practically unchanged. At LHSV less than 0.9 h−1, the formation of high-molecular C4+ side compounds on the Cu/La/Zr catalysts begins to occur noticeably and PBD decreases.
3.2.2. Effect of the active components Cu/La/Zr
Three series of experiments were carried out with a change in the content of each of the metals in the Cu/La/Zr catalyst to assess their effect on the reaction. The conditions of all experiments were the same, namely: 100 cm3 of the catalyst sample, T = 340 °C, LHSV = 1 h−1, 95 wt% EtOH. The continuous operation time was 6 h.
A decrease in the copper content from 2.01 wt% in the Cu/La/Zr-2 to 1.03 wt% in the Cu/La/Zr-7 leads to a decrease in XEtOH by 5–15% during the experiment (Figure 3a). YBD decreases by 11.4% and it is associated with a change in SAA from 26.3% to 19.6% (Figure 3b,c). At the same time, in the experiment with the Cu/La/Zr-7, SDEE and SEt increase in 6 h from 1.0% to 4.2% and from 2.2% to 5.7%, respectively. These parameters were stable within ±0.5% when using the Cu/La/Zr-2. A further decrease in the content of CuO to 0.48 wt% in the Cu/La/Zr-8 leads to a significant increase in the selectivity of the formation of ethanol dehydration products (Figure 3d). However, their total yield practically does not change for all three catalysts. For example, YEt remains in the range of 1.0–2.5%. Such dependencies are explained by a decrease in the amount of AA formed, and it affects all further products of the target reaction. The comparatively low XEtOH is due to this reason (Figure 3a). Thus, copper in Cu/La/Zr is a key component for the formation of the first intermediate product AA for the subsequent aldol condensation.
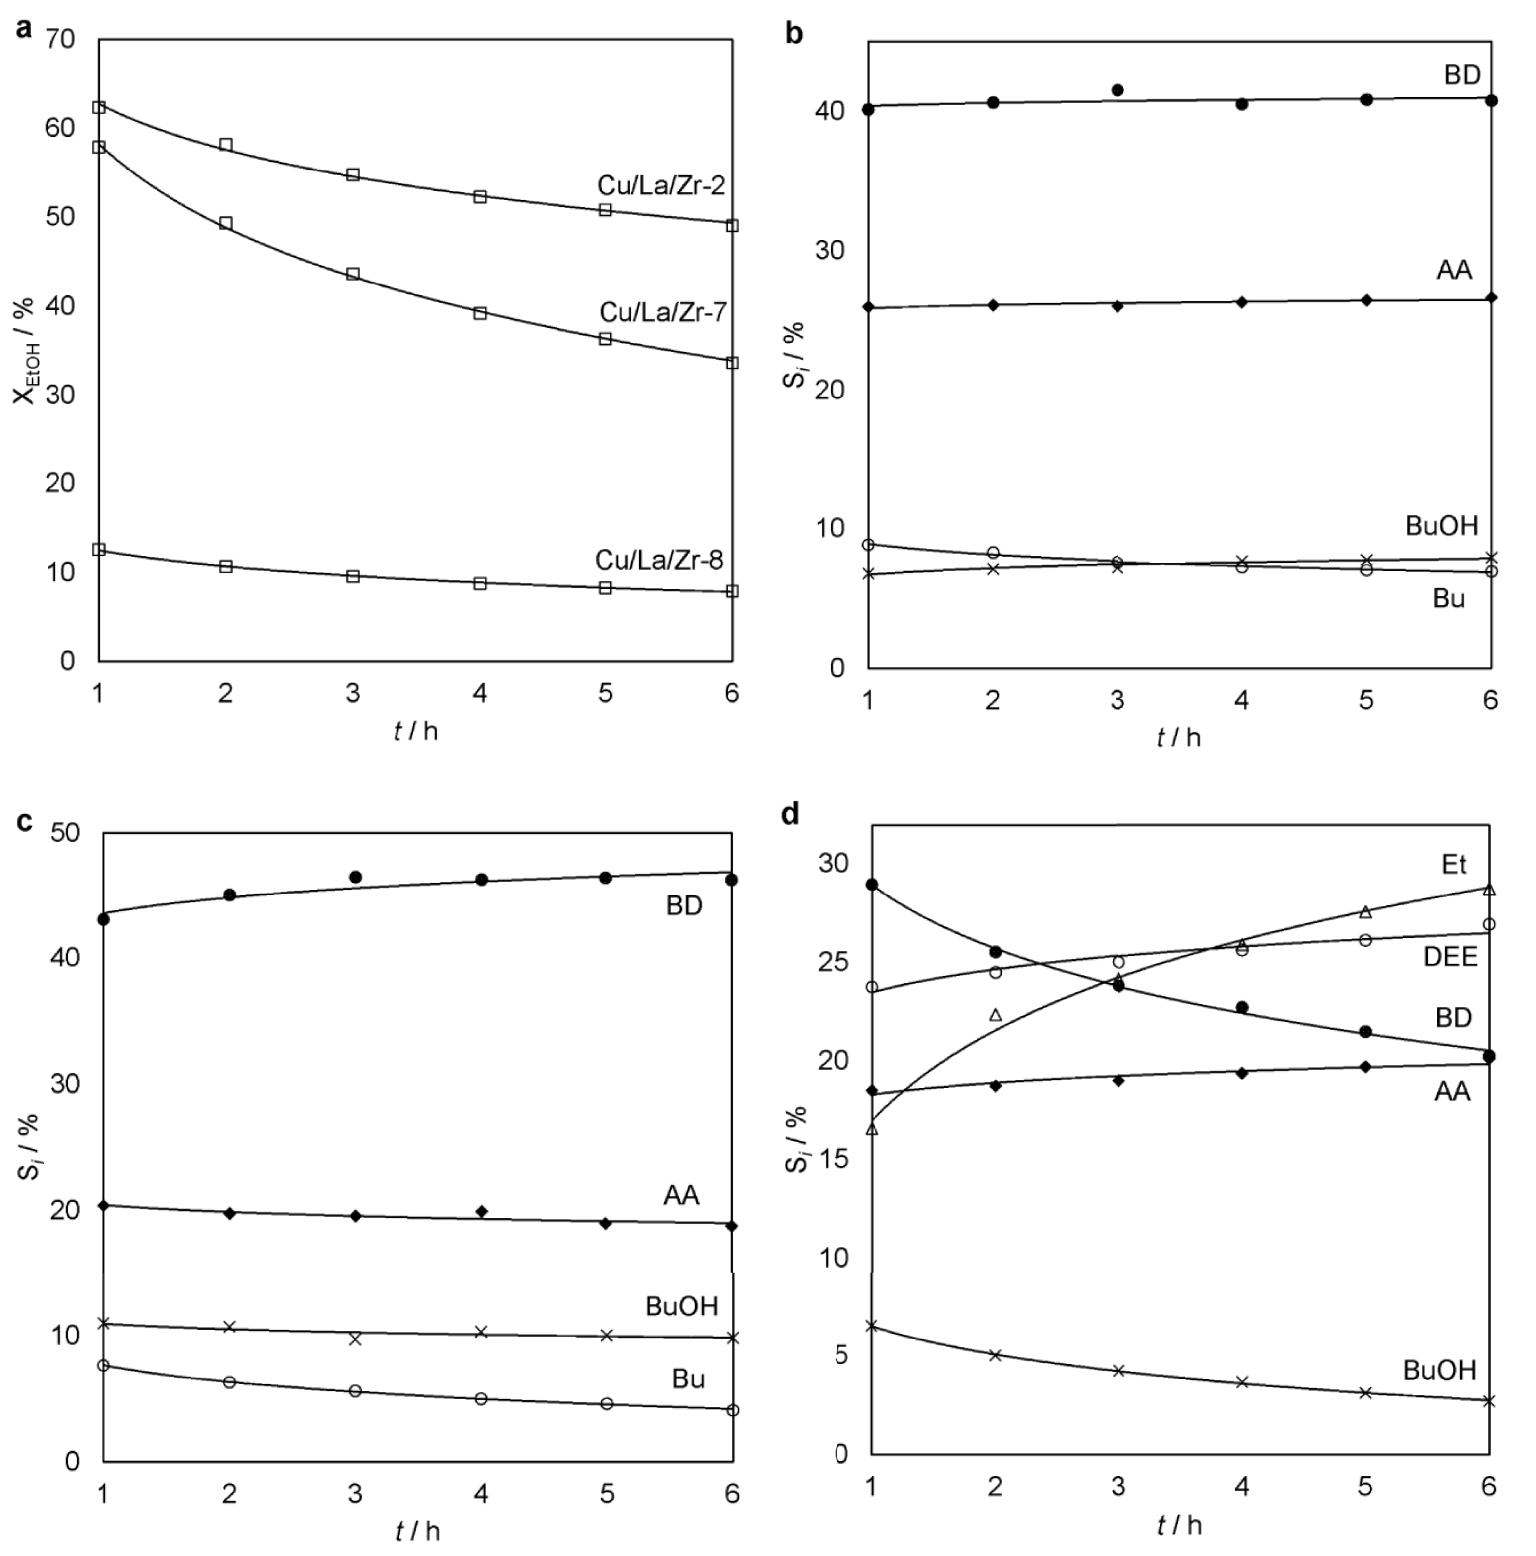
Ethanol conversion (a) over the Cu/La/Zr catalysts with different content Cu (100 cm3 catalyst, 340 °C, LHSV = 1 h−1) and selectivity of the main reaction products for Cu/La/Zr-2 (b), Cu/La/Zr-7 (c) and Cu/La/Zr-8 (d) as a function of time-on-stream.
A decrease in the zirconium content from 1.49 wt% in the Cu/La/Zr-2 to 1.02 wt% in the Cu/La/Zr-6 does not lead to a fundamental change in the composition of the reaction products (Figure S35). Differences are observed only in the increase in the yield of some by-products, such as acetone, propylene, high molecular weight C4+. At the same time, the average XEtOH is lower by 4.1% during the experiment when using the Cu/La/Zr-6 (Figure S36) and it leads to a decrease in PBD by 6.1%. In turn, an increase in ZrO2 to 2.03% in the Cu/La/Zr-5 has a significant effect on the change in the composition of the products (Figure S37). There is an increase in the yield of most products of condensation, isomerization and reduction reactions, including by-products—EA, MEK, BuOH. Despite a significant increase in XEtOH, the low selectivity of BD formation leads to a decrease in its yield to 18.9% and an average
An increase in the content of lanthanum from 2.32 wt% in the Cu/La/Zr-2 to 3.26 wt% in the Cu/La/Zr-4 leads to an almost twofold increase in SMEK and SCA (Figure S38). At the same time, SAA decreases from 26.3% to 20.6% and SEA also decreases. Apparently, La has a positive effect on the acetaldol formation reaction. XEtOH is on average 2.0% lower (Figure S39), but YBD is maintained by an increase in SBD. Due to this, similar
At the same time, Cu/La/Zr-3-6 catalysts are characterized by a larger number of acid sites than Cu/La/Zr-2. This is probably one of the reasons for the difference in the selectivity of product formation. Thus, the presence of acid sites is necessary for an active and selective catalyst, but their number should be limited. In the Cu/La/Zr-2 sample characterized by the highest yield of butadiene-1,3, the number of acid sites seems to be the most optimal.
The second factor controlling the selectivity of the catalyst is its redox properties. According to the TPR results, Zr and especially La additives moderate the reducing properties of copper. In turn, this leads to a higher activity of such catalysts. At the same time, an additional peak is observed on the TPR curves in the range of 150–200 °C, and it is most pronounced in the Cu/La/Zr-2 sample. The intensity of this peak decreases with a change in the ratio of active components in other Cu/La/Zr samples. Probably, this also leads to a decrease in the activity of the catalysts or an increase in the selectivities of by-products.
3.2.3. Effect of the recycle of acetaldehyde
YBD can be increased by recycling the resulting AA. In this case, the condensation of AA into acetaldol begins immediately upon contact of the feed stream with the catalytic layer. The parallel flow of the ethanol dehydrogenation reaction makes it possible to maintain a high concentration of AA over the entire height of the layer. The results of previous experiments with the Cu/La/Zr-2 catalyst made it possible to calculate the amount of AA to be returned to the process along with unreacted ethanol. Two mixtures were prepared and tested under the same conditions (Table 3).
Experimental results using EtOH + AA mixture (100 cm3 Cu/La/Zr-2, 340 °C, LHSV = 1.3 h−1, t = 1 h)
| Raw material | YBD (%) | XEtOH (%) | XAA (%) | Product selectivity (Si) (%) | |||||
|---|---|---|---|---|---|---|---|---|---|
| BD | AA | CA | BuOH | Et | Bu | ||||
| 85.5% EtOH, 4.5% H2O, 10.0% AA | 30.2 | 57.4 | - | 52.7 | 9.1 | 6.0 | 4.9 | 7.0 | 9.1 |
| 80.9% EtOH, 4.3% H2O, 14.8% AA | 28.8 | 47.7 | 6.4 | 60.3 | - | 7.7 | 4.6 | 9.4 | 5.7 |
In the first case, the feed stream contained 10.0 wt% AA, but during the first hour of the process, more of it was formed than it entered into the reaction. The positive effect is observed in the growth of SBD and SCA, and PBD reaches
With an increase in the concentration of AA in the raw material to 14.8%, SBD can exceed 60%. In the second experiment, the rate of AA condensation increased significantly and its formation from ethanol could not compensate for the loss. As a result, less AA was obtained from the reactor and the calculated XAA was 6.4%. During the entire cycle of the catalyst, both of these cases can be observed. At first the activity of the catalyst is higher and this results in high XEtOH and YAA. As deactivation progresses, these indicators decrease and less and less AA is formed. The balance of AA during the entire cycle is an important point in optimizing the operation of an industrial process.
The next experimental mixture contained 77.3 wt% EtOH, 10.1 wt% H2O and 12.6 wt% AA. The extra amount of water was added on purpose. At 360 °C and LHSV = 1 h−1, the average YBD for 8 h when using this mixture was 34.1% (Figure 4a). It is significantly higher than YBD under the same conditions using 95 wt% EtOH. SBD is in the range of 55.5–58.0%, and the main by-products are ethylene and butenes (Figure 4b). At the same time, the increase in the ethylene yield is due to an increase in the process temperature.
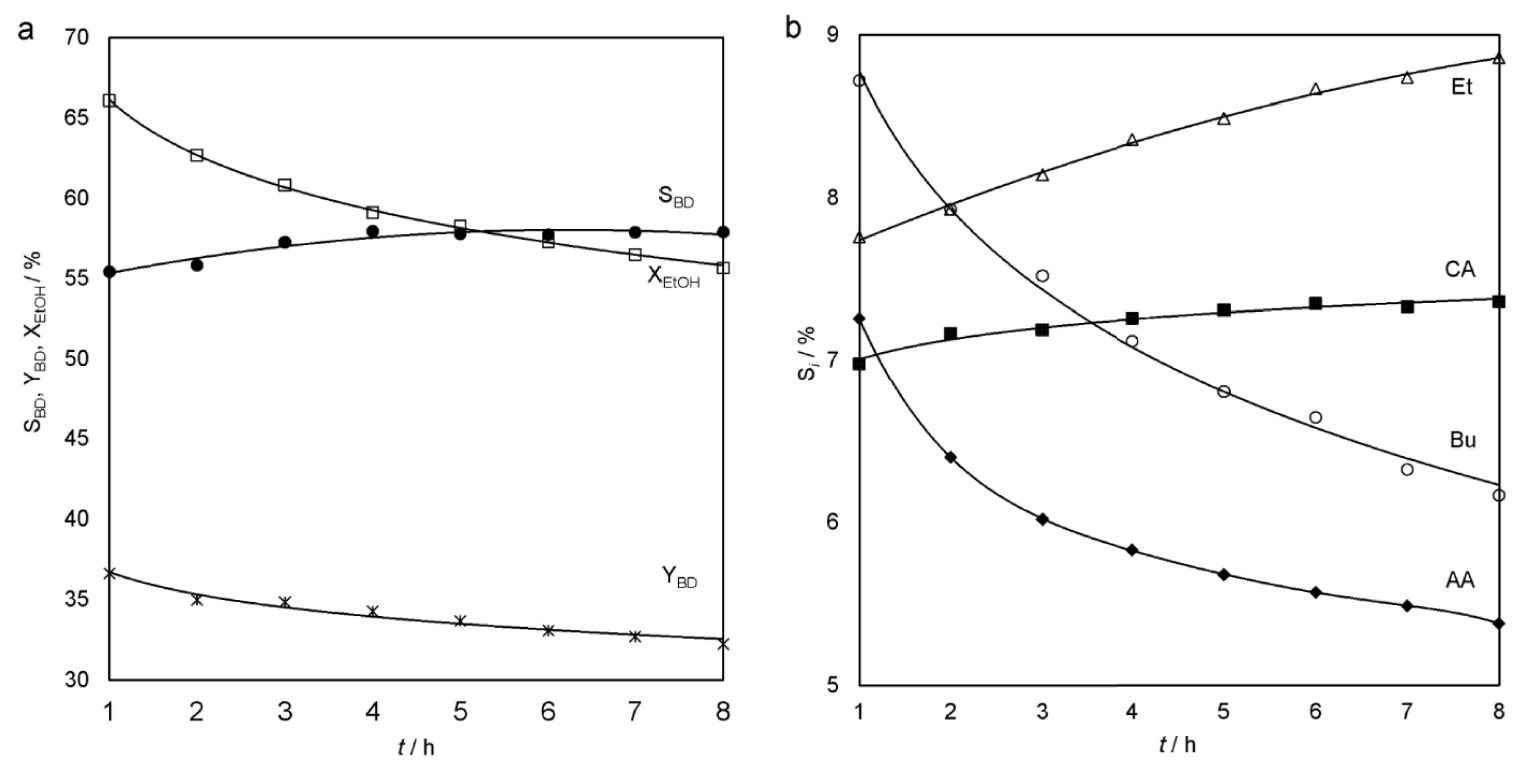
Ethanol conversion, selectivity and yield of the butadiene (a) and selectivity of the main reaction by-products (b) as a function of time-on-stream (100 cm3 Cu/La/Zr-2, 360 °C, LHSV = 1 h−1, raw material: 77.3 wt% EtOH, 10.1 wt% H2O, 12.6 wt% AA).
The same average YBD for 8 h of 34.1% at 340 °C can be obtained by reducing LHSV to 0.9 h−1 and without adding excess water to the feed stream. At the start of the cycle, XEtOH is higher, for example, it is 72.7% after 1 h of the experiment, but the decrease in activity is faster (Figure 5a). It is associated with increased contact time in the reaction zone. This results in increased condensation of molecules with aldehyde groups into heavier C4+ compounds. Also, the reason is a decrease in the concentration of water in the feedstock, which contributes to a more stable operation of the catalyst. Despite this, the SBD grows in the first hours of the experiment and reaches a stable value of 60.3%. By this point in time, other major products are n-butanol, crotonaldehyde and butenes (Figure 5b).
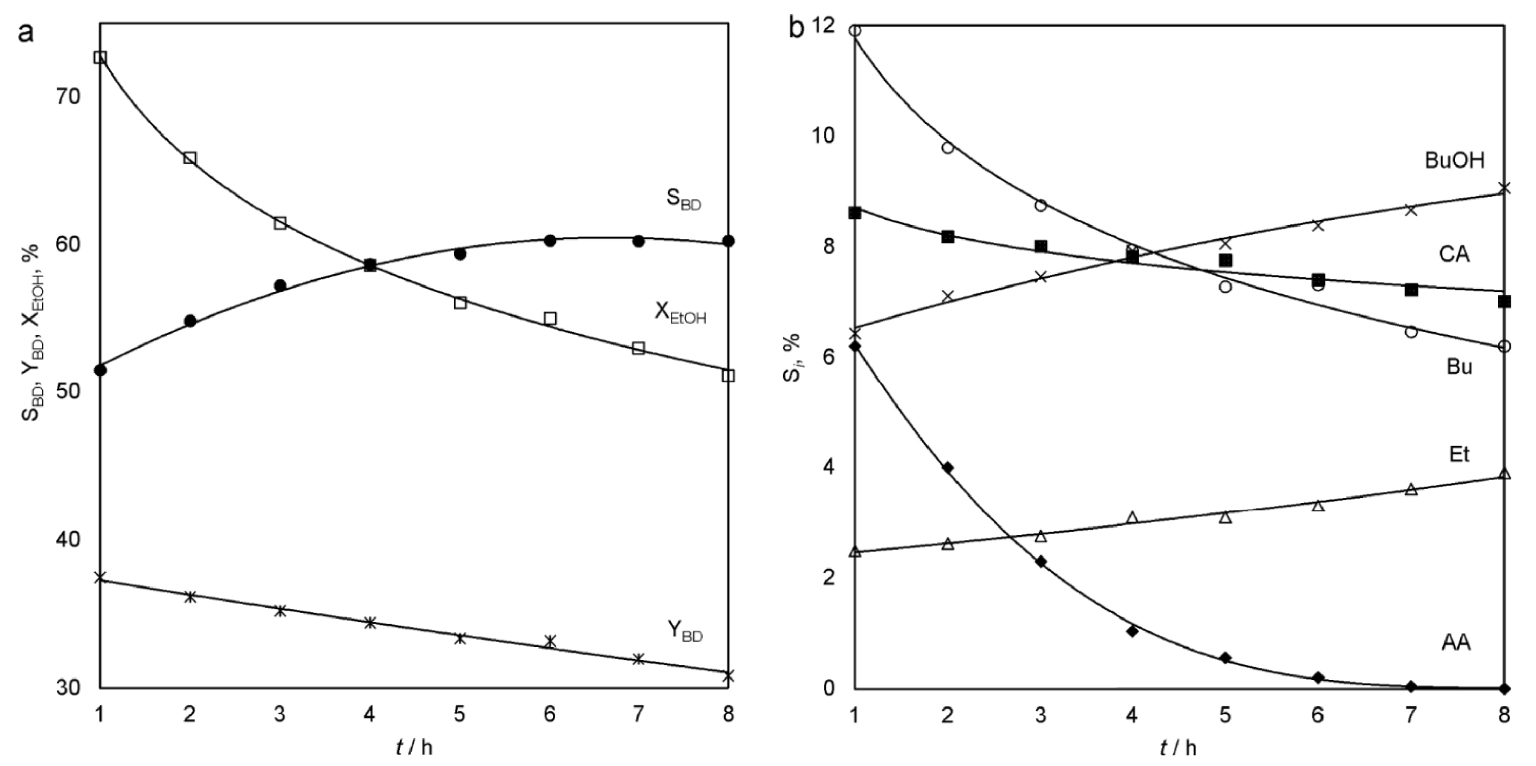
Ethanol conversion, selectivity and yield of the butadiene (a) and selectivity of the main reaction by-products (b) as a function of time-on-stream (100 cm3 Cu/La/Zr-2, 340 °C, LHSV = 0.9 h−1, raw material: 83.1 wt% EtOH, 4.3 wt% H2O, 12.6 wt% AA).
Thus, varying such parameters as temperature, feed rate, AA and H2O concentrations makes it possible to achieve PBD over
In the scientific literature, there are practically no data on the operation of real industrial catalysts for this process in the 20th century. However, an industrial sample is considered with a mass yield of butadiene-1,3 of 18.1% [26, 27]. It corresponds to YBD = 30.8%. At the same time, the process was carried out at a temperature of 420 °C, and SBD did not exceed 44.2%. It follows that Cu/La/Zr catalysts, especially Cu/La/Zr-2, can compete with real samples of catalysts that worked under industrial conditions in the ETB process.
3.2.4. Catalyst stability
When testing all Cu/La/Zr samples, a decrease in catalytic activity is observed over time, as shown above. In this case, XEtOH usually decreases, while the composition of the reaction products is more stable. This suggests that during the reaction, the surface of the support is coked and its pores are blocked, rather than the deactivation of individual active sites. Similar observations are also reported in [19]. This is confirmed by the data on nitrogen adsorption–desorption for catalyst samples after the experiment (Table 1). As noted in [28, 29], bulk oxygen-containing aromatic compounds, such as 2,4-dimethylbenzaldehyde, are formed and adsorbed on the catalyst surface. Their source is the formed acetaldehyde and acetone. They condense to larger unsaturated aldehydes and ketones followed by cyclization. It was also noted that deactivating particles can be removed from the surface by calcination.
Stability tests were carried out for the catalyst Cu/La/Zr-2 (Figure 6). A mixture of 90 wt% EtOH and 10 wt% H2O was used as the feedstock. Each test cycle was 24 h of continuous reactor operation. The catalyst was regenerated for two hours before the start of the next cycle. As a result of the first cycle, average indicators were obtained:
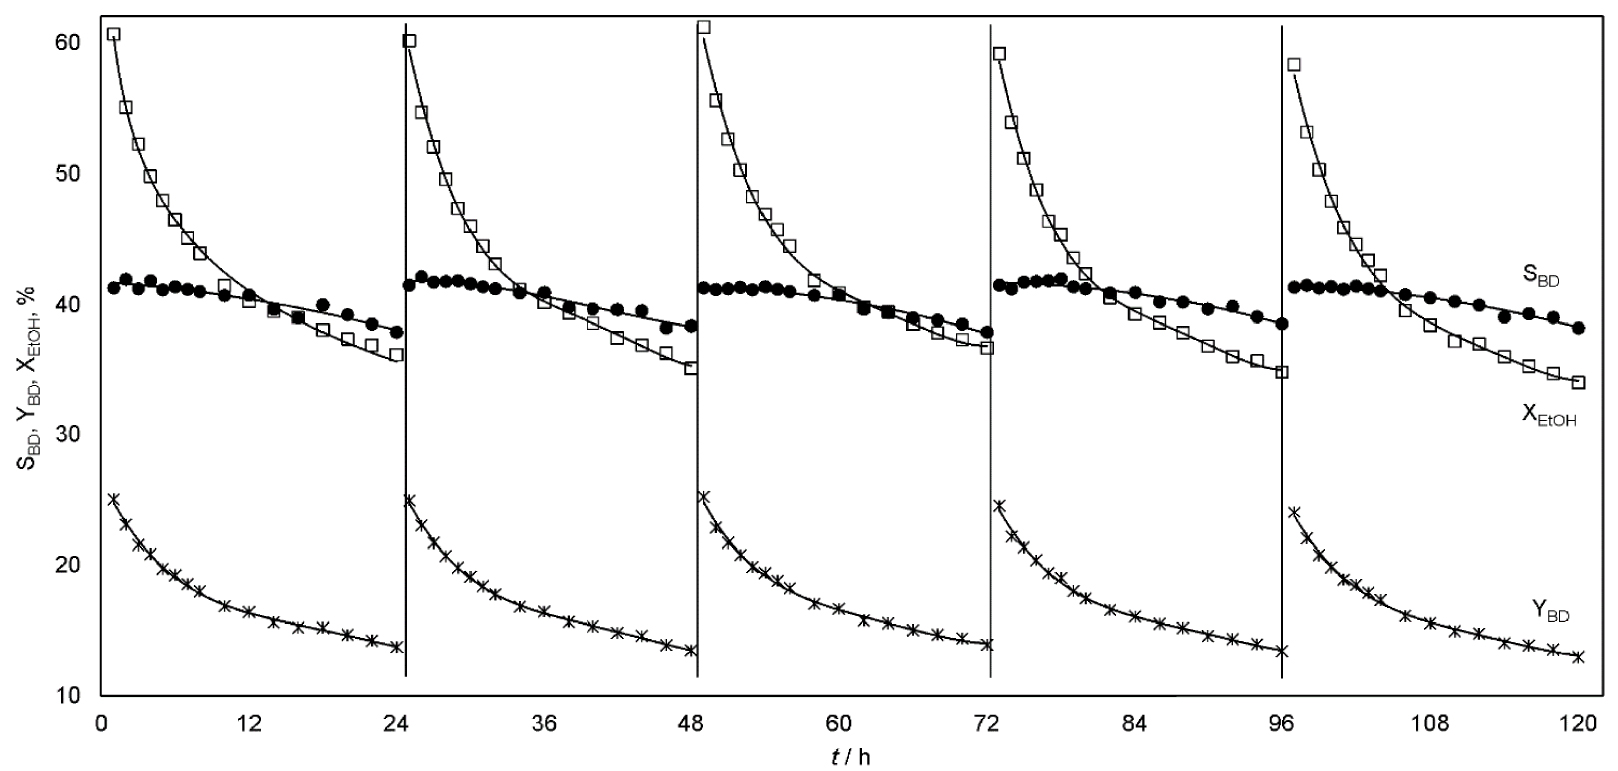
Ethanol conversion, selectivity and yield of the butadiene as a function of time-on-stream (100 cm3 Cu/La/Zr-2, 355 °C, LHSV = 1 h−1, raw material: 90 wt% EtOH, 10 wt% H2O).
Within 5 cycles, the selectivity for the formation of all products, including BD, remains stable and reproducible. In turn, there is a decrease in XEtOH. It may be associated with incomplete removal of deactivating particles from the catalyst surface during regeneration. As a result of the fifth cycle, average indicators were obtained:
The conversion of ethanol is significantly reduced in the conditions of a real industrial process. The catalyst is not stable. Its high activity leads to rapid deactivation. But the regeneration returns the activity of the catalyst. The duration of one cycle, the number of possible working cycles and regenerations, the total lifetime of the catalyst is an individual big research. The optimal process conditions will be determined not only by the yield of butadiene at the reaction stage, but also by the cost of butadiene, taking into account all stages of production.
The deactivated Cu/La/Zr-2 sample was selected for comparison with the original sample. The TGA-DSC analysis (Figures S41–S42) confirmed the content of physiosorbed substances such as reaction products and coke. Sample mass change 𝛥m and normalized thermal effects Q are shown in Table 4. QI is related to moisture desorption and is observed for the deactivated and the original sample. QII and QIII clearly refer to the oxidation of the adsorbed reaction by-products and coke with the release of heat. FTIR-spectra (Figure S43) prove the presence of aromatic, unsaturated and oxygen-containing compounds.
Weight changing and normalized thermal effects of Cu/La/Zr-2 before and after experiment
| Sample | ΔmI (wt%) | ΔmII (wt%) | ΔmIII (wt%) | QI (J⋅g−1) | QII (J⋅g−1) | QIII (J⋅g−1) |
|---|---|---|---|---|---|---|
| Cu/La/Zr-2 | 4.3 | - | - | −97.9 | - | - |
| Cu/La/Zr-2 (deact.) | 2.6 | 0.8 | 2.7 | −29.0 | 94.2 | 562.4 |
A representative SEM images and the element EDX mappings for Si, O, Cu, La and Zr in a fresh Cu/La/Zr-2 sample and a sample after regeneration are shown in Figures S44–S45. The results show that the particles of the active components are evenly distributed on the silica gel. It didn’t change after sample regeneration. During the oxidation of coke, the formation of any agglomerations of particles or their removal from the surface is not observed. A fresh Cu/La/Zr-3 sample (Figure S46) was also analyzed to compare the dispersion of active elements on the surface of different catalysts. The results of SEM and XPS for two samples show that the distribution of active components on the surface is uniform in both cases, its oxidation states and particle size do not change. But at the same time there is a change in their surface concentrations and for Cu/La/Zr-2 they are optimal for high activity in the ETB process.
Table 5 shows some of the results of our investigation and a comparison with the catalysts presented in the literature. But after carefully studying the methodology for testing catalysts, it becomes clear that the authors use dilution with the inert (nitrogen, argon, helium) in all cases. It seriously affects the catalyst performance and its stability. This condition is no less important than, for example, the temperature of the process.
Catalytic performances and reaction conditions of selected catalysts from the literature and catalysts used in this investigation
| Catalyst | T (°C) | WHSV (h−1) | Feedstock and dilution with inert | TOS (h) | XEtOH (%) | SBD (%) | SAA (%) | YBD (%) | PBD ( |
Ref. |
|---|---|---|---|---|---|---|---|---|---|---|
| 1% CuO/MgO–SiO2 | 425 | 0.5 | 2% gas EtOH by volume in N2 flow | 4 | 74 | 49 | 7 | 37 | 0.102 | 12 |
| 67% MgO/33% SiO2 | 400 | - | 2% gas EtOH by volume in N2 flow | - | 63.5 | 20.8 | 4.7 | 13.2 | - | 13 |
| 3% Au 50% MgO–SiO2 | 300 | 1.1 | 2% gas EtOH by volume in He flow | 3.3 | 45 | 60 | 30 | 27 | 0.135 | 14 |
| 1% Ag 50% MgO–SiO2 | 400 | 1.2 | 2% gas EtOH by volume in Ar flow | 3.3 | 44 | 46 | 19 | 20 | 0.14 | 15 |
| 480 | 84 | 50 | 4.8 | 42 | 0.29 | |||||
| 5% In2O3/MgO–SiO2 | 350 | 0.5 | 14.7% gas EtOH by volume in He flow | 3.3 | 44 | 54 | 20 | 23.8 | - | 16 |
| Ag/ZrBEA (100) | 320 | 0.32 | 50% gas EtOH by volume in He flow | 3 | 47.9 | 55.6 | 0.5 | 26.6 | 0.05 | 17 |
| Ag/ZrBEA (400) | 32.4 | 67.2 | 2.2 | 21.8 | 0.04 | |||||
| ZrZn/MgO–SiO2 | 325 | 0.3 | 1% gas EtOH by volume in Ar flow | 4 | 40 | 62.6 | 5.9 | 25 | 0.04 | 18 |
| Cu/Zn/Zr/SiO2 | 375 | 1 | 0.4% gas EtOH by volume in Ar flow | 1 | 38.5 | 50.1 | 15.6 | 19.3 | 0.113 | 19 |
| Zn/Zr/SiO2 | 44.5 | 42.9 | 15.4 | 19.1 | 0.112 | |||||
| Zn/Zr/SiO2 | 375 | 1 | 0.4% gas mixture EtOH:AA (9:1) by volume in Ar flow | 3 | 53.0 | 44.7 | 11.5 | 23.7 | 0.139 | |
| 2% ZnO 7% La2O3 0.5% ZrO2/SiO2 | 375 | 1 | 18% gas EtOH by volume in Ar flow | - | 50.1 | 53.0 | 21.3 | 26.5 | 0.16 | 20 |
| 2% ZnO 7% La2O3 1% ZrO2/SiO2 | - | 80.0 | 65.7 | 4.3 | 52.5 | 0.31 | ||||
| 1% Cu 3% Hf 0.5% Zn/SiO2 | 360 | 0.21 | 0.007% gas EtOH by volume in N2 flow | 10 | 99 | 71 | 4.2 | 71 | 0.089 | 21 |
| 3% Hf 0.5% Zn/SiO2 | 0.64 | 10 | 68 | 60 | 15 | 41 | 0.154 | |||
| 2.5% Hf 16% Zn/SiO2 | 0.5 | 99.2 | 71 | 4.0 | 70.2 | 0.264 | ||||
| 0.5% ZnO 2.3% La2O3 1.5% ZrO2/SiO2 | 360 | 1.95 | 95% EtOH. 5% H2O (undiluted) | 4 | 30.0 | 38.4 | 31.0 | 11.5 | 0.132 | Our data |
| 1.5 | 83.1% EtOH, 4.4% H2O, 12.5% AA (undiluted) | 45.1 | 60.2 | 0 | 27.1 | 0.239 | ||||
| 2% CuO 2.3% La2O3 1.5% ZrO2/SiO2 | 340 | 1.66 | 95% EtOH. 5% H2O (undiluted) | 1 | 62.3 | 40.1 | 26.0 | 25.0 | 0.244 | Our data |
| 360 | 77.3% EtOH, 10.1%H2O, 12.6% AA (undiluted) | 1 | 66.1 | 55.5 | 7.3 | 36.7 | 0.358 | |||
| 8 | 55.7 | 57.9 | 5.4 | 32.3 | 0.315 |
Therefore, comparing all the results with each other is not correct here. When diluting by inert gas, it is possible to choose conditions for high ethanol conversion and butadiene selectivity and they will be relatively stable. This is well suited only for studying groups of catalysts within the same work under identical conditions. The catalysts in our article may be more active and stable under the test conditions in Ref. [12, 13, 14, 15, 16, 17, 18, 19, 20, 21]. Conversely, their catalysts will show worse results at full load and without dilution by inert gas. At the initial time, we also recorded a 100% conversion of ethanol with high yields of target products, but this is not an indicative result. More valuable information is the performance of catalysts in real conditions, because the technology using inert will be uncompetitive in industry. In our work, we focus on testing catalysts in real industrial conditions, without inert gas and with a full load on catalysts. Our objective was not to repeat the tests of other authors and obtain the same data on the yield of butadiene.
4. Conclusions
Various catalyst systems of the Lebedev reaction from oxides of Zn, Zr, La, Cu and granulated silica gel were investigated. The catalysts were characterized by BET, XRF, XRD, TPD-NH3 and TPR. Samples of CuO/La2O3/ZrO2/SiO2 turned out to be the most promising for the production of butadiene-1,3. The influence of the content of active components on the yield of the target product was investigated. The most efficient is the catalyst containing 2.0 wt% CuO, 2.3 wt% La2O3 and 1.5 wt% ZrO2. When using a mixture of ethanol and acetaldehyde as a feedstock, the selectivity of the formation of butadiene-1,3 exceeds 60%, and the productivity of the product is at least
Conflicts of interest
The authors declare no competing financial interest. The manuscript was written through contributions of all authors. All authors have given approval to the final version of the manuscript.
Acknowledgements
This work was carried out within the State program of TIPS RAS. The work was performed using the equipment of the Shared-Use Center “Analytical Center for Problems of Deep Oil Refining and Petroleum Chemistry” and “New petrochemical process, polymers and adhesives” at the TIPS RAS. The authors would like to thank Dr. N. A. Zhilyaeva for help with nitrogen physisorption analysis and interpretation of those results. The authors would like to thank Dr. A. V. Chistyakov for help with TPD and TPR analysis, A. B. Solopov for help with SEM analysis and A. A. Sadovnikov for help with XPS analysis.
Supplementary data
Supporting information for this article is available on the journal’s website under https://doi.org/10.5802/crchim.221 or from the author.