


 CC-BY 4.0
1. Introduction
Rediscovered in the 1950s by the scientific community, the cyanobacterium Spirulina Platensis or spirulina (blue-green algae) revealed, through the analysis of its constituents, an exceptional nutritional value due to its unequaled richness in proteins, unsaturated lipids, antioxidant vitamins and minerals. It is commonly used in nutrition and food industry and contains a wide range of coloured compounds and large amounts of essential elements for developing and maintaining the human body [1]. Beyond its interesting nutritional capacities, spirulina also contains many proteins and molecules representing unrealised medical interest at the moment, in particular phycocyanin [2]. Phycocyanin is a component usually present in red algae and cyanobacteria [3]. Spirulina Platensis is the cyanobacterium richest in this molecule and was therefore naturally chosen for extraction work for scientific purposes. Phycocyanin is a pigment of very interesting biomedical interest. It can be used as an anti-inflammatory [4] or antibacterial adjuvant [5]. Studies also show an anti-cancer effect [6]. It also has the characteristic of being a free radical scavenger [7]. On the other hand, date stones were recently valorised through the production of activated carbon [8], and poultry nutrition [9] and in traditional medicine for their antimicrobial and antiviral properties [10, 11]. The characterization of the date stones revealed a richness of various valuable biochemical and mineral substances, namely dietary fibres (22.5–94%), proteins (2.3–6.4%), ashes (0.9–1.8%), sugars (5–6%), phenolic compounds (3102–4430 mg/100 g), and fat (7–13%) [12, 13]. Also, date stone oil is known for its richness in natural antioxidants such as polyphenols, sterols, tocopherols and carotenoids [14]. In this work, we are interested in the formulation of dietary supplement tablets of spirulina enriched with date stone powder as a diluent by determining the ideal tablet recipe based on D-Optimal Mixture Design involving the physicochemical characteristics of the spirulina and date stones powder and by studying the effect of dissolution medium on the phycocyanin release in simulated gastric fluid (SGF, pH 1.2) and simulated intestinal fluid (SIF, pH 6.8) and by analysing the Fourier Transform Infrared (FTIR) spectrum of the date stone and spirulina tablets.
2. Materials and methods
2.1. Excipients preparation
The spirulina was procured from the Tunisian company “Bio Algues”. The date stones were extracted from the Tunisian “Deglet Nour” date cultivar. The date stones were dried at 50 °C for 48 h, crushed manually, and then all the biomass was ground using an electric grinder to get a powder with a fine grain size (<100 μm).
2.2. Proximate composition of date stone and spirulina crude powder
Moisture content and dry matter were evaluated according to Silva et al. [15] by a Sartorius MA 45 desiccator (Sartorius AG, Germany). Lipid content was determined as described by Yuwana [16]. The dosage of total sugars was carried out according to the phenol/sulphuric acid method described by Pawar et al. [17]. The total protein content was evaluated according to Hayes [18]. The fibre content was determined through formic insoluble method [19].
2.3. Biochemical characterization of date stone and spirulina crude powders
The phenolic fraction extraction was carried out according to the method of Msaada et al. [20]; 2 g of dry powder was extracted with 10 ml of 80% methanol, stirred for 60 min and then kept for 24 h at 4 °C. The extracts were filtered with a Whatman filter paper (Grade 4), and then stored at −20 °C. Total phenolic content (TPC) was determined by the Folin–Ciocalteu assay according to Msaada et al. [20] and expressed as mg Gallic acid and quercetin equivalents per g dry weight (mgEQ⋅g−1DW). The antioxidants activity was conducted according to the 2,2-diphenyl-1-picrylhydrazyl (DPPH) radical scavenging assay according to Msaada et al. [20] and expressed as IC50 (μg⋅ml−1), the concentration required to scavenge 50% of DPPH free radicals; butylhydroxytoluene (BHT) was used as the positive control. The total chlorophyll content was determined according to Li et al. [21]. The total carotenoid content was extracted using the method of Vila et al. [22]. All experiments were carried out in triplicates, and the results were reported as mean ± standard deviation.
2.4. Phycocyanin extraction and quantification
UV-Visible spectrophotometry was used to measure phycocyanin utilising an external calibration method. The phycocyanin extraction and dosing were performed using the colorimetric method described by Park et al. [23]. In brief, 200 mg of powdered spirulina were pulverised with sea sand and extracted by sonication for 30 min, each with 60 ml of phosphate buffer saline (pH 7.0). After centrifuging, the supernatant was filtered through a 0.45 μm membrane filter. Two hundred microliters of each extract were transferred to a 96 well plate, where the absorbance at 620 nm was measured using a microplate reader. Working calibration solutions in 100–1000 μg⋅ml−1 were made by diluting the phycocyanin stock solution with PBS buffer. To avoid pigment deterioration, all processes were carried out in low-light conditions.
2.5. Preparation of date stone and spirulina tablets using D-Optimal Mixture Design
According to the literature [24], the formulation of a tablet requires the use of various excipients. Excipients, also called “vehicles” or “adjuvants”, are substances which are inactive by themselves, but which facilitate the administration and preservation of the medicinal principle. In our case, date stone powder was used as a natural diluent and binder agent [25]. In a similar study, Adiba et al. [26] found that tablets formulated with 100% spirulina had the most fragile texture with a friability of 1.058% and a relatively long disintegration time (>120 min), hence the need for the addition of other ingredients to ensure the success of the formulation and therefore to ensure the delivery of the active ingredient targeted in our tablet. The galenic formulation of the tablets has been widely discussed in the literature. Recently, the optimization of this formulation has become easier, given the availability of computer tools such as experiment plans and mixing plans [27]; in this context, we will optimize the formulation of the spirulina tablets using date stone powder as a carrier by the D-Optimal Mixture Design method with the three independent factors (Table 1): the amount of date stone powder (X1), the amount of spirulina powder (X2), and the amount of water (X3). The experimental matrix was prepared by mixing 15 ingredients in different quantities (in g). The different mixtures obtained were subjected to hardness, friability and disintegration time assays (Table 2).
Parameters studied in the preparation of date stone and spirulina tablets using D-Optimal Mixture Design
| Code | Parameters | Low level | High level |
|---|---|---|---|
| X1 | Date stone powder | (0) 8 g | (1) 19 g |
| X2 | Spirulina powder | (0) 80 g | (1) 90 g |
| X3 | Water content | (0) 1 g | (1) 2 g |
Independent factors levels are expressed in coded values (in brackets) and experimental values in g.
The experimental matrix of the preparation of date stone and spirulina tablets using D-Optimal Mixture Design
| Formula | Independent factors | Responses | ||||
|---|---|---|---|---|---|---|
| X1 | X2 | X3 | Y1 | Y2 | Y3 | |
| Date stone powder (g) | Spirulina powder (g) | Water content (g) | Hardness (Kp) | Friability (%) | Disintegration time (s) | |
| F1 | 1 (19) | 0 (80) | 0 (1) | 12.24 | 0.16 | 627 |
| F2 | 0 (9) | 1 (90) | 0 (1) | 18.61 | 0.28 | 1026 |
| F3 | 0 (9) | 0 (80) | 1 (2) | 14.02 | 0.17 | 594 |
| F4 | 0.5 (14) | 0.5 (85) | 0 (1) | 18.61 | 0.28 | 1026 |
| F5 | 0.5 (14) | 0 (80) | 0.5 (1.5) | 15.03 | 0.17 | 620 |
| F6 | 0 (9) | 0.5 (85) | 0.5 (1.5) | 18.80 | 0.31 | 1117 |
| F7 | 0.75 (16.5) | 0.25 (82.5) | 0 (1) | 18.60 | 0.28 | 1022 |
| F8 | 0.25 (11.5) | 0.75 (87.5) | 0 (1) | 19.24 | 0.32 | 1395 |
| F9 | 0.75 (16.5) | 0 (80) | 0.25 (1.25) | 16.17 | 0.19 | 667 |
| F10 | 0.5 (14) | 0.25 (82.5) | 0.25 (1.25) | 18.44 | 0.27 | 965 |
| F11 | 0.25 (11.5) | 0.5 (85) | 0.25 (1.25) | 19.07 | 0.36 | 1308 |
| F12 | 0 (9) | 0.75 (87.5) | 0.25 (1.25) | 19.16 | 0.39 | 1392 |
| F13 | 0.25 (11.5) | 0.25 (82.5) | 0.5 (1.5) | 18.02 | 0.24 | 858 |
| F14 | 0.25 (11.5) | 0 (80) | 0.75 (1.75) | 14.65 | 0.17 | 609 |
| F15 | 0 (9) | 0.25 (82.5) | 0.75 (1.75) | 16.96 | 0.24 | 867 |
Independent factors are expressed in coded values and experimental values in g (in brackets), All the experiments were carried out in triplicates.
2.6. Tablets preparation
According to Obaidat and Obaidat [28], a portion of date stone and spirulina powder combination (F1 to F15 in Table 2) was mixed with water as a diluent for 20 min. The mixture was passed through a 0.25 mm sieve, stirred, and blended in a plastic bag. The mixture was subsequently compressed using a single punch tablet press (ERWEKA GmbH, Germany) and 9 mm diameter circular punches with flat faces under 2 × 10³ kg compression. The machine parameters were changed to create tablets with the same hardness and mass; 15 formulations with a target mass of 400 mg were generated.
2.7. Tablets physical evaluation
Tablet hardness measurement was performed using the ERWEKA TBH 30 MD equipment (ERWEKA GmbH, Germany). Hardness was expressed in kiloponds (kp) [29]. The tablets’ friability was tested using ERWEKA TA 40 (ERWEKA GmbH, Germany) at 20 rpm for four minutes and stated as a percentage [30]. Disintegration time was performed according to Shiyani et al. [31]. Disintegration time was carried out in 800 ml of the various media at 37 ± 0.5 °C. The swelling assay was realised by weight measurement. The experiments were performed in a USP 23 dissolution apparatus II according to Pharmacopoeia [32]. The tablets were placed in a dissolution flask and immersed in the phosphate buffer pH 5.8 or gastric fluid at 37 ± 0.5 °C for 5, 15, 25, 60, 75 and 90 min. The erosion assay followed immediately the swelling test. This test consists of determining the dry weight of a wet tablet after incubation at 80 °C for 24 h [33]. All tests were run in triplicate using ten tablets for each one.
2.8. Kinetics release of the phycocyanin
The release investigations were carried out using a USP dissolving apparatus II [32] equipped with paddles and operated at a speed of 50 rpm to investigate the effects of release medium on drug release. Nine hundred millilitres of either standard simulated gastric fluid (SGF, pH 1.2) or standard simulated Intestinal Fluid (SIF, pH 6.8) was placed in the glass vessel as the dissolution medium, the apparatus was then assembled and maintained at 37 ± 0.5 °C. The amount of phycocyanin released was calculated as a percent (recovered content) from 3 to 33 min [34].
2.9. Statistical analysis
One-way and multivariate analysis of variance (ANOVA) followed by Duncan’s multiple range test and Tukey’s test were performed by SPSS 15 (SPSS Inc. Chicago, IL, USA). D-optimal Mixture Design was performed by NemrodW (LPRAI, version 2000) software.
3. Results and discussion
3.1. Characterization of date stone powder
Table 2 summarizes the characterization of date stone powder; the moisture content is a crucial parameter for powder manipulation. It affects the rheological properties during the formulation of the tablet [35]. The moisture content of the date stone powder was 10.78 ± 0.24%. This value is compatible with that found by Azodi et al. [36] with a percentage of 10.5%, and it is also close to the value found by Hamada et al. [37] (9.375%). The fat content of date stone powder was 3.78 ± 0.07% (Table 3). This value is close to the results given by Juhaimi et al. [38], which vary between 4.68% and 7.96%. In a study carried out on Tunisian varieties (Mabsili, Um-Salah and Shahal), they found values between 5 and 6% [39]. The total carbohydrate content of the date stones powder was 60.46 ± 5.6% (Table 3). This value is very close to that of Rahman et al. [40] (62.31%). In addition, Besbes et al. [14] determined the total sugar content of two varieties of Tunisian date stones. They found 81% for Allig and 83.1% for the Deglet Nour variety. Therefore, the percentage of total sugars depends on the variety of dates studied. The amount of nitrogenous matter in the date stones powder was 4.63 ± 0.03% (Table 3). According to literature, Hussein and Alhadrami [41] determined the protein percentage of date stones of 23 varieties. They found values that vary between 2.3% and 6.9%. Lecheb et al. [39] confirmed that the variety of dates might influence the variation in protein content. Other authors studied the chemical composition of date stones of 7 varieties. They found a protein content value between 3.71% and 5.47% [38]. Compared to other by-products, date stones have the highest nitrogen content (4.30% in date stalks) [42]. The cellulose and lignin content in the date stone powder was 32.95 ± 1.44% (Table 3). Several authors reported the richness of date stones in dietary fibres. AL-Kahtani et al. [43] reported that the total dietary fibre in date stone was 58%, of which 53% was insoluble dietary fibre (hemicellulose, cellulose, and lignin). These results agreed with those reported in our work. The difference may be due to the varieties studied, the process for obtaining the powder, or the dietary fibre assay method. Alamri et al. [44] indicated that date stones have high percentages of dietary fibre which vary between 22.50 and 80.20%. Dietary fibre can help prevention against hypertension, coronary heart disease, high cholesterol, cancers and intestinal disorders [45, 46, 47, 48, 49]. The carotenoid content in the date stones was 25 ± 0.7 μg∕100 g of powder (Table 3); this value is lower than that obtained by Boudries [50], which varies between 0.051 and 0.145 mg/100 g of fresh matter. This difference may be due to the use of different varieties of date stone powder (4 varieties).
Chemical composition of date stone and spirulina powder
| Date stone | Spirulina | |
|---|---|---|
| Moisture content (%) | 10.78a ± 0.23 | 5.85b ± 0.11 |
| Carbohydrate (%) | 60.46a ± 5.6 | 8.74b ± 0.24 |
| Proteins (%) | 4.63b ± 0.03 | 63.73a ± 0.02 |
| Lipids (%) | 3.78b ± 0.07 | 5.92a ± 0.18 |
| Fibbers (%) | 32.95a ± 1.44 | 3.55b ± 0.23 |
| Carotenoids (mg/100 gDW) | 0.025b ± 0.7 | 451.38a ± 12.5 |
| Chlorophylls-a (mg/gDW) | - | 4.59 ± 0.15 |
| Chlorophylls-b (mg/gDW) | - | 0.47 ± 0.01 |
| Chlorophylls-c (mg/gDW) | - | 1.13 ± 0.02 |
| Phycocyanin (mg/gDW) | - | 104.36 ± 5.1 |
| Phenolic content (mgEAG⋅g−1DW) | 4.74a ± 0.17 | 36.4b ± 2.08 |
| DPPH IC50 (μg⋅ml−1) | 86.5a ± 2.04 | 27.71b ± 1.4 |
The values shown in this table were the mean of triplicates and given as mean ± SD (n = 3). A one-way ANOVA followed by Duncan’s multiple range test was used. Values with different letter were significantly different at P < 0.05.
3.2. Characterization of spirulina powder
The characterization of spirulina powder is given in Table 3. The moisture content of powders is one of the main factors that limit the manufacture
of tablets. It facilitates their quality of production by referring to the design of the compression process [51]. The moisture content of spirulina powder was about 5.85 ± 0.11%. This value was found to be in the range of 4 to 7% by Sguera [52] and is also equivalent to that reported by Branger et al. [53]: 5.4%. The percentage of lipids content was equal to 5.92 ± 0.18% (Table 3). This value is higher than that given by the “French Oil Institute” and found by Agustini et al. [54]; these authors studied the composition of spirulina powder in lipids and they gave a value of 2.86% [55]. The estimated value of sugar content was 8.74 ± 0.24% (Table 3), which was slightly lower than that found by Gershwin and Belay [56] (15–25%), and it is also close to that provided by N’Djamena [57]. The results given by these authors are between 13.8% and 14.2%. This variation in total sugar rate depends on the spirulina’s production site. In addition, other researchers have found a rate very close to our results. Agustini et al. [54] have shown that the percentage of carbohydrates contained in spirulina is between 11.74 and 12.73%. The remarkable protein content of spirulina (60 to 70%) makes it an exceptional food. Numerous analyses have indeed revealed particularly interesting nutritional properties: balanced protein composition, presence of rare essential lipids, numerous minerals and vitamins [58]. The protein content in biomass was determined using the Kjeldahl method [59] using a correction factor of 5.22 specific for microalgae. As seen in Table 3, protein content in the spirulina powder was 63.73 ± 0.02% of powder. This observed value was in accordance with previous found content (60 to 70%) [60]. Moreover, Sharoba [61] gave a value of 62.84% very close to our results. The quantification of spirulina pigments is given in Table 3: 4.59 mg chlorophyll-a, 0.468 mg chlorophyll-b and 1.13 mg chlorophyll-c in 100 g of spirulina powder. Sguera [52] showed that the chlorophyll-a content in spirulina powder varies between 6.1 and 7.4 g/kg. On the other hand, Park et al. [23] accomplished the quantification of different chlorophyll-a from commercial spirulina and it gave total chlorophyll content between 2.6 and 10.8 mg/g. Concerning the carotenoid content, a value of 451.38 ± 12.5 mg∕100 g dry matter was found with our powder, a value in agreement with the results found by Park et al. [23]. The differences may be due to the growth factors and to the efficiency of the method used for the extraction and separation of the different pigments [62].
3.3. Phycocyanin content
Phycocyanin is the only natural blue food colorant authorized in Europe and it is also used in some cosmetic products [63]. This phytopigment fluorescent protein absorbs and captures photons then transforms this light energy into electro-biochemical energy [64]. The bilin group that constitutes it is very close to human bile pigments, which could explain its detoxifying and hepatoprotective activity [65]. Phycocyanin has the ability to develop beneficial properties for the health of consumers, demonstrated during numerous experiments carried out in vitro and in vivo in different animal models. The liquid extract of fresh spirulina allows to have a total bio-availability of the molecules in their native forms. Several studies show that spirulina or its extracts can prevent or inhibit cancers in humans or animals [6]. Quantitative analysis of phycocyanin in spirulina powder shows that it is a major pigment with a rate of 104.36 ± 5.1 mg⋅g−1DW (Table 3). These results are in agreement with the literature which presumes that phycocyanin is the only abundant pigment present in blue-green algae. Our results were comparable to that given by Park et al. [23] who found that the commercial spirulina powder can contain 153.3 mg phycocyanin per gDW. However, the quantity of these pigments varies according to the culture conditions, where the light intensity to which the cells are exposed, constitutes an important parameter [66]. Likewise, a study conducted by Hoi et al. [67] demonstrates that the pigment concentration is limited by the nitrogen level in the culture medium.
3.4. Phenolic composition and antioxidant potential
The dosage of total phenolic content gives us an overall estimate of the content of different classes of phenolic compounds contained in the powders’ methanolic extract. As shown in Table 3, the average phenolic content in date stones powder was 4.74 ± 0.17 mgEAG⋅g−1DW. Date seeds of 14 Iranian date varieties have previously been examined for total phenol content and it was reported that the content ranged from 459 to 3284 mgEAG⋅100 g−1DW [68]. Similarly, Metoui et al. [69] studied the total phenol contents of 11 varieties of Tunisian date seeds and their results vary between 5.224 and 9.532 gEAG⋅100 g−1DW. For spirulina powder, total phenolic content was 36.4 ± 2.08 mgEAG⋅g−1DW. Similar contents have been reported concerning the total phenolic content in Spirulina platensis by Şahin [70] and they found it to be about 34.22 mgEAG⋅g−1DW. DPPH assay is given in Table 3. The results show that there are significant differences between examined biomass. Regarding the date stone extract, the results reveal that the methanolic seeds extract confirms an IC50 of 86.5 ± 2.04 μg⋅ml−1; on the other hand, the spirulina extract had an IC50 of 27.71 ± 1.4 μg⋅ml−1. We note that only spirulina had an activity close to ascorbic acid which has an IC50 of 23.22 μg⋅ml−1. According to Metoui et al. [69], it was found that the DPPH radical inhibition could attain 55.47% for the Korkobi date variety when using palm date seeds extract at a concentration of 23.6 μg⋅ml−1. In an Algerian study (Djaoudene et al. [71]) about date seeds (Phoenix dactylifera L.), the Ouaouchet and Ourous cultivars extracts displayed the most potent antioxidant capacity against DPPH free radicals (IC50 = 37.30 μg⋅ml−1). Our results were in accordance with those found by Agustini et al. [54], who found that the IC50 of spirulina extract was equal to 33.07 μg⋅ml−1.
3.5. Experimental design methodology
In order to determine the effect of the percentage of date stone, spirulina powder and water and their interactions on the quality of our tablets, we used the D-Optimal Mixture Design in Optimizing 3-factor design. Table 2 illustrates the 15 tests results carried out according to the factorial model describing the combination between the different levels of the factors.
The response model proposed by the D-Optimal Mixture Design is written as follows:
Y: the studied response
b1, b2, b3: coefficient linked to the following factors: percentage of date stone powder, spirulina powder and water content.
b12, b13 and b23: coefficients linked to the crossing of the three factors.
3.5.1. D-Optimal Mixture Design validation
The validation of this model was based on the verification of three statistical tests; the model’s linear Pearson coefficient of determination (R2), the analysis of variance and the analysis of residuals. The coefficient of determination was 0.91, 0.90 and 0.89 for hardness, friability and disintegration time, respectively. Statistically, R2 is a measure of the quality of the prediction of a linear regression. The closer the coefficient of determination is to 0, the more the cloud of points is dispersed around the regression line. On the contrary, the more R2 tends towards 1, the more the cloud of points tightens around the regression line [72]. In our study, all the coefficients were close to 1, which confirms the good distribution of hardness, friability and disintegration time responses according to the proposed model. The adjusted R-squared (R2 ⋅ adj) for hardness, friability, and disintegration time were 0.86, 0.84, and 0.82, respectively. Their values are very close to the values of R2. This proves that all significant terms have been included in the empirical models.
The analysis of variance is illustrated in Table 4. The ratio of the sum of squares and mean square for hardness, friability and disintegration time (17.83, 15.89 and 13.9, respectively) were superior to 4.77 extracted from the Fisher–Snedecor Law Table at α = 5% for (5,9) as degrees of freedom [73]. Consequently, the significant variables (X1, X2, X3), applied to intricate the three response models, were highly significant on their responses (hardness, friability and disintegration time). For residues analysis, Figure 1 shows the distribution of the residues versus probability for the three responses. The points were virtually randomly dispersed, showing that the errors found by our model are not systematic.
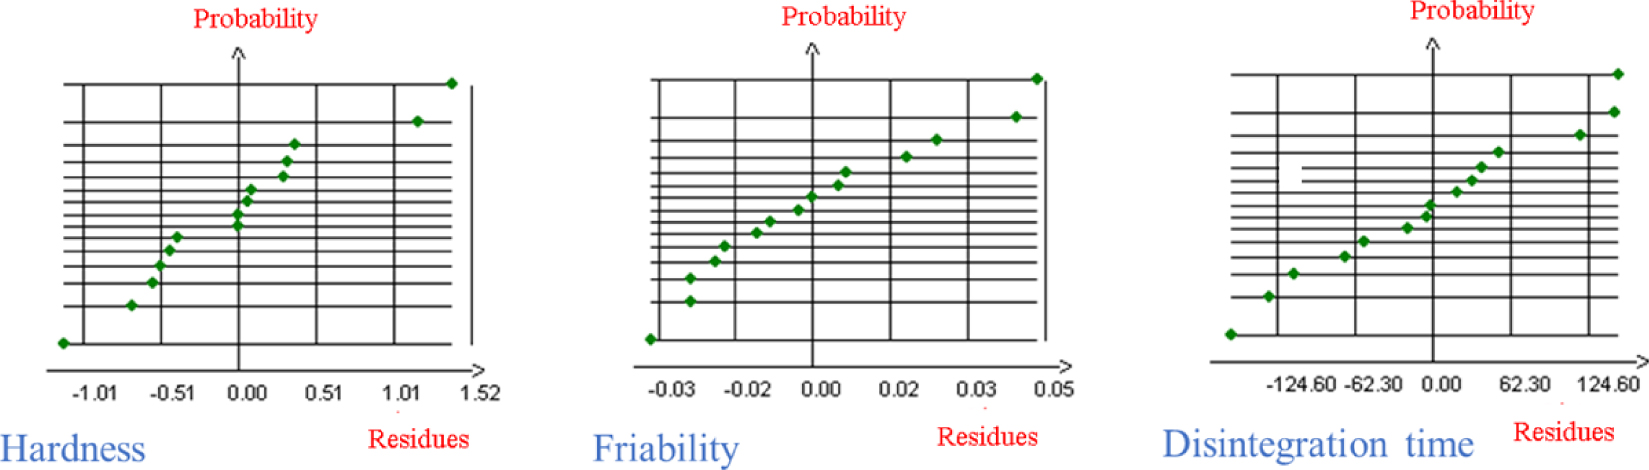
Probability versus residues values for hardness, friability and disintegration time.
Proposed model validation parameters
| Sum of squares | Degrees of freedom | Mean square | Ratio | Signification | ||
|---|---|---|---|---|---|---|
| Hardness | ||||||
| Regression | 62.89 | 5 | 12.58 | 17.83 | p < 0.001∗∗∗ | |
| Résidus | 6.35 | 9 | 0.71 | |||
| Total | 69.23 | 14 | ||||
| R2 | 0.91 | |||||
| R2 ⋅ adj | 0.86 | |||||
| Friability | ||||||
| Regression | 0.07 | 5 | 0.01 | 15.89 | p < 0.001∗∗∗ | |
| Résidus | 0.01 | 9 | 0 | |||
| Total | 0.07 | 14 | ||||
| R2 | 0.90 | |||||
| R2 ⋅ adj | 0.84 | |||||
| Disintegration time | ||||||
| Regression | 989,104 | 5 | 197,821 | 13.9 | p < 0.001∗∗∗ | |
| Résidus | 128,060 | 9 | 14228.9 | |||
| Total | 1,117,160 | 14 | ||||
| R2 | 0.89 | |||||
| R2 ⋅ adj | 0.82 | |||||
3.5.2. Significance of the factors for the three responses hardness, friability and disintegration time
The results of the present study (Table 5) show that the three factors (X1, X2 and X3) exert a highly significant influence on hardness, friability and disintegration time of the tablets. For the interaction effect, the results obtained (Table 5) show that the interaction b12 (date stones—Spirulina) was the most significant with a positive coefficient of 13.96 for the hardness. This translates physically into the fact that the hardness of the tablets increases with the date stone and spirulina powder content. For friability, the interaction b23 was the most significant one, with a positive coefficient 0.42. The same trend was found for disintegration time with 1295.23 as a coefficient. This is physically explained by the increase in friability and disintegration time following the increase in water and spirulina powder. By replacing the significant coefficients in the equations of the model, we can describe for each factor its own equation:
Coefficients values and their statistical significance for different responses
| Coefficient | Hardness | Friability | Disintegration time | |||
|---|---|---|---|---|---|---|
| Value | Signif (%) | Value | Signif (%) | Value | Signif (%) | |
| Linear effects | ||||||
| b1 | 13.38 | ∗∗∗ | 0.18 | ∗∗∗ | 632.13 | ∗∗∗ |
| b2 | 18.24 | ∗∗∗ | 0.30 | ∗∗∗ | 1157.69 | ∗∗∗ |
| b3 | 13.72 | ∗∗∗ | 0.15 | ∗∗∗ | 540.44 | ∗∗∗ |
| Quadratic effects | ||||||
| b12 | 13.96 | ∗∗ | 0.28 | ∗ | 1174.20 | ∗ |
| b13 | 8.14 | ∗ | 0.06 | 62.40% | 141.77 | 75.30% |
| b23 | 10.93 | ∗∗ | 0.42 | ∗∗ | 1295.23 | ∗ |
Signif, %: p-value < 0.05 (∗), p < 0.01 (∗∗), p < 0.001 (∗∗∗) mean significant, very significant and strongly significant, respectively.
With these models, it is possible to calculate all the responses in the study area by assigning values to levels X1, X2 and X3 to immediately obtain the content of each response.
3.5.3. Analysis and optimization of the response surface
According to Mohamad Zen et al. [30], in statistical methods, the response surface design is used to discover the effects of process variables on the specific responses of a system. In our study, the surfaces for the three responses hardness, friability and disintegration time, are shown in Figure 2. The contour plots of the mixture show that hardness decreased significantly with the addition of water and date stones powder. This observation was confirmed for friability and disintegration time. The graphical search for the optimal zeta potential showed that the percentage of spirulina powder clearly correlated with the increase in all responses. Indeed, these observations were consolidated by the analysis of the coefficients of Table 5, the interaction b12 and b23 was distinguished by a positive coefficient for all the responses. The effect of moisture on tablet formulation has been widely studied, and it has been demonstrated that increased moisture causes deterioration of tablets by increasing the percent friability [74].
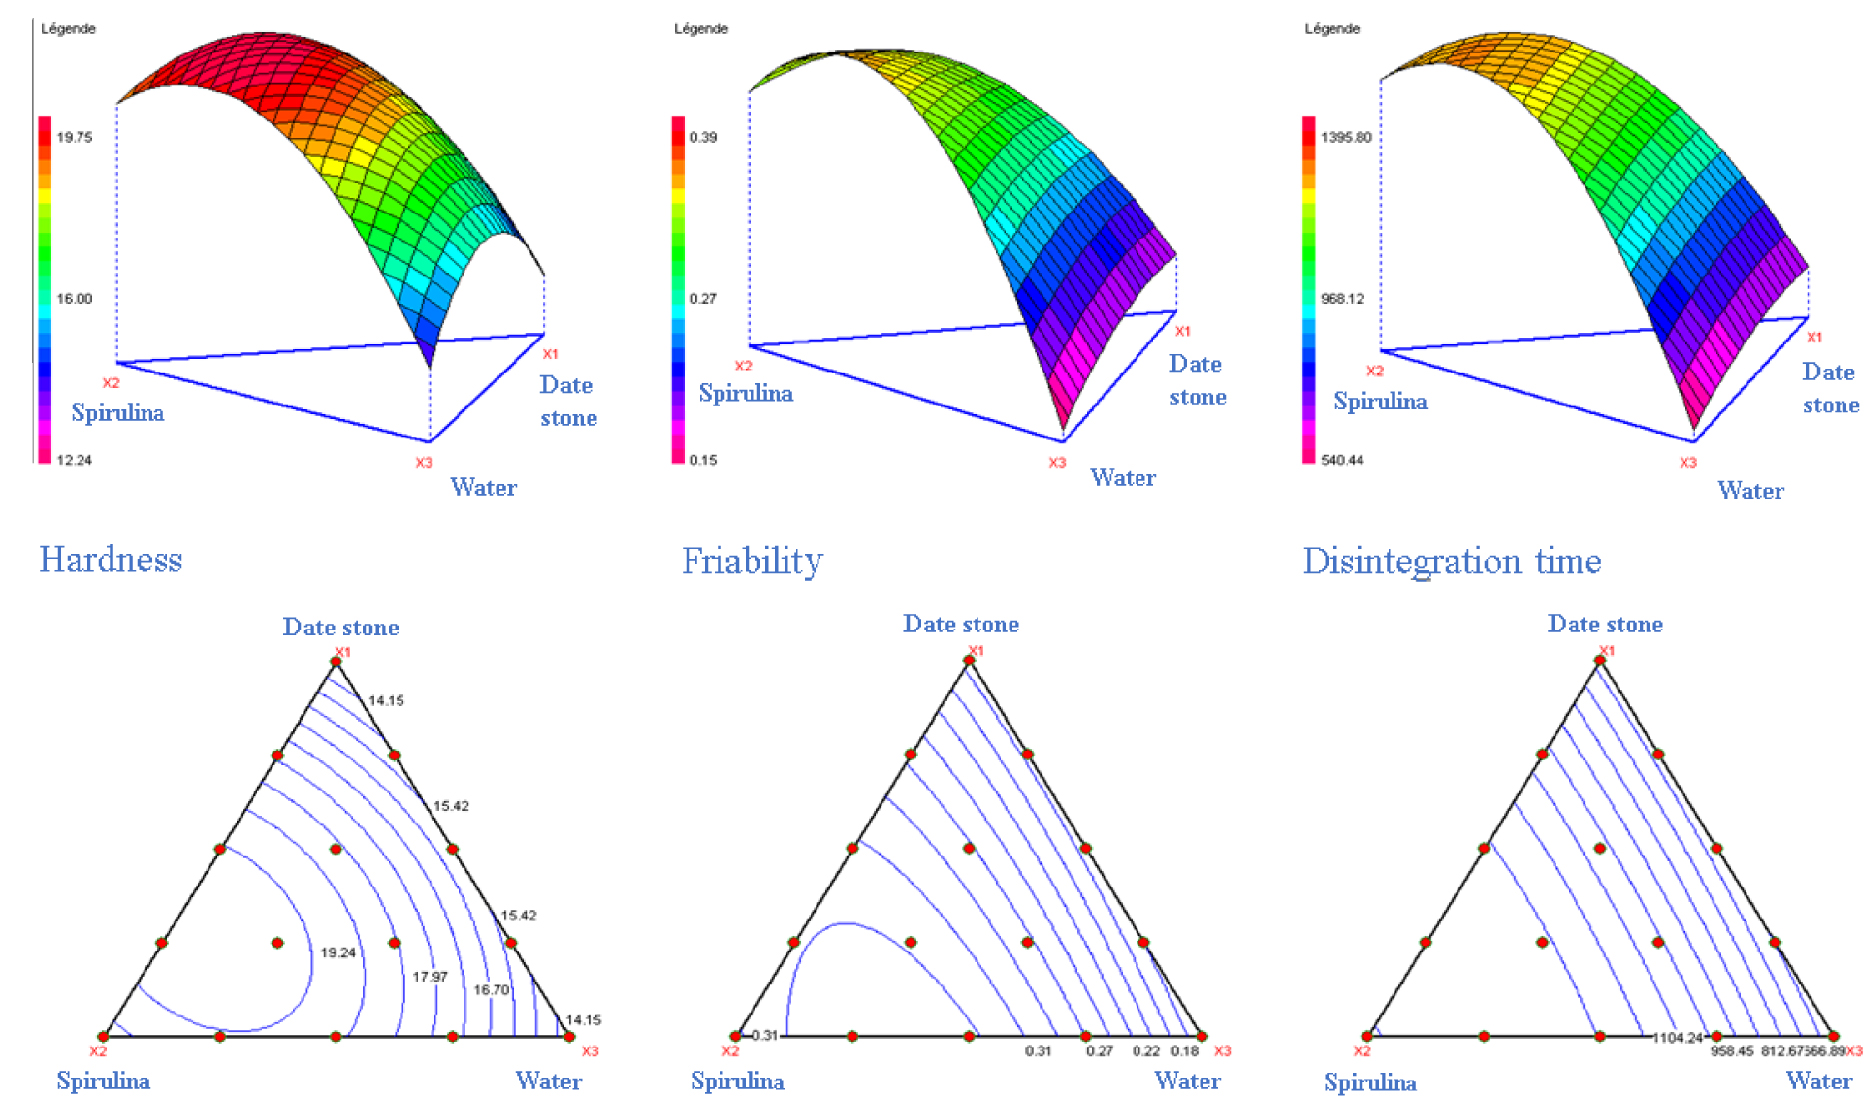
3D and 2D graphical study of response surface optimization for hardness, friability and disintegration time.
3.5.4. Desirability study
The NemrodW software for D-Optimal Mixture Design processing made it possible to simultaneously optimize the three responses, as it is an entirely numerical procedure which allows the mathematical search for a combination of formulation parameters for which the desired responses are optimal. The software used uses these functions for each response, a curve profile of the desirability function is chosen (Figure 3). The desirability (D) is zero for an unsuitable answer and is maximum when the given answer is very satisfactory. The desirability prediction was programmed to be at 100% for increasing the hardness to the superior limit found in the experimental matrix (19 kp), friability was minimized to 0.16%, and disintegration time to 600 s. These limits represent the best values found in our previous section. Table 6 gives the constituent values of the tablet formulation with a D of 97% which gives us the optimal tablet formula with the ingredient proposals proposed by the function. The optimal formula was 13.83 g date stone powder, 81.2 g spirulina powder and 1.4 g water.
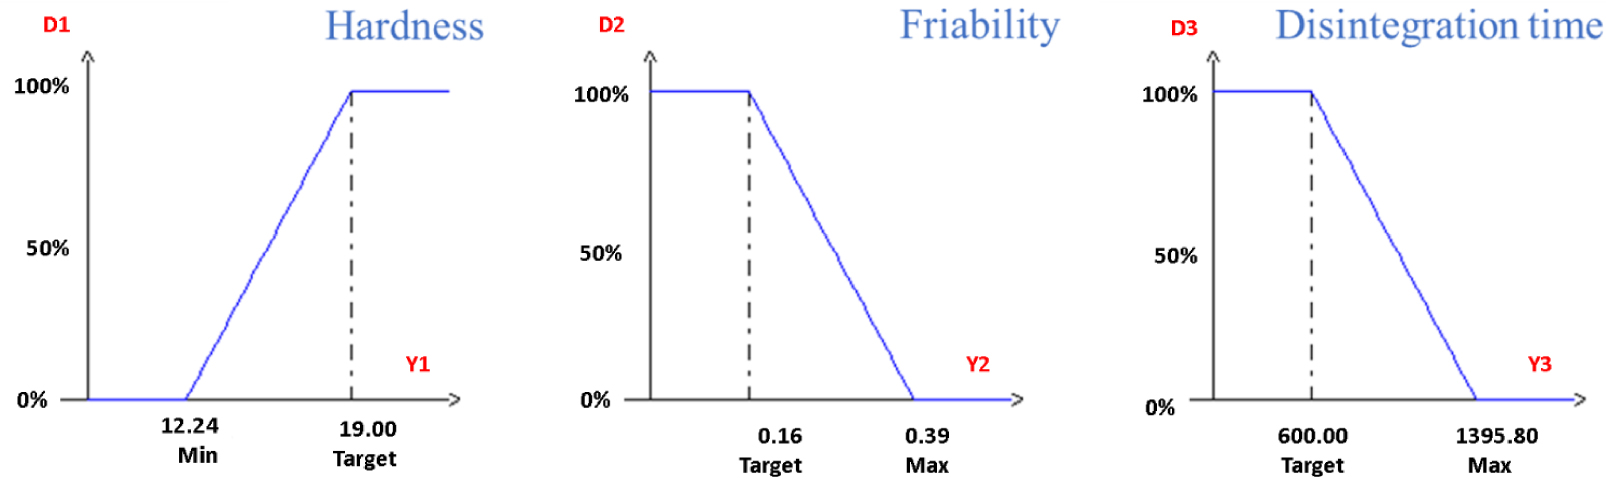
Desirability study for hardness, friability and disintegration time.
Desirability results and optimal formulation parameters
| Responses | Values | D % | Factors | Coded values | Real values (g) |
|---|---|---|---|---|---|
| Hardness | 15.75 | 100.00 | Date stone powder | 0.53 | 13.83 |
| Friability | 0.18 | 91.27 | Spirulina powder | 0.12 | 81.2 |
| Disintegration time | 642.25 | 100.00 | Water content | 0.4 | 1.4 |
| Total Desirability: 97% | |||||
3.6. Physicochemical characterization of tablets
The results of the physicochemical properties of the tablets formulated according to the results of previous section are summarized in Table 7. The physical parameters of the tablets showed that the optimal formulation gave a uniform and stable tablet. This was confirmed by friability measurement which was comparable to that predicted by the statistical analysis (0.18 ± 0.03%). Likewise, for the disintegration time (625 ± 12 s). The composition analysis revealed a richness in carbohydrates, proteins, lipids and fibres (36.01 ± 5.36, 32.68 ± 5.02, 4.88 ± 0.22 and 16.25 ± 1.82%, respectively). The antioxidant activity was characterized with a DPPH IC50 of 47.31 ± 3.4 μg⋅ml−1 with a polyphenol content of 18.75 ± 3.01 mgEAG∕tablet.Phycocyanin was also dosed and an amount of 417.44 ± 19.32 μg∕tablet has been recovered.
Physicochemical characteristics of the tablets
| Characteristics | Values |
|---|---|
| Weight (mg) | 402 ± 5.20 |
| Hardness (Kp) | 13.69 ± 2.01 |
| Thickness (mm) | 4.04 ± 0.08 |
| Diameter (mm) | 9 ± 0.36 |
| Friability (%) | 0.18 ± 0.03 |
| Disintegration time (sec) | 625 ± 12 |
| Humidity (%) | 1.77 ± 0.12 |
| Carbohydrate | 36.01 ± 5.36 |
| Proteins | 32.68 ± 5.02 |
| Lipids | 4.88 ± 0.22 |
| Fibres | 16.25 ± 1.82 |
| Total polyphenol content (mgEAG/tablet) | 18.75 ± 3.01 |
| Antioxidant activity: DPPH IC50 (μg⋅ml−1) | 47.31 ± 3.4 |
| Phycocyanin (μg/tablet) | 417.44 ± 19.32 |
The values shown in this table were the mean of triplicates and given as mean ± SD (n = 3).
3.7. Swelling and erosion test
Once consumed, the tablets enter the digestive tract or the stomach and will undergo a spontaneous process of adsorption by macromolecules accompanied by a significant increase in volume. In order to study the rheological behaviour of the constituents of two solid matrices (powder of date stones and spirulina) at the level of the digestive system, simulated gastric fluid (SGF, pH 1.2) and simulated intestinal fluid (SIF, pH 6.8) were used. As shown in Figures 4A and B, the rate of swelling and erosion depended on the ingestion time and type of medium. The tablet placed in distilled water was the least swollen, followed by SIF and then SGF. This shows that the capacity of our tablet to adsorb water depends on the pH and it was higher with an acidic pH. This observation can be explained by the protonation of the compounds which constitute our tablet rich in carbohydrates and fibres. Protonation promotes the formation of hydrogen bonds which stabilizes the swelling. Our results were in agreement with that found by Akhgari et al. [75] that the swelling and erosion of a pectin-based tablet depends on the pH of the medium, and that this biopolymer decreases the rate of swelling which can influence tablet stability.
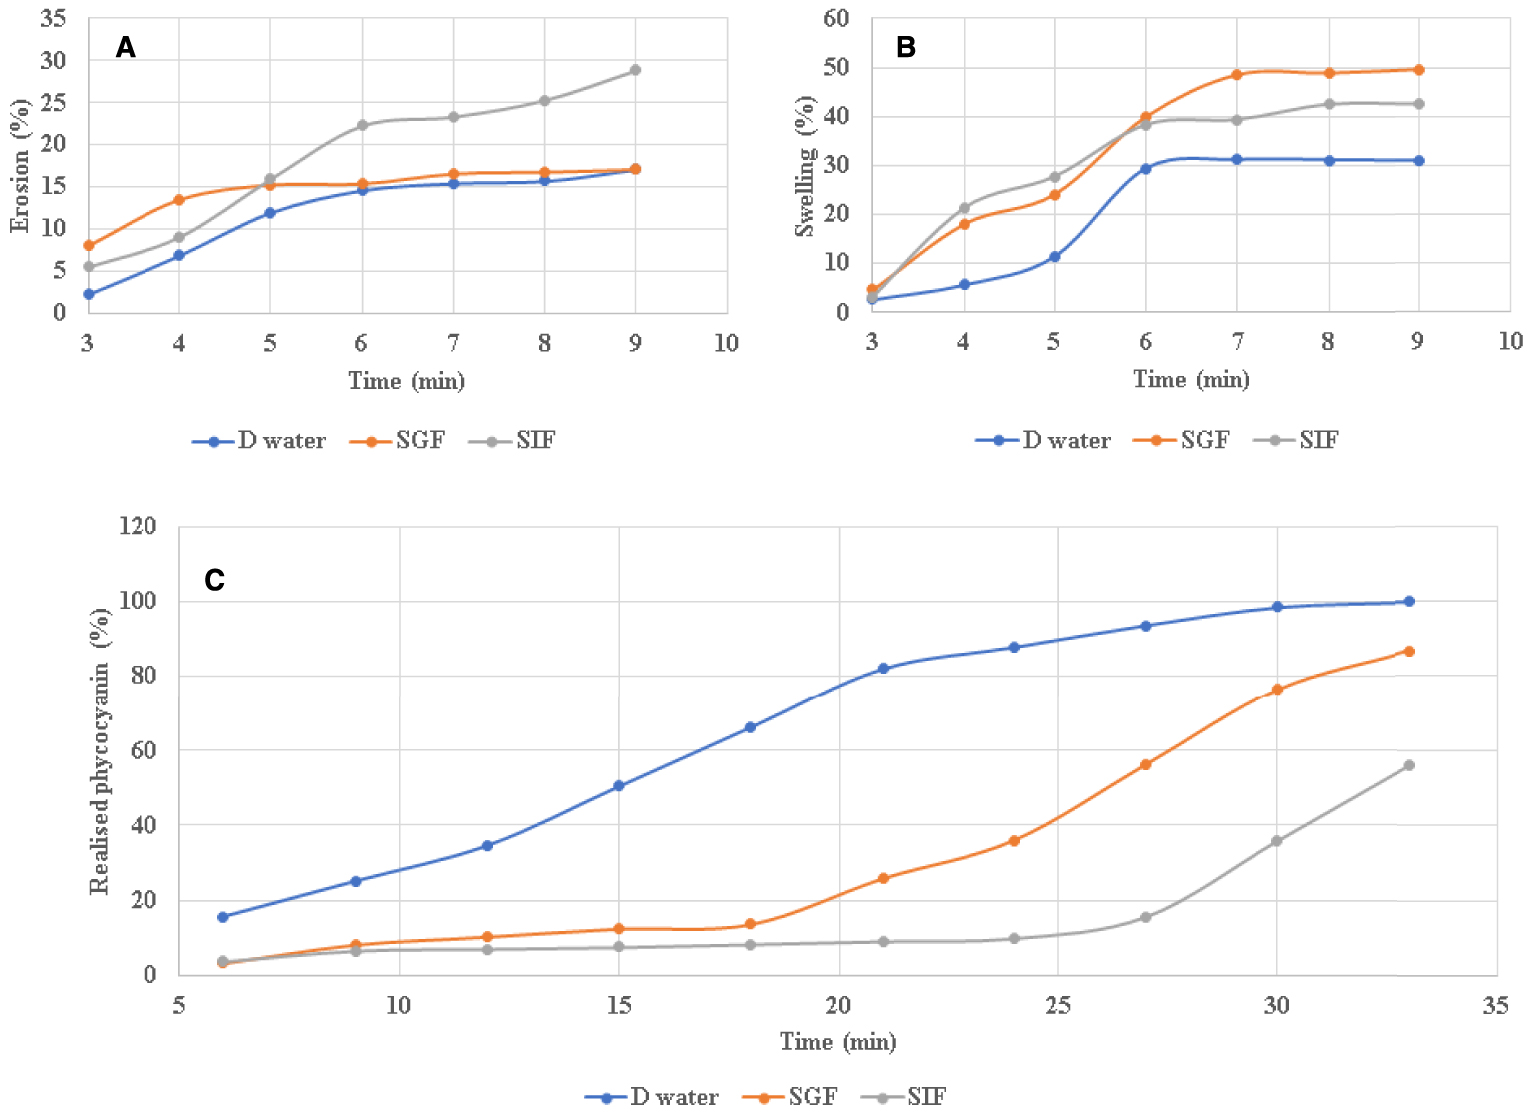
Swelling (A) and erosion (B) test of the spirulina tablets in distilled water (D water), simulated gastric fluid (SGF) and simulated intestinal fluid (SIF), (C) Phycocyanin release rate as a function of immersion time in different solutions of spirulina tablets.
3.8. In vitro phycocyanin release study
The ability of tablets to dissolve and release their active ingredients is naturally affected by how well they can break apart and disintegrate in the body. If a tablet cannot erode or disintegrate effectively, it may not release its active ingredients as intended, which could affect its effectiveness [76]. The in vitro phycocyanin release profiles from the tablets prepared with date stone and spirulina powders were studied in SGF (pH 1.2) and SIF (pH 7.4) using USP dissolution apparatus according to Pharmacopoeia [32]. As seen in Figure 4C, the release rate of phycocyanin from formulated tablets increases significantly in distilled water (100% in 30 min) compared to the other media. Thus, tablets showed a slower release rate in the acidic medium (56.20% in 30 min). This variation may due to the structure of the carrier used in tablet formulation [77]. In SIF, the dissolution of the tablet favoured a slow diffusion of the active principle towards the external environment. Sustained release forms are designed to reduce the frequency of administration of drugs with short elimination half-lives and short duration of action [78]. These forms also limit fluctuations in the plasma concentration of the drug, ensuring a more regular therapeutic effect while minimizing side effects [79]. The sustained release of antioxidants and anti-inflammatories has been very effective and in high demand by drug developers [77].
3.9. Fourier transform infrared (FTIR) spectroscopic analysis of tablets
As seen in Figure 5, the following functional categories are represented by the FTIR analyses of the date stone and the spirulina tablets. The O–H stretching vibration, representing the carbohydrates, and the presence of amino acids were all represented by the frequency range from 3700 to 3200 cm−1 in the FTIR spectrum. The existence of secondary amines (protein, lipid) in the N–H stretching vibration was represented by frequency ranges from 3300 to 3000 cm−1, while the presence of aliphatic C–H stretching vibration is represented by frequency ranges from 2980 to 2830 cm−1. The frequency ranges between 1750 and 1710 cm−1 are a representation of the vibration of C=O (ester and amino acid). The N–H bending vibration in the β-carbonyl unsaturated keto-amide is made up of the 1640–1590 cm−1. The frequency ranges from 1445–1400 cm−1 resulting from − CH2 bending vibration (CH2–CO–) indicated the presence of carbonyl compounds. The particular frequency ranging 1360–1250 cm−1 characterized the C–O stretching. O–H bending vibration confirmed the presence of alcohol. The frequency ranges from 1310–1240 cm−1 confirmed presence of C–O asymmetric C–O–C stretching (presence of esters), the bond with frequency value representing the 1070–1000 cm−1 range corresponds to the symmetric stretching vibration of –SO3, indicating the presence of sulphonate bonds. The S–O stretching vibration of sulphonic components can be detected by frequencies ranging from 700 to 600 cm−1. The observations of the protein, lipid, sulphonate and amino acid content were to categorize spirulina powder. The results obtained after the functional study confirmed by FTIR showed the dominance of the specific functions of spirulina. Its richness in proteins was confirmed by the carbonyl beta-unsaturated keto-amide (C=N) groups, and the sulfated polysaccharides were confirmed by R–SO3 functions. Our study agrees with the work of Dotto et al. [80] where they found that the main intensity bands of spirulina were located at 3269, 2918, 1660, 1627, 1548, 1409, 1028, and 850 cm−1. At 3269 cm−1, the O–H bond stretching combined with the NH2 group may be seen. The peak of 2918 cm−1 is related to the stretching of CH2. At 1660 cm−1, NH2 groups may be seen scissor bending. C=C stretching may be seen at 1627 and 1548 cm−1. The bands at 1409 and 1028 cm−1 are perhaps –S–O and –P–O, respectively. Similarly, Venkatesan et al. [81] recorded spirulina FTIR spectra in the region of 3428–3320 cm−1 to 620–490 cm−1 in the different frequency ranges.
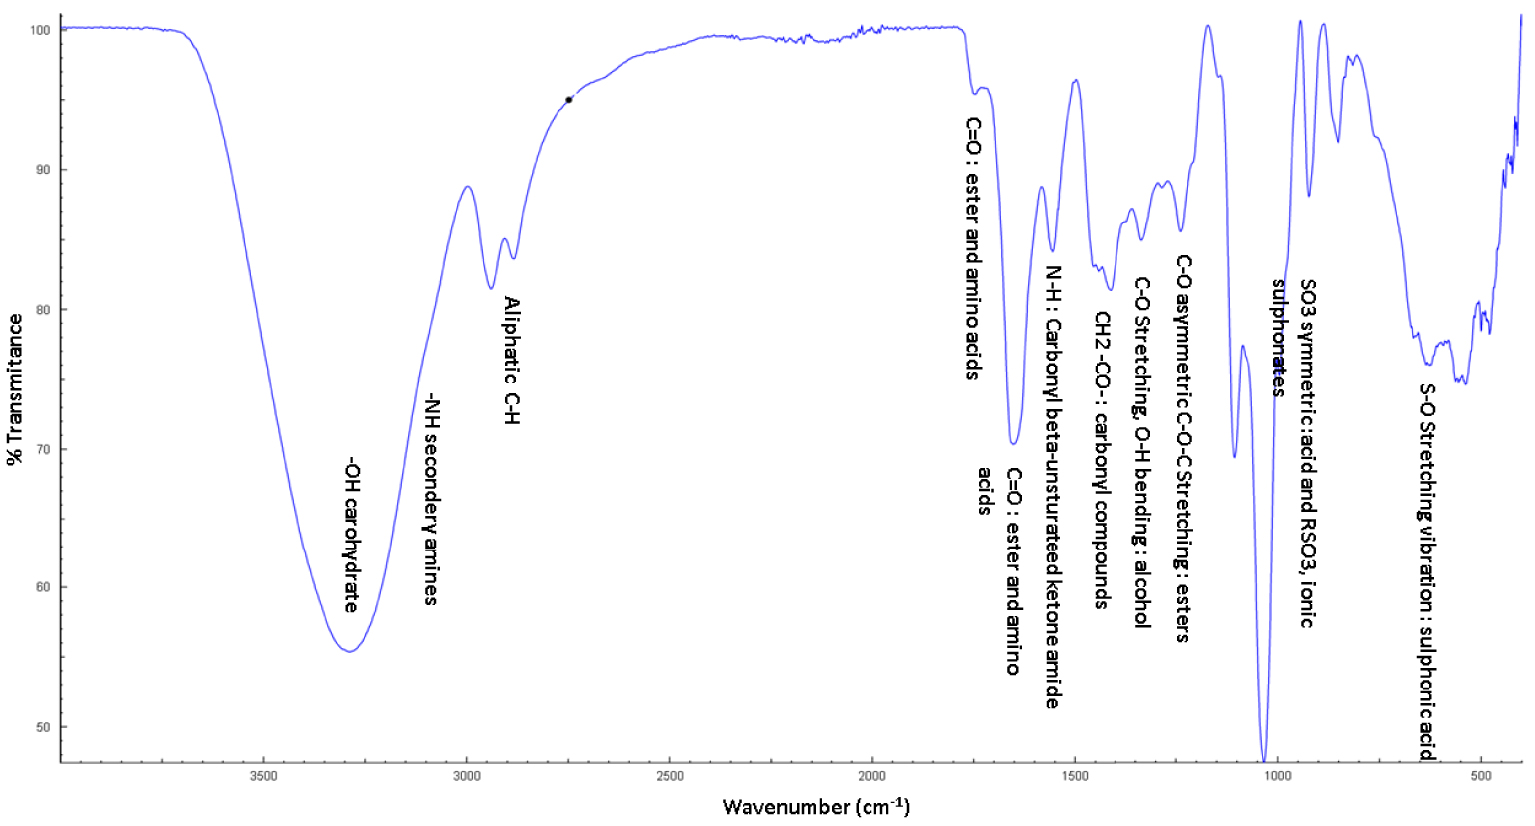
Fourier transform infrared (FTIR) spectroscopic spectrum of the date stone and spirulina tablets.
4. Conclusion
In conclusion, our work has demonstrated that spirulina powder and date stones are a potential source of essential nutrients and have active ingredients such as phenolic compounds and phycocyanin. The valorisation of these compounds was made by the formulation of a food supplement in the form of a tablet having the purpose of delivering phycocyanin. The final formula was optimized by a statistical model (D-Optimal Mixture Design) involving the physicochemical parameters of the tablets. The final formula was effective in terms of controlled release in simulated gastric and intestinal fluids. According to the results of the FTIR study, our tablet comprises protein, lipid, carbohydrate, aliphatic (C–H), carbonyl (esters and acid), carbonyl beta unsaturated ketone amide (C=N), ester, symmetric C–H stretching vibration, and sulfated chemicals (R–SO3). Thus, more distinctive characteristics may be seen in the FTIR spectrum. These phytochemicals may have some significant biological effects.
Conflicts of interest
The authors declare that they have no known competing financial interests or personal relationships that could have appeared to influence the work reported in this paper.