


 CC-BY 4.0
1. Introduction
Since the middle of the 20th century, the global agri-food industry is highly dependent on a massive input of synthetic fertilizers to increase crop yields to satisfy the rising demand for food, animal feed, and biofuels [1]. Fertilizers are defined as compounds or mixtures delivered as solids, liquids, or gases, that supply essential nutrients like nitrogen (N), phosphorous (P), and potassium (K) to crops in soluble forms. Their origin can be natural or synthetic [2]. Synthetic N fertilizers use is expected to increase by 50% from 2012 to 2050, which will lead to an even larger amount of nitrous oxide (N2O) emissions from agricultural soils Only part of the nitrogen fertilizer applied to the soil is absorbed by plants, while the other part is used by microorganisms to produce N2O, one of the principal greenhouse gases responsible for the deterioration of the ozone layer. Moreover, loss of nitrogen through leaching can also cause soil acidification and eutrophication of ground and surface waters, and consequently affect biodiversity, fish mortality, algal blooms, and aquatic ecosystems [3, 4, 5].
Hence, it is important to develop alternatives to synthetic fertilizers for the protection of the environment and a more sustainable agricultural system. For this purpose, this investigation is focused on the by-products (solids and liquids wastes) of the extraction of olive oil in the Mediterranean Basin Countries. Olive oil production is mainly concentrated in the Mediterranean region and it constitutes around 98% of the overall produced amount. According to the International Olive Council, worldwide olive oil production was as high as 3.01 million tons for the crop year 2020/2021. The five largest olive-oil-producing countries in that year were Spain (1389,000 tons), Greece (275,000 tons), Italy (273,500 tons), Turkey (210,000 tons), and Morocco (160,000 tons). Meanwhile, Tunisia produced 140,000 tons of olive oil during the 2020/2021 harvest season. This represents a decrease of 31% compared to the previous season, due to unfavorable weather conditions such as drought [6].
Despite its important economic value in the producing countries, the extraction processes generate huge quantities of waste: olive mill solid waste (OMSW) and olive mill wastewater (OMWW), which represent a real concern for the environment [7, 8] if no reuse approaches are considered (European Directive 2008/98/EC). These wastes are generally hard to manage and usually burnt or disposed of in landfills or discharged near lakes, rivers, or seas [9, 10]. In Mediterranean basin countries, production and irrational disposal of blunt amounts of olive mill wastes in short periods create severe environmental problems [11]. With the absence of treatments plants at the mills, wastewaters are left out in outdoor storage or evaporation lagoons and can reach water bodies during periods of high precipitations causing the deterioration of the environment such as coloring, and pollution of surface and ground waters, soil surface, and foul odors problems [12, 13, 14]. The waste waters are usually very smelly, have a high organic load and high content of phytotoxic and antibacterial phenolic substances, and therefore resist biological degradation [12, 15, 16, 17, 18, 19].
The valorization of some of these residues can contribute to reducing the quantities of wastes dumped in the environment [20, 21, 22]. In that perspective, OMWW and ROP were converted into biochars to be valorized as eco-friendly materials for agricultural purposes. Throughout the years, several physicochemical methods have been elaborated for treating olive mill wastes as a pollutant or for alleviating their toxicity [22, 12, 23, 24]. However, only a small focus on developing strategies to convert these wastes into biochars through pyrolysis has been reported and then to be used as alternatives or complementary amendments to synthetic fertilizers. One of those strategies is the utilization of biobed for the treatment of olive mills wastewaters. This technique is usually used for the reduction of pesticides by adsorption and degradation [25]. In 2021, a study was done on the efficiency of the treatment, purification, and detoxification of a highly loaded olive oil wastewater effluent concluded that the use of a biobed layer was efficient in pollutant removal [17]. A decrease in biochemical oxygen demand, chemical oxygen demand, total phenols, total Kjedahl nitrogen, and NH respectively decrease by 96%, 92%, 88%, 85%, and 100% [26].
According to the European Biochar Certificate (EBC), the so-called “biochar” is a porous, carbonaceous material produced by the pyrolysis of biomass in an oxygen-limited environment. Recently, a special interest was accorded to biochar use in agriculture as an eco-friendly fertilizer in the context of sustainable agriculture [27, 28]. The meta-study of 109 independent studies reported that biochar application to soil significantly increased crop yield by 13% and that effect was even more pronounced in acidic soil (40% increase for soil with pH < 5). The co-application of biochar and fertilizers had also an effect on crop yield increase in temperate climates [29]. In addition, it was reported that biochar has significantly impacted the abundance of soil microorganisms (total phospholipid fatty acid), bacteria, fungi, actinomycetes, Gram+ and Gram− bacteria by 8%, 20%, 19%, 9%, 11%, and 13% respectively [30]. Moreover, the role of biochar in carbon sequestration in soils was also proved since the early 2000s [31, 32, 33]. Indeed, it was demonstrated that the proportions of small labile C-fraction and recalcitrant C pools in biochar are respectively 3% and 97% [34]. The mean residence time (MRT) was estimated to be one year and 556 years respectively for labile C-fraction and recalcitrant C pools [34]. Biochar also had a positive role on soil physico-chemical properties such as water holding capacity [35, 36], and soil stability by altering the size of aggregates and regulating soil water [37, 38]. By improving the physical properties of the soil, it can allow better development of fungal mycelium of Arbuscular mycorrhizal fungi (AMF).
The symbiosis of AMF with plants has been proven to promote nutrient absorption, enhance soil fertility, stabilize soil structure, and also improve water absorption efficiency [39, 40, 41]. In water-deficient soil, mycorrhizas can connect through their hyphae and form an absorption network conferring more efficient water absorption than roots to plants [42, 43]. AMF also has the potential to solubilize inorganic phosphate and supply it to plants in an assimilable form [44]. Moreover, AMF can release organic acids and reduce the pH of the medium which increases P availability in soils where is it deficient [45]. Thus, the combined effect of biochar and AMF could be considered an attractive approach to enhance crop productivity and promote an eco-friendly fertilizer. Previous research works have demonstrated that biochars and AMF application can considerably affect the growth of different crops like cacao and chickpea [46, 47]. This combined effect was attributed to nitrogen and phosphorous uptake, photosynthesis, and chlorophyll synthesis improvement [46]. Moreover, the use of mycorrhizae and biochars combined treatments showed interesting results regarding the remediation of crude oil-contaminated soils [48]. Later, a study confirmed that the association of AMF, biochar, and N fertilizer improved chicory (Cichorium intybus L.) growth and nutrient uptake while reducing cadmium (Cd) uptake in a Cd-contaminated soil [49]. Thus, the present study aims to verify the following hypothesis: could olive mills’ wastes-based biochars be used as fertilizer, and do their use in combination with AMF enhance plant mycorrhization and nutrition? To verify these hypotheses, biochars have been chemically characterized, their compatibility with AMF has been tested in a viability assay and the effect of diverse biochar/AMF combination on nutrient uptake, relative chlorophyll contents, and fungal colonization by mycorrhizae were assessed under a greenhouse trial. The crop chosen for the greenhouse trial was maize (Zea mays L.). Maize is one of the four main crops used in studies on the effect of biochar on crops. The biochars generally used in those studies are produced from residues of those cereals crops (maize, rice, wheat, and barley) since they are the most produced and traded commodity in the world [50]. Also, maize is an important source of carbohydrates for human diets in developing countries and the harvest wastes (husks and straw) have been historically used as animal feed, stable litter, soil amendment, or cellulosic biomass for ethanol production [51, 52]. Therefore, this makes maize an interesting plant for this study.
2. Materials and methods
2.1. Biochar synthesis and characterization
Raw olive pomace (ROP) and olive mill wastewater (OMWW) were collected from a three-phase olive mill press located in Touta city, Nabeul, Northeast of Tunisia (36°38′19.1′′N 10°28′10.1′′E). Before use, ROP was sieved and air-dried. The OMWW was first homogenized and filtered to discard the large particles, as described on detail in Jeguirim et al. [21] and El-Bassi et al. [38]. Two biomasses have been prepared: (i) ROP and (ii) raw olive pomace treated with olive mill wastewater (200 g of ROP per liter of OMWW) (used to produce a biochar named IROP) as described by Jeguirim et al. [21]. Obtained biomasses (ROP and IROP) were converted into biochars through a slow pyrolysis process at 500 °C for 2 h in a tubular furnace reactor (Thermolyne F 21100). Then, mineral composition and physical-chemical characterization of the two biochars were carried out according to the method described in El-Bassi et al. [38]. The mineral composition of the generated biochars was performed using an X-ray fluorescence spectrophotometer (Philips, Eindhoven, Netherlands-PW2540) for analysis. Proximate analysis was assessed to determine the materials content in ash, volatile matter, and fixed carbon. Briefly, 0.5 g of samples were placed in a silicate alumina crucible and then deposed inside a TGA/DSC3+ apparatus (Mettler-Toledo, Greifense, Switzerland). Biochars were exposed to heat variation under argon gas flow as follows: A heating at 30 °C for 20 min, then an increase in temperature up to 800 °C at a 10 °C/min rate, followed by an isotherm of two hours at 800 °C, and finally an introduction of ambient air at the same temperature to reduce the sample into ash [22]. Specific surface area and porosity of the produced biochars were assessed through physical CO2 adsorption/desorption isotherms. Analysis was performed using an ASAP 2020 gas adsorption apparatus (Micromeritics, Georgia, USA). Before analysis, 0.2 g of each biochar was degassed under vacuum (<10 μmHg) for 24 h at 200 °C. Investigations were afterward performed at 273 K with progressive adsorption of CO2 gas doses. Porosity profile was determined using the CO2 NLDFT (Non-localized density functional theory) slit pores model [53]. Mineral composition of the biochars was performed through X-ray fluorescence (XRF) analysis. Generally, 200 mg of ROP and IROP biochar powders were mixed with 100 mg of boric acid (used as a binder), transformed into pellets then analyzed using a PHILIPS PW2540 (Amsterdam, Netherlands) [54].
2.2. Viability assay: Compatibility of biochars and AMF
Funneliformis mosseae spores used in this study were extracted from sporocarps and maintained in distilled water at 4 °C. To assess the viability of Funneliformis mosseae spores after formulation with biochars (and thereafter their germination potential), an assay using 3-(4.5-dimethylthiazol-2-yl)-2.5-diphenyl- 2H-tetrazolium bromide (MTT) as an indicator was performed [55, 56]. The viability rate was evaluated using a colorimetric assay, based on the reduction of a yellow tetrazolium salt to purple formazan crystals by metabolically active cells.
Fifty spores of Funneliformis mosseae were inoculated in 1 mL of demineralized water containing 1 g of synthesized biochars (ROP or IROP). Two incubation periods (3 and 7 days) were considered. The test was limited to 7 days due to the fragile character of the glomus that over time tends to wither in water and at ambient temperature. Spore recovery was carried out by wet sieving using a stainless-steel sieve (SAULAS, N°0226069) with a mesh sieve of 200 μm. Recovered spores were stained with a 0.5 g⋅mL−1 solution of MTT and incubated at room temperature in the dark for 48 h, in contact with air. For control treatments, the corresponding assays were performed without biochars. All these treatments were done in three replicates.
At the end of the staining time, spores were observed using a stereoscopic microscope (Nikon.SMZ-1B). The recovered viable spores turned pink or purple while non-viable ones remained colorless, black or blue (Figure 1).
Spores formulated with biochar (a) and Spores (b) before and after staining with MTT solution (0.5 g⋅L−1). The viable spore (b) is clearly stained as defined purples spheres while the non-viable spore is not stained and remain transparent brown. Images were observed using a Nikon SMZ-1B stereoscopic microscope under a total magnification of 100×.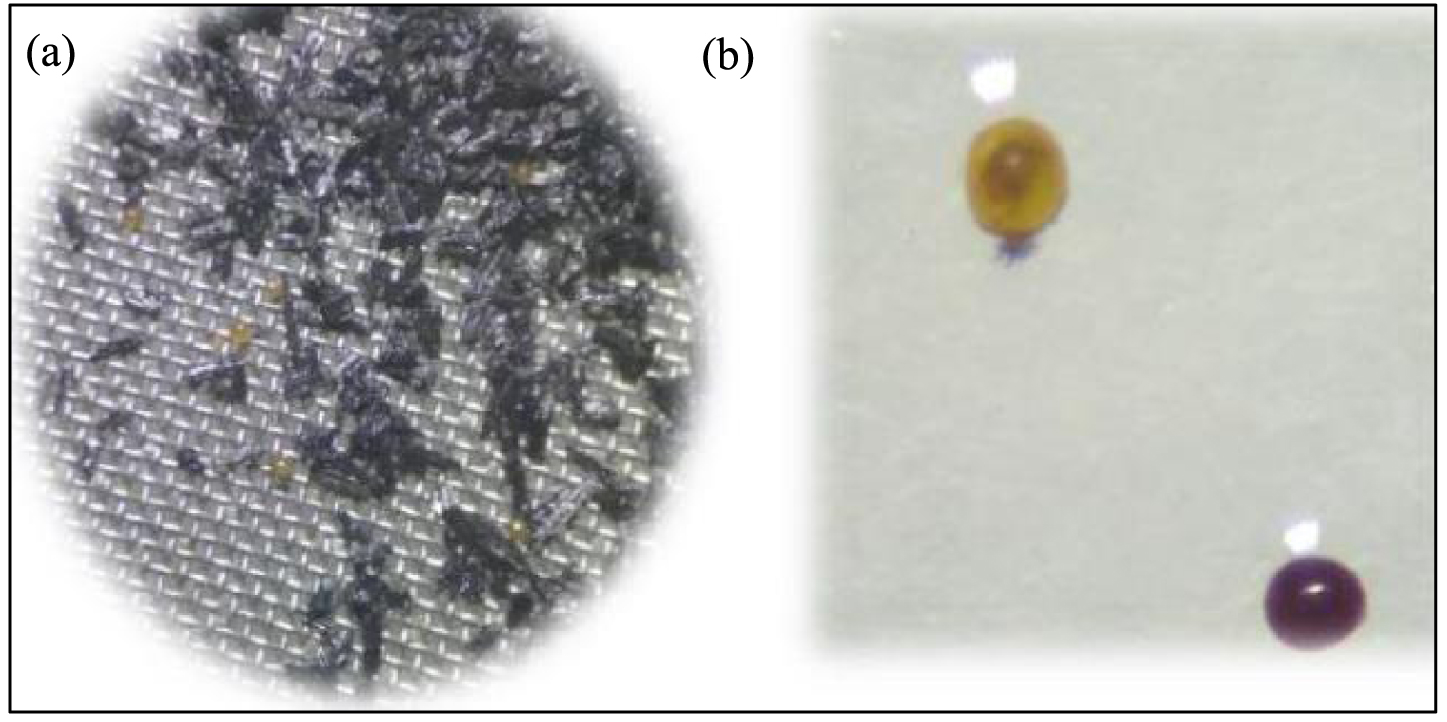
The viability rate was estimated by the following Equation (1):
| (1) |
2.3. Greenhouse trial on maize crops cultivation
The experiment was conducted in a greenhouse at temperatures between 22–30 °C. The soil used was a non sterile agronomic soil collected from the top layer of soil in Guemar, located in the Grand Est region of France (48°11′23.93′′N 7°23′25.0′′E). The sandy silt soil was analyzed in a laboratory and its characteristics were determined, those are presented in Table 1.
Physical and chemical characteristics of the used soil
| Analysis | Method | Results | Unit |
|---|---|---|---|
| Organic matter (MO) | NF ISO 14235 | 1.6% | % |
| Soil pH | NF EN 13037 | 7.1 | – |
| Total nitrogen (N) | NF ISO 13878 | 0.1 | % |
| Phosphore Olsen (P2O5) | NF ISO 11263 | 130 | mg⋅kg−1 |
| Potassium (K2O) | NF X31-108 | 412 | mg⋅kg−1 |
After air-drying, the soil was subsequently ground and sieved through a 10-mm sieve, without sterilization. Nine treatments combining one biochar (ROP or IROP) at a level of 2.5 g/kg of soil and inoculated or not with Funneliformis mosseae at two concentrations (30 and 125 spores/kg of soil) were arranged in an entirely randomized block design (Table 2). All treatments were applied locally during the sowing and replicated 4 times. For each treatment, three maize seeds were planted into a culture pot containing 1.5 kg of dry soil, which was reduced to one per pot after seven days. The soil’s water content was maintained during the experiment at 70% of its field capacity. The trial last for 47 days or until the 7-leaf stage.
Summary of treatments for greenhouse trials (4 replicates per treatment)
| Treatment name | Biochar quantity (g/kg) | Biochar feedstock | Mycorrhizal inoculant |
|---|---|---|---|
| Control | None | None | None |
| Sp30 | None | None | 30 spores/kg soil |
| Sp125 | None | None | 125 spores/kg soil |
| ROP | 2.5 g/kg | ROP | None |
| ROP30 | 2.5 g/kg | ROP | 30 spores/kg soil |
| ROP125 | 2.5 g/kg | ROP | 125 spores/kg soil |
| IROP | 2.5 g/kg | IROP | None |
| IROP30 | 2.5 g/kg | IROP | 30 spores/kg soil |
| IROP125 | 2.5 g/kg | IROP | 125 spores/kg soil |
The height of the plants was measured using a tape measure. The investigation of relative chlorophyll content was conducted with a SPAD 502 (Konica Minolta, Inc.). Measurements were taken from the fully expanded functional leaves at six growth stages; 2nd-leaf, 4th-leaf, 5th-leaf, 5 to 6th-leaf and 7th-leaf stage. Additionnaly, the total height increment (growth rate) for each treatment was calculated following this formula:
The total height increment for each treatment was calculated by subtracting the initial height measurement from the final height measurement. The total number of days for each treatment was calculated by subtracting the date of the first measurement from the date of the last measurement and adding 1 (since we are counting the first and last days). At the end of the experiment, the dry weight of the aerial biomass was determined after drying at 40 °C in an oven for several days. The dry biomass was then analyzed for C and nutrient concentration (N, P, and K). The nutrient uptake was then obtained by the following formula (2):
| (2) |
3. Results and discussions
3.1. Physico-chemical characterization of the biochars
Biochars produced from the raw and IROP were characterized using multiple analysis techniques. Firstly, the proximate analysis revealed a relatively high content of fixed carbon for both materials up to 59% and 61% for ROP and IROP, respectively (Figure 2). The addition of OMWW slightly enhanced the organic content in the lignocellulosic material, which was converted into additional fixed carbon content after pyrolysis [8]. A slight increase in the volatile matter content (Figure 2) was also noticed, which was set to be relatively low (17% and 18%, respectively) compared to the initial feedstocks (67% and 69% for ROP and IROP, respectively [54, 58]).
Proximate analysis of raw ROP and IROP and its derivative biochars (results related to the raw materials were imported from our previous publications [54, 58]).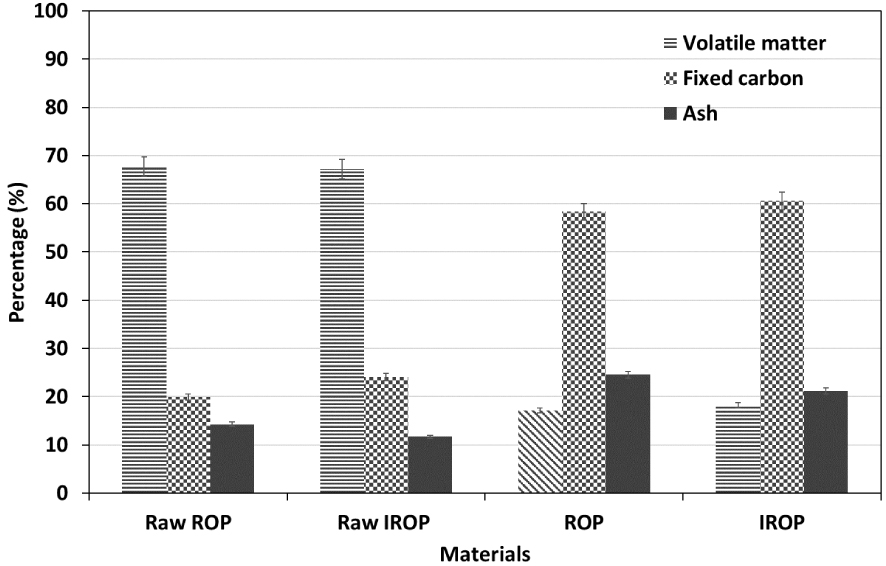
On the other hand, ash content slightly decreased for IROP by about 3%. Despite the successful retention of some minerals during the impregnation process, it is possible that the acidic aspect of the OMWW led to the leaching of some minerals and therefore the decrease in ash content. These results were further confirmed by mineral analysis (Table 3) suggesting a rather specific variation of minerals after impregnation with an increase in content for potassium, phosphorus, sodium, and silicon and a decrease in calcium, magnesium, and sulfur concentrations. The effect of OMWW impregnation was also noticeable when investigating the porosity of the produced biochars, and the results were depicted in Figure 3. The physical adsorption/desorption isotherm analysis (BET/CO2) indicates a decrease in the specific surface area from about 150 m2/g for ROP to 137 m2/g for IROP (Figure 3). Moreover, mean pores volume decreased from 0.5 to 0.36 cm3/g for the same samples, respectively; the excessive presence of specific minerals such as magnesium may have led to the blocking of this ultra-micro porosity, thus reducing their specific surface area and micropores volume [59].
(a) CO2 adsorption isotherm and (b) the related pore size distribution of ROP and IROP (SSA: specific surface area, m2/g; pores width was determined using the slit pores CO2 NLDFT model).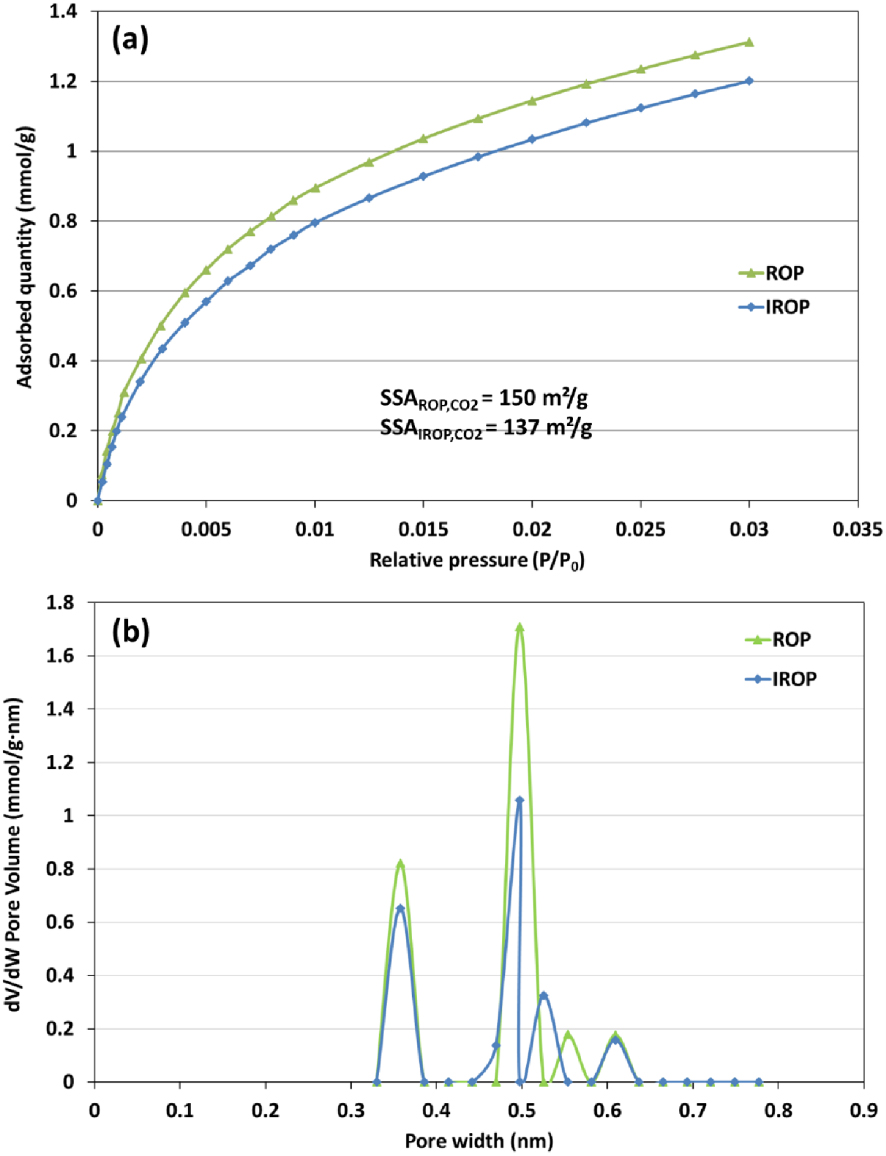
Chemical elemental of ROP and IROP-derived biochars produced at 500 °C [38]
| Unit | C | N | S | O | H | |
|---|---|---|---|---|---|---|
| ROP biochar | wt% | 63.83 | 0.98 | 0.07 | 8.06 | 2.54 |
| IROP biochar | wt% | 71.08 | 0.71 | 0.04 | 4.91 | 2.44 |
Furthermore, the impregnation of OMWW onto ROP significantly affected the final content of carbon (Tables 3 and 4). Besides, the XRF analysis highlighted the decrease in mineral composition after OMWW impregnation where a significant number of peaks, especially related to CaCO3 and KCl presented much lower intensities when comparing IROP to ROP spectra [38]. Nevertheless, a slight increase in potassium content was noted after impregnation from 4.71 to 5.54%, attributed to its incorporation and high affinity with the lignocellulosic structure of olive pomace.
Mineral composition of ROP and IROP-derived biochars produced at 500 °C [38]
| Unit | Na | Mg | Si | P | Cl | K | Ca | Fe | |
|---|---|---|---|---|---|---|---|---|---|
| ROP biochar | wt% | 1.47 | 0.90 | 2.18 | 0.30 | 1.32 | 4.71 | 7.40 | 0.53 |
| IROP biochar | wt% | 0.85 | 0.67 | 1.80 | 0.34 | 1.16 | 5.54 | 5.80 | 0.45 |
3.2. Viability assay of biochar inoculated AMF
The viability of spores inoculated with the ROP and IROP biochars was assessed using the MTT staining assay. In control, a higher proportion of viable spores was observed after 3-days incubation time (87% viable spores) compared to 7-days incubation time (68% viable spores) (Figure 4). This is probably due to incubation conditions leading to cells burst and spores shell fragments. However, although a decrease in spore viability is observed with biochar after 3 days compared to control, the viability seems to be constant over time, with slight increase of viability between 3 and 7 days. The viability of spores was 48 and 55% after 3 and 7 days respectively for ROP inoculated biochars. It was about 25 and 40% after 3 and 7 days respectively for IROP inoculated biochars. The inoculation on biochars seems to have an overall negative impact on spores’ viability, but over time biochars appears to limit the spores’ death observed in control between 3 and 7 days (Figure 4). Based on these results, AMF and biochars have been applied separately for greenhouse tests, to limit spores’ death.
Viability rate of recovered spores (MTT treatment) and spores’ losses of AMF formulated without or with the two biochars (ROP and IROP) after an incubation time of 3 days and 7 days (data are means of three replicates (n = 3), letters (a, b and ab) represents the significant difference at p < 0.05).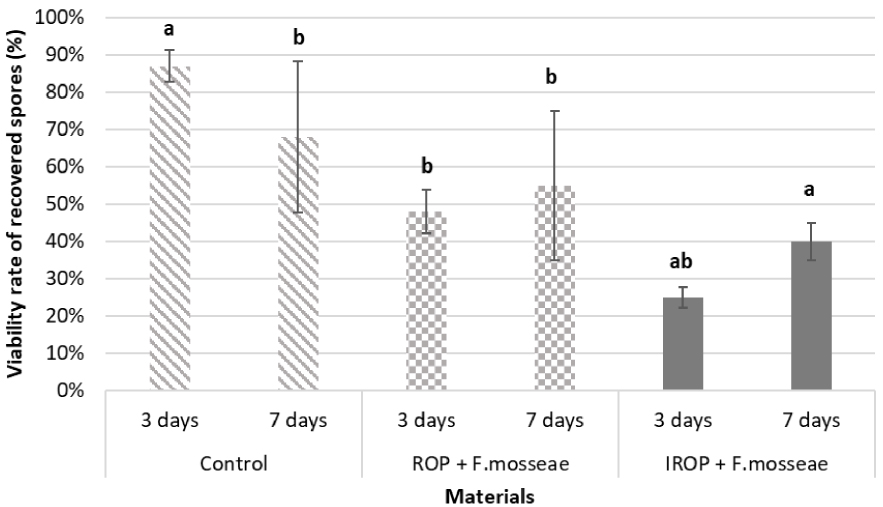
The results of the viability assay showed that AMF spores’ viability (spores’ germination) decreased after formulation with biochars. However, compared to the control treatment (solution of spores in water), the viability of spores is maintained with biochar formulation. Biochars seem to have a deleterious effect on spores’ germination (more pronounced with IROP than ROP). The loss of viability of spores might be due to osmotic pressure causing the collapse of spores’ membrane through cytolysis and/or spores burst caused by the biochars particles. Numerous studies were carried out regarding the interactions of AMF and biochar in soil but only few seemed to have focused on the direct impact of biochar on AMF viability before application to soil. However, some studies have investigated the colonization of plants by AMF in adsorptive substrate systems, and their survival and long-term infectivity in substrate such as peat. In Hu et al. [60] study, 350 g of a fungal inoculum containing Rhizophagus irregularis (BEG 140, known as Glomus intraradices) was added to a layer of biochar in a PVC column filled with gravel (15 cm depth), biochar (20 cm depth) and sand (15 cm depth). Hu et al. [60] demonstrated that AMF colonization in biochar systems was lower than in perlite and vermiculite systems. Thus, AMF development may have been inhibited by the toxic substances contained in biochar such as dioxins, ethylene, polycyclic aromatic hydrocarbons, phenolic compounds, volatile compounds, and heavy metals [60]. The analysis of the prepared biochars showed that the volatile matter proportion in ROP and IROP were respectively 17% and 18% which could explain the negative effect on AMF spore germination. Concerning the evolution of infectivity of AMF inoculum (such as F. mosseae) in a substrate (peat), a study conducted in 2019, showed that the infectivity of AMF was negatively affected by parameters such as the temperature of storage especially mild temperature (18 °C–25 °C) [61]. The results of our direct formulation of biochar with spores confirmed the negative impact of biochar on spores at short time but the same level of spores’ viability was maintained during storage. Therefore, to avoid these negative effects, biochar and AMF mixing before application to soil has to be avoided, in addition more research on the formulation need to be conducted to better understand the effects of parameters such as biochar pH, nutrients levels and particle sizes on AMF spores.
3.3. Effects of biochar and AMF treatments on maize growth parameters and SPAD values
According to Figure 5, all treatments using biochars and/or AMF spores had no significant effect on the maize plants’ growth compared to the control. Maize growth was homogeneous throughout the 47 days of cultivation, either on plant height (values between 60.4 and 67 cm, no significant statistical effect) or shoot biomass (values between 1.41 and 1.6 cm, no significant statistical effect).
Effect of biochar and AMF on the maize growth (A) and shoot production (B) (DW = Dry weight) at the harvest. The error bars indicate the standard deviation (n = 4). Different letters within each parameter indicate significant differences at p⩽0.05. Sp30 and Sp125 = 30 and 125 spores/kg of soil, ROP: Raw Olive pomace biochar (2.5 g/kg of soil), ROP30 and ROP125 = Raw biochar (2.5 g/kg of soil) + 30 or 125 spores/kg of soil, IROP: Impregnated olive pomace biochar (2.5 g/kg of soil), IROP30 and IROP125 = Impregnated biochar (2.5 g/kg of soil) + 30 or 125 spores/kg of soil).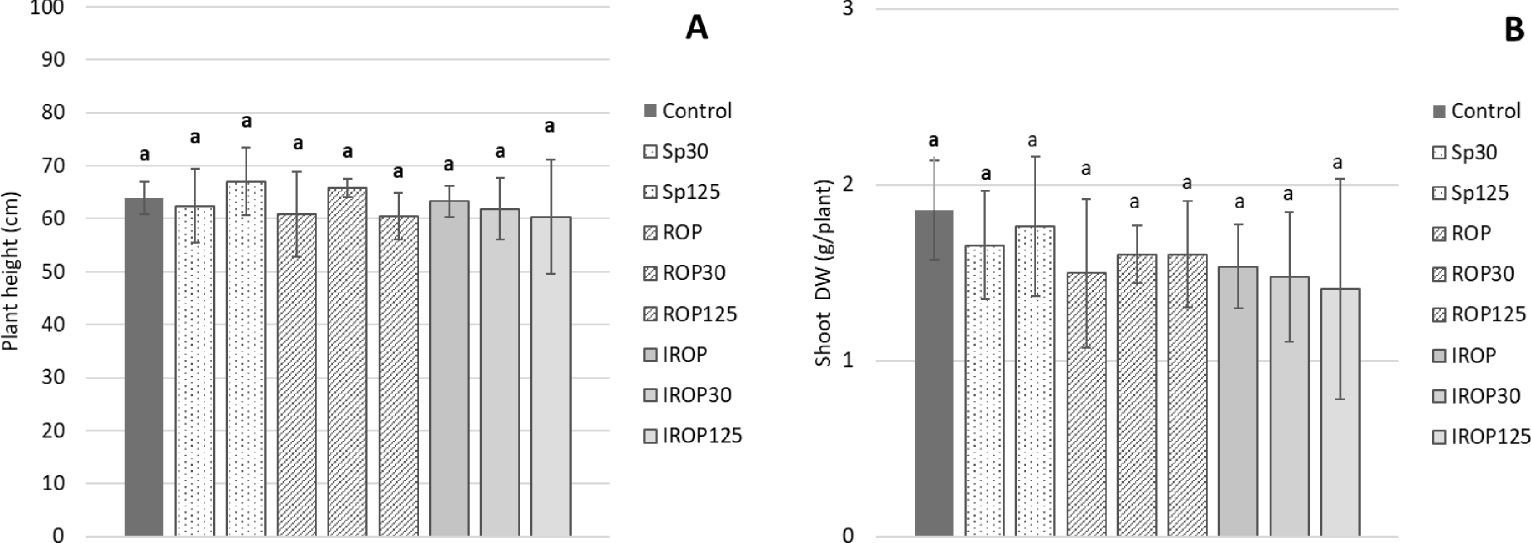
The use of ROP and IROP combined AMF did not affect significantly maize plants growth (Figure 6) and biomass production. The average growth rate (cm⋅days−1) between the treatments was similar and varied by 1.2 to 1.4 cm⋅day−1.
Plant growth rates (plant eight increment) at the 6 measurements times (data are means (n = 4)).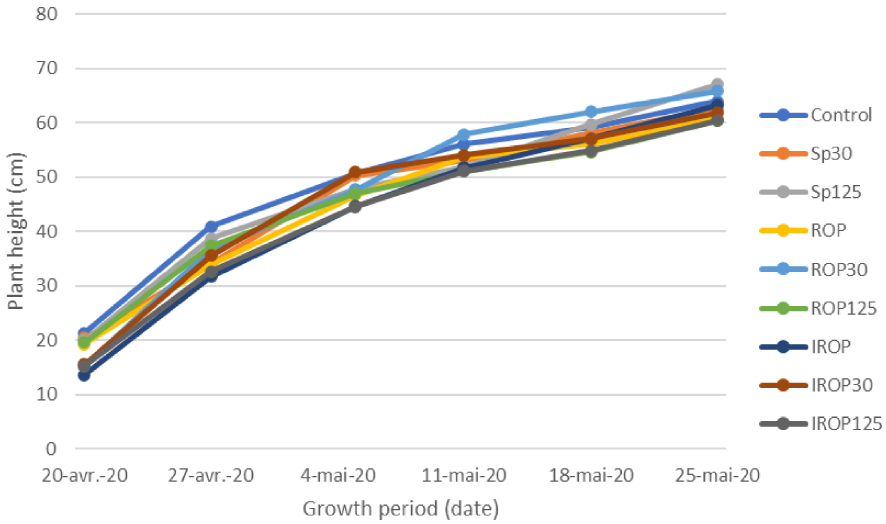
Our results are in agreement with those reported by Mau and Utami [62], they investigated the effects of various doses of cow dung-derived biochar amendment (0, 5, and 7.5 g/kg soil) and AMF inoculation (0, 5, 10 and 15 spores/kg soil) on the growth of maize. No effect of biochar on plant growth, with or without AMF inoculation, was observed after a growing period of 8 weeks [62]. However, Liu et al. [63] proved that the combination of Glomus intraradices BEG 141 (20 g/kg soil) with wheat straw biochar (20 g/kg soil) increased maize plant biomass production by 70% after 14 weeks, while biochar or AMF alone have lower effects. Moreover, Zhuo et al. [64] when studying the effect of biochar (20 g/kg) and AMF (5% v/v) adding on maize growth in contaminated soils, proved that AMF+biochar had a positive impact on maize growth and biomass production after 12 weeks, whereas biochar or AMF alone didn’t impact maize biomass (respectively 28 and 52%). Abou El Seoud [65] showed that biochar adding at doses of 0 and 10 g/kg soil) and AMF (250 spores/kg soil) has a positive impact on maize growth in a calcareous soil after 6 weeks. Li and Cai [66] demonstrated that biochar (50 g/kg soil) and AMF (700 spores/kg soil) in combination have a positive impact on plant height after 12 weeks. All these experiments seem to indicate a positive impact of biochar and AMF on maize growth with high biochar rates (up to 50 g/kg soil) and with high AMF inoculation (up to 700 spores/kg soil). In other side, the culture duration could also impact the maize crops growth. Various field experiments showed that biochars can have a time-delayed effect on crops growth [67, 68, 69, 70].
The results of chlorophyll content measurements represented by the SPAD values at the 4th leaf stage showed significant effects for several treated modalities compared to the control (Table 5). When the spores were applied alone (without biochar), there was a slight decrease in the SPAD values (compared to the control). The same trend was observed when the ROP biochar was applied alone, the SPAD value decreased by 6.4% compared to the control. On the contrary, when AMF (Sp30 and Sp125) were combined to ROP biochar, a positive effect occurred, i.e., a slight increase in the SPAD values compared to the control and the treatments with AMF or ROP alone (Table 5). Thus, IROP biochar is the most effective product but only when applied alone. Otherwise, its combination with the AMF caused a slight decrease in the SPAD value but still higher than that of the control.
Effects of treatment on SPAD values at the stages 4th and 7th-leaf of the maize plants
| Treatments | SPAD Values | |||||
|---|---|---|---|---|---|---|
| 2-Leaf | 4th-Leaf | 5th-Leaf | 5–6th-Leaf | 6th-Leaf | 7th-leaf | |
| Control | 30 ± 3.4a | 24.9 ± 0.7bcd | 25 ± 1.8a | 23 ± 2.1ab | 18.6 ± 2.2b | 17.3 ± 1.0a |
| Sp30 | 29.5 ± 2.3a | 22.8 ± 3.8d | 23.7 ± 1.6a | 21.7 ± 1.6bc | 19.3 ± 1.4ab | 17.5 ± 1.3a |
| Sp125 | 28.2 ± 4.8a | 21.7 ± 1.6d | 23.2 ± 0.5a | 19.7 ± 1.6c | 19 ± 2ab | 16.8 ± 1.3a |
| ROP | 32.8 ± 3.1a | 23.3 ± 2.5cd | 23.9 ± 0.9a | 22 ± 1.7abc | 19.5 ± 1.7ab | 16.4 ± 0.3a |
| ROP30 | 30.6 ± 2.8a | 27.7 ± 3.6ab | 26.5 ± 2.2a | 24 ± 1.4ab | 21.6 ± 0.8a | 16.9 ± 0.9a |
| ROP125 | 28.2 ± 4.3a | 26.8 ± 3.8abc | 23.2 ± 1.6a | 21.4 ± 2.1bc | 21.4 ± 2a | 16.6 ± 1.3a |
| IROP | 31.7 ± 5.9a | 30.3 ± 1.3a | 23.8 ± 7.6a | 25 ± 2.1a | 21.6 ± 0.9a | 17.9 ± 1.5a |
| IROP30 | 30.6 ± 3.7a | 27.2 ± 3.1abc | 25.5 ± 3.1a | 23.2 ± 2.6ab | 19.6 ± 1.7ab | 16.6 ± 0.6a |
| IROP125 | 29.2 ± 2.9a | 27.8 ± 1.8ab | 26.5 ± 3.6a | 23.6 ± 2.1ab | 21.1 ± 2.8ab | 16.7 ± 2.1a |
Values obtained are expressed as mean ± SE (n = 4). Different letters indicate the least significant difference (LSD test, p < 0.05).
All SPAD values vary over time but decrease at the end (Table 5), and at the 7th leaf stage of maize, the chlorophyll contents of the plants were homogeneous among the treatments indicating that there was no significant effect (p < 0.05) of AMF or/and biochars at the end of the cycle, despite some variations during growth. Effects of biochar and/or AMF observed on SPAD values seem to be therefore transitory.
At the end of the culture, the treatments did not have a significant effect on the chlorophyll contents, as indicated by the measurements of SPAD values (Table 5). The SPAD measurements followed a particular pattern of change over time, increasing early in the growth up to the 4th leaf stage and declining afterward until the 7th leaf-stage. The decrease in SPAD values with the plant age regardless of the treatments was also observed in previous studies on maize [71, 72, 73]. It was demonstrated that there is a correlation between chlorophyll content in leaves and the plant’s nutrient status [74, 75, 76] as N status. A study by Hammad et al. [77] showed a significant decrease in maize yield and quality without nitrogen application. Since chlorophyll contents (measured SPAD values) are proportional to the amount of nitrogen present in the leaves [78, 79], the decrease in SPAD values over time can be due to nitrogen deficiency in plants. When maize is cultivated in optimal conditions, the plant tends to take up nitrogen (N) during vegetative growth, and this N is later remobilized from leaves to reproductive organs to support kernel formation [80, 81]. In the case of low availability of soil N, this remobilization happens sooner in the growth stages [81] which can explain the decrease of SPAD values.
3.4. Effect of biochar and AMF treatments on nutrients uptake
After 46 days of culture, total nitrogen uptake by the maize crop increased overall with AMF treatments and biochar application (Tables 6 and 7). A minimum N concentration of around 1.19% was observed in the control assays while the highest N concentrations were found in the plants treated with AMF (Sp30) and AMF combined with IROP biochar (IROP30). Biochar addition slightly enhanced N concentration. Moreover, modalities with biochar and spores were not significantly different from those with biochar alone concerning N concentration. Sp30 Modalities were all higher than corresponding modalities without spores. Some trends were observed for N content (general diminution of N content with biochar compared to modalities without biochar), but they were not significant. As for N concentration, modalities with 30 spores/kg soil were all higher than corresponding modalities without spores, but this effect was significant only for control and Sp30 modalities. The statistical analysis of the P concentrations results in maize plants showed few significant effects of treatments (Table 6). Sp125 showed a significant effect of AMF addition on P concentration (but not on P content). Biochar treatments have no effect on P concentration or content when comparing modalities with the same spores’ treatment.
Effect of treatment on shoot N, P, K, and C content
| Treatments | Concentration (%) | |||
|---|---|---|---|---|
| N | P | K | C | |
| Control | 1.19 ± 0.17c | 0.49 ± 0.03a | 3.53 ± 0.21abc | 44.48 ± 0.25b |
| Sp30 | 1.72 ± 0.52a | 0.48 ± 0.01a | 3.75 ± 0.12ab | 45.63 ± 0.57a |
| Sp125 | 1.24 ± 0.08bc | 0.42 ± 0.03b | 3.22 ± 0.14bc | 45.83 ± 0.15a |
| ROP | 1.36 ± 0.06abc | 0.47 ± 0.02ab | 3.60 ± 0.12abc | 45.93 ± 0.23a |
| ROP30 | 1.50 ± 0.3abc | 0.44 ± 0.01ab | 3.55 ± 0.15abc | 45.88 ± 0.53a |
| ROP125 | 1.24 ± 0.23bc | 0.43 ± 0.03b | 3.08 ± 0.13c | 45.75 ± 0.53a |
| IROP | 1.23 ± 0.15bc | 0.48 ± 0.02a | 3.84 ± 0.12a | 45.80 ± 0.22a |
| IROP30 | 1.58 ± 0.2ab | 0.46 ± 0.03ab | 3.44 ± 0.24abc | 45.98 ± 0.33a |
| IROP125 | 1.35 ± 0.13bc | 0.45 ± 0.05ab | 3.38 ± 0.4abc | 46.13 ± 0.53a |
Values obtained are expressed as mean ± SE (n = 3). Different letters indicate the least significant difference (LSD test, p < 0.05).
Effect of treatment on shoot N, P, K, and C content
| Treatments | Content (mg) | |||
|---|---|---|---|---|
| N | P | K | C | |
| Control | 21.71 ± 1.73b | 8.97 ± 1.28a | 65.14 ± 7.25a | 825.37 ± 127.71a |
| Sp30 | 29.17 ± 12.4a | 7.93 ± 1.35ab | 61.85 ± 10.53ab | 755.68 ± 143.68a |
| Sp125 | 21.74 ± 4.2ab | 7.32 ± 1.16ab | 56.35 ± 10.49abc | 808.14 ± 181.4a |
| ROP | 20.42 ± 6.07ab | 7.00 ± 2.05ab | 53.82 ± 14.8abc | 686.82 ± 191.19a |
| ROP30 | 24.10 ± 6.44ab | 7.10 ± 0.81ab | 57 ± 7.16abc | 734.79 ± 71.55a |
| ROP125 | 20.22 ± 7.47ab | 6.84 ± 0.92b | 49.11 ± 7.75bc | 734.12 ± 146.89a |
| IROP | 18.74 ± 2.1b | 7.32 ± 1.11ab | 58.77 ± 8.05abc | 703.36 ± 112.19a |
| IROP30 | 23.39 ± 7.38ab | 6.75 ± 1.61b | 50.33 ± 10.54abc | 679 ± 174.37a |
| IROP125 | 18.33 ± 6.81b | 6.09 ± 2.26b | 45.68 ± 16.71c | 647.64 ± 289.67a |
Values obtained are expressed as mean ± SE (n = 3). Different letters indicate the least significant difference (LSD test, p < 0.05).
The statistical analysis of the results of the K concentrations in maize plants showed few significant effects of treatments (Table 6). Comparing modalities with the same spores’ treatment or the same biochar effect showed no significant effect of these treatments on K concentration or content.
The results of the C concentrations in maize plants showed no significant effects of treatments on C uptake and had a minimal impact on the C concentration of the maize plants. All the concentrations were significantly different (p < 0.05) from the control and were very similar. C content was similar for all modalities.
The results of analysis of plants’ nutrients concentrations and contents showed that the Sp30 and IROP30 treatments enhance the N uptake respectively by 45% and 33% compared to control. On the other hand, there was no significant effect of the treatments on the C and K uptake while in P concentrations, a negative effect of treatments was observed. This finding can be explained by the low doses of applied biochar and AMF. Mau and Utami [62] observed an increase in P uptake with all treatments: biochar, AMF and combined treatment under similar experimental conditions. Wang et al. [82] demonstrated that biochar application to soil increased C sequestration, and the same result was observed with the combination of biochars with mycorrhizal fungi [83, 84].
AMF is known to improve P uptake in the plant [85]. Under higher doses of biochar, its application could directly or indirectly improve the nutrients uptake and bioavailability of P [86] due to a less binding to non-soluble forms [87]. An increase of P uptake by maize has been observed in some studies as an effect of biochar and/or AMF addition in soil [64, 65, 66, 77]. Thus, it is well proved that biochar and AMF can improve nutrients uptake depending on their applied doses as well as the culture duration.
3.5. Effect of biochar and AMF treatments on mycorrhizal colonization
The mycorrhizal colonization frequency (F%) indicates the number of roots where mycorrhizae are observed. The mycorrhizal intensity (M%) reflects the abundance of mycorrhizae observed on each mycorrhized fragment. Mycorrhizal frequencies F% of treated plants under described treatments (Table 8) were almost similar, except for the control. This indicates that all root systems were colonized by AMF, even the modalities without AMF treatment. During the inoculation of the treatments, cross-contamination was avoided by not using the same instruments for the differents pots, which can suggest then the presence of indigenous AMF in soil. A single treatment of ROP or IROP did not enhance the plant’s colonization by indigenous AMF even if the F% increase compared to the control. The inoculation of AMF significantly improved mycorrhizal colonization intensity with a dose-dependent relationship (Table 8). A single inoculation of AMF at a minimum level of 30 spores per kg of soil results in an increase of AMF colonization by 113.9% compared to the control. Biochar treatment has no effect on mycorrhizal intensity of maize roots.
Effects of treatment on mycorrhizal colonization frequency (F%) and intensity (M%)
| Treatments | Mycorrhizal frequency | Mycorrhizal intensity |
|---|---|---|
| F% | M% | |
| Control | 90.83 ± 6.87b | 21.5 ± 13.09c |
| Sp30 | 100 ± 0.0a | 46.03 ± 11.23b |
| Sp125 | 98.89 ± 1.92a | 74.24 ± 16.56a |
| ROP | 100 ± 0.0a | 22.69 ± 4.99c |
| ROP30 | 100 ± 0.0a | 57.51 ± 12.65ab |
| ROP125 | 100 ± 0.0a | 64.07 ± 15.23ab |
| IROP | 99.17 ± 1.67a | 23.79 ± 4.14c |
| IROP30 | 100 ± 0.0a | 55.62 ± 18.89ab |
| IROP125 | 99.17 ± 1.67a | 64.17 ± 13.85ab |
Values obtained are expressed as mean ± SE (n = 3). Different letters (a, ab or b) indicate a least significant difference (LSD test, p < 0.05).
The results of the root staining assay showed colonization of all plants roots by AMF (Figure 7). According to the results (Table 8), biochar addition to the soil did not significantly enhance AMF root colonization and did not have a negative impact on it either. However, AMF treatments provided new propagules and enhance maize root colonization. It is important to underline that biochar made from woody biomass addition to agricultural soils could increase the AMF spore number in the soil [78, 79]. Indeed, when studying the effects of olive waste-based compost, a wood-based biochar, and their combination on soil fertility and maize growth, these authors found that a single application of biochar had a negative impact on mycorrhizal symbiosis after 3 months while the compost gave the best results in terms of mycorrhizal frequency (F%) and intensity of mycorrhizal colonization (M%) and F%.
Root sections stained with trypan blue showing arbuscular mycorrhizal structures. Roots were observed at a magnification of ×100 (A, C) and ×400 (B). (A) A section of maize root colonized by AMF. (B) Vesicles and hyphae. (C) Darkly cells containing arbuscules.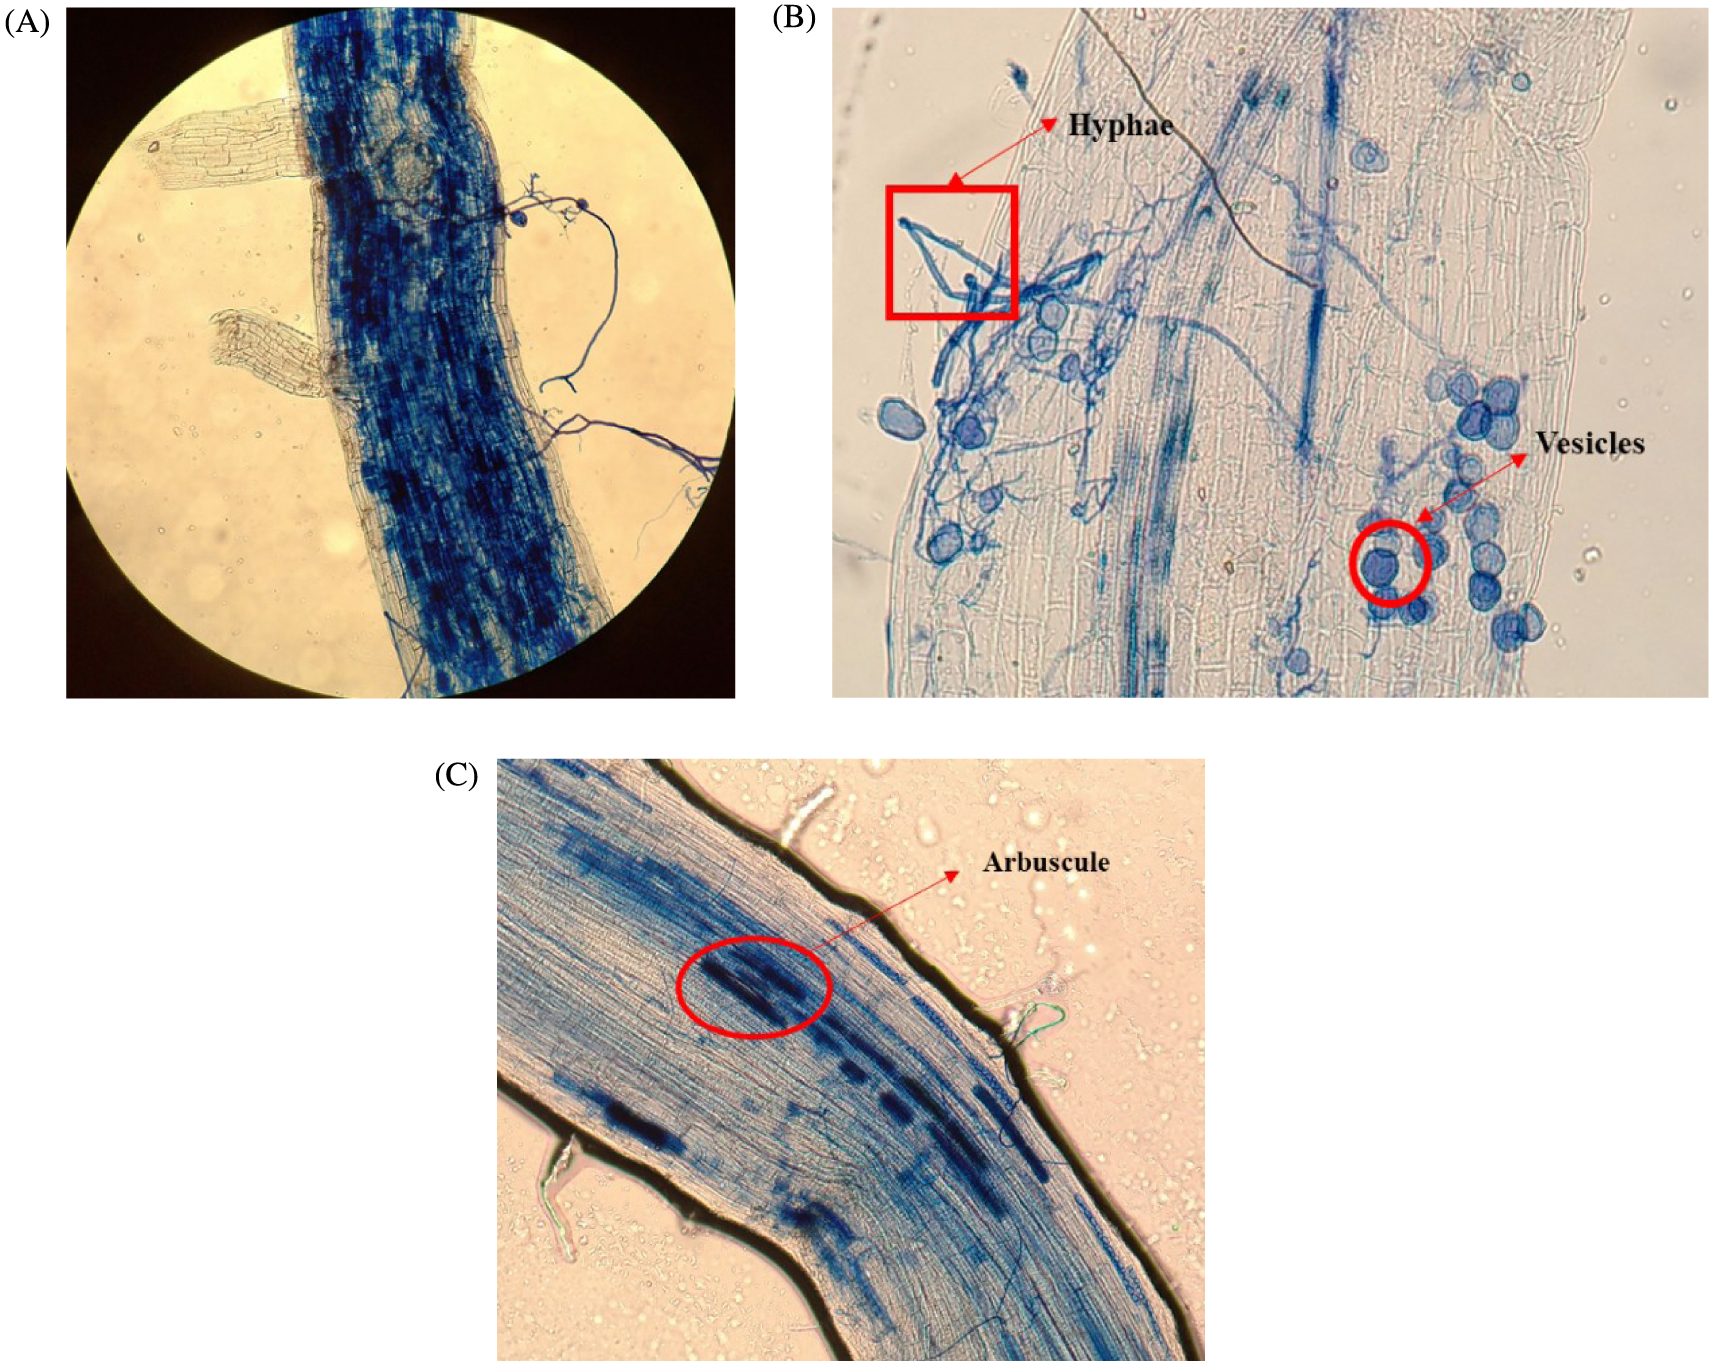
Moreover, Mau and Utami [62] observed an initial decrease of mycorrhization in biochar modalities, but after 8 weeks, mycorrhization in modalities treated with biochar was higher than control. Likewise, Li and Cai [66] observed a positive effect of biochar addition on AMF colonization after 12 weeks in a sterilized soil. All these results showed the complexity of the interactions between biochars and AMF which can be dependent on factors like soil microorganisms activity or biochar porosity and particles sizes [88]. Biochar contains pores of varying sizes, which can affect the retention and availability of water, nutrients, and microorganisms. Large biochar particles with large pores may allow water to drain quickly, reducing the moisture available for mycorrhizal fungi to grow and colonize plant roots. On the other hand, small biochar particles with smaller pores may retain more water and provide a more favorable microenvironment for AMF. In another study, Vicia faba pre-germinated seeds were seedeed in soils amended with OMWW at 0, 10, and 30 days after OMWW treatments [89]. It was found that OMWW application reduced but did not eliminate AMF root colonization only when the seeding was done right after the treatments (Day 0). This suggests that applying biochar at the same time as AMF is not an interesting practice. Biochar can be used as a growth support for mycorrhiza. However, soil amendment and a sufficient period of incubation are required.
4. Conclusions
This study was performed in order to evaluate the interest to use olive pomace-based biochar as an amendment and its impact on AMF spore viability and plant colonization. Preliminary results showed that the use of ROP-biochars and IROP-biochars significantly decreased spores’ viability. The application of biochars and AMF treatments to soil did not have a significant effect on maize plants growth, biomass production and shoot chlorophyll content. Moreover, AMF treatments did not significantly affect the nutrients uptake except for the Sp30 and IROP30 treatments which improved N uptake. The application of biochars (ROP and IROP) didn’t change the maize root colonization by mycorrhiza, which is probably due to the direct effect of biochar on spores’ germination and on the short time of plant growth. Considering above results, longer experiments should be performed in order to better understand and to precisely assess the long-term influence of those biochars and AMF on crops.
The current study confirms that the usefulness of olive mill wastes derived biochars applied alone or in combination with mycorrhiza is a complex process and depends on several parameters. Indeed, even if biochar can be used as a support for mycorrhizae growth, it is important to control the level of colonization of the formulated biochar before soil application. The results obtained in this work have shown that the direct application of mycorrhiza spores on biochar’s can cause an immediate negative effect that may be due to the chemical characteristics of biochar (pH, element content …). While data on biochar effects on mycorrhiza are accumulating, there are several important gaps in the knowledge on these interactions. It is possible that negative or neutral effects have been under-reported.
The potential synergism between biochar and mycorrhizal for soil management practices depend on the environmental circumstances (e.g., soil nutrient content, plants species) and biochar parameters (e.g., quality and application rate).
Conflicts of interest
Authors have no conflict of interest to declare.
Acknowledgements
This work was funded by FERTICHAR project, through the ARIMNet2 Joint Call by the following funding agencies: MHESRT (Tunisia), ANR (France), and HAO DEMETER (Greece). The authors gratefully acknowledge these funding organisms for their support.