


 CC-BY 4.0
1. Introduction
A circular economy could be built by turning large amounts of agro-food waste into valuable resources, thereby achieving sustainable development goals. Waste valorization is the suitable strategy in order to ensure a sustainable bioeconomy. Due to the massive generation of waste, the environment has become a significant concern of society as a result of industrialization and agricultural economic growth. Currently, several wastes are not properly managed despite their potential for energy and environmental applications. They are generally discarded by landfilling and incineration. However, similar techniques are not eco-friendly and fail to recover useful products/chemicals. For instance, energy production and bio-based materials extraction routes from agricultural residues could be part of a circular economy approach [1]. Thermochemical conversion of agricultural residues has the advantage of fully exploiting the entire organic matter of the resource. However, depending on the procedure parameters, the conversion of the residues also generates by-products that need to be managed in different ways.
Pyrolysis and pyro-gasification are considered among the most effective methods of biofuel production from biomass. These techniques allow waste conversion into three value-added products: char, oil and gas, thus facilitating its storage and transport. Depending on the parameters of the process and the potential of the treated residues, one form can be promoted: oils are favored by rapid pyrolysis, syngas by pyro-gasification and char by slow pyrolysis. This last solid fraction is singled out thanks to its versatile applications as a fuel, a soil conditioner, or as an adsorbent [2].
Citrus waste is one biomass among those considered as excellent candidates for the recovery of high-added value products. Indeed, the deposits are important in many parts of the world [3]. The world production of citrus fruits, all species combined, is estimated to 110 million tons per year, and is spread over a free area worth about 7.5 million hectares. Oranges account for almost 60% of total world production.
In recent decades, several studies have been carried out on the valorization of orange peels by pyrolysis. In this context, Aguiar et al. [4] conducted a comprehensive study to determine the influence of temperature (300, 500 and 600 °C) and particle size (300–800 mm) on the volatile products and the biochar yields derived from the pyrolysis of orange peels in a fixed bed reactor. They subsequently demonstrated that temperature has a more significant effect than particle size on the products yields, the biochar characteristics and the composition of the gaseous and the liquid fractions. Miranda et al. [5] also pyrolyzed dried orange peels and obtained an high bio-oil fraction (53.1%). Authors noted that such waste is capable of generously releasing volatile products (78.9% w/w). Ash rate was 2.94% w/w while biochar was around 21.1% w/w. These results were similar to those obtained by Morales et al. [6] who were able to achieve a bio-oil yield of 77.64%, a biochar percentage of 20.93% and a yield of gas as low as 1.43%.
On the other hand, the slow pyrolysis of dried citrus waste (lemon and orange peels) was investigated by Volpe et al. [7] using a fixed bed reactor for a temperature range from 400 °C to 650 °C. They reported that the yield of bio-oil fluctuated between 36% and 39% w/w and the biochar rate varied between 37.2% and 40.8% w/w.
More recently, Sánchez-Borrego et al. [8] used a vertical tubular furnace at laboratory scale in order to pyrolyze orange waste and pruning while varying the temperature (400–600 °C), the heating rate (5–20 °C/min), as well as the inert gas flow rate (30–300 mL of Argon per minute). Authors found that the optimized conditions for biochar production from orange waste were: 400 °C, 5 °C/min, and 150 mL/min. Despite their low specific surface areas, these biochars were very effective when removing sulfur from waste cooking oil. Selvarajoo et al. [9] have also slowly pyrolyzed citrus peels in the temperature range of 300–700 °C. The results showed that an increase in pyrolysis temperature led to a low char yield (reduced from 53.62 to 22.01 wt%). For energy purposes, the maximum HHV (High Heating Value) and carbon content values were found in biochars formed at 500 °C.
Faster pyrolysis of orange peels was investigated by Alvarez et al. [10]. They have developed such technology to determine the yields of this biomass derivative by varying the pyrolytic temperature. They have revealed that the biochar yield fluctuates between 27% and 33% by weight in the temperature range of 425–500 °C. Adeniyi et al. [11] have conducted a comparative study using the ASPEN model in order to investigate the pyrolysis yields of five different fruit peels, namely banana (Musa spp.), orange (Citrus sinensis), sweet lime (Citrus limetta), lemon (Citrus limon) and jackfruit (Artocarpus heterophyllus) peels. The obtained data showed that lemon and orange peels, which have the greatest volatile matter values, delivered also the maximum bio-oil yield. The jackfruit peel, on the other hand, generated the maximum biochar percentage. Peels from bananas and sweet limes exhibited comparable amounts of both oil and char. Lastly, based on their research, the authors have concluded that citrus peels, including orange, sweet lime, and lemon peels, are excellent candidates for liquid fuel generation and/or for char formation.
Generally, the vast majority of the previous related works have focused on the valorization of pure citrus waste, without mixing with other wastes. Yet, although blending of two or more types of biomass is often investigated as feedstock for pyrolysis, to the best of our knowledge, mixing orange peels with other residues was not carried out in pyrolysis tests. Thus, the novelty of this work is to extract high added-value products, namely biochar, from orange peels blended with different other food waste and to assess their performance in comparison with the single biomass. More particularly, the present study aims to fully characterize the pyrolytic solid by-products issued from the blends of orange peels with several abundantly occurring agro-food waste, including date pits, tea waste, coffee grounds, and peanut shells.
2. Materials and methods
2.1. Samples preparation
Initially, selected biomasses were retrieved individually from specific addresses, which were all located in the eastern region of Tunisia. Orange peels (OP) were collected from the orange juice manufacturing industries, while coffee grounds (CG) and tea waste (TW) were recovered from tearooms and cafeterias. As for the date pits (DP), they were collected by manufacturers dedicated to the production of date paste. Finally, peanut shells (PS) were collected from farms based in the Cap Bon region in Tunisia.
Prior to pyrolysis, samples were fed into a furnace for 24 h at a temperature below 105 °C to ensure less than 10% moisture content. Then, they were crushed by a ball mill and sieved in order to have homogeneous products. Only one particle size was selected: particles with a diameter between 1 and 1.5 mm. A second drying phase was carried out in a specific oven for 3 days at 70 °C to eliminate any residual moisture.
The established blends were then made with equal ratios based on orange peels:
B-OC: Blended Orange peels and Coffee grounds (50%, 50%)
B-OT: Blended Orange peels and Tea waste (50%, 50%)
B-OD: Blended Orange peels and Date pits (50%, 50%)
B-OP: Blended Orange peels and Peanut shells (50%, 50%)
B-OTC: Blended Orange peels, Tea waste and Coffee grounds (33%, 33%, 33%).
2.2. Experimental setup
The reactor used for this study is a 40 mm high cylinder shaped with a 54 mm inside diameter. It is slid vertically in the center of a heating collar covered by glass wool. This would avoid any thermal shift that may occur between the actual temperatures reached by the reactor. During pyrolysis test, 1 g of sample was placed in a crucible with 5mm depth (Figure 1).
Schematic representation of the experimental setup.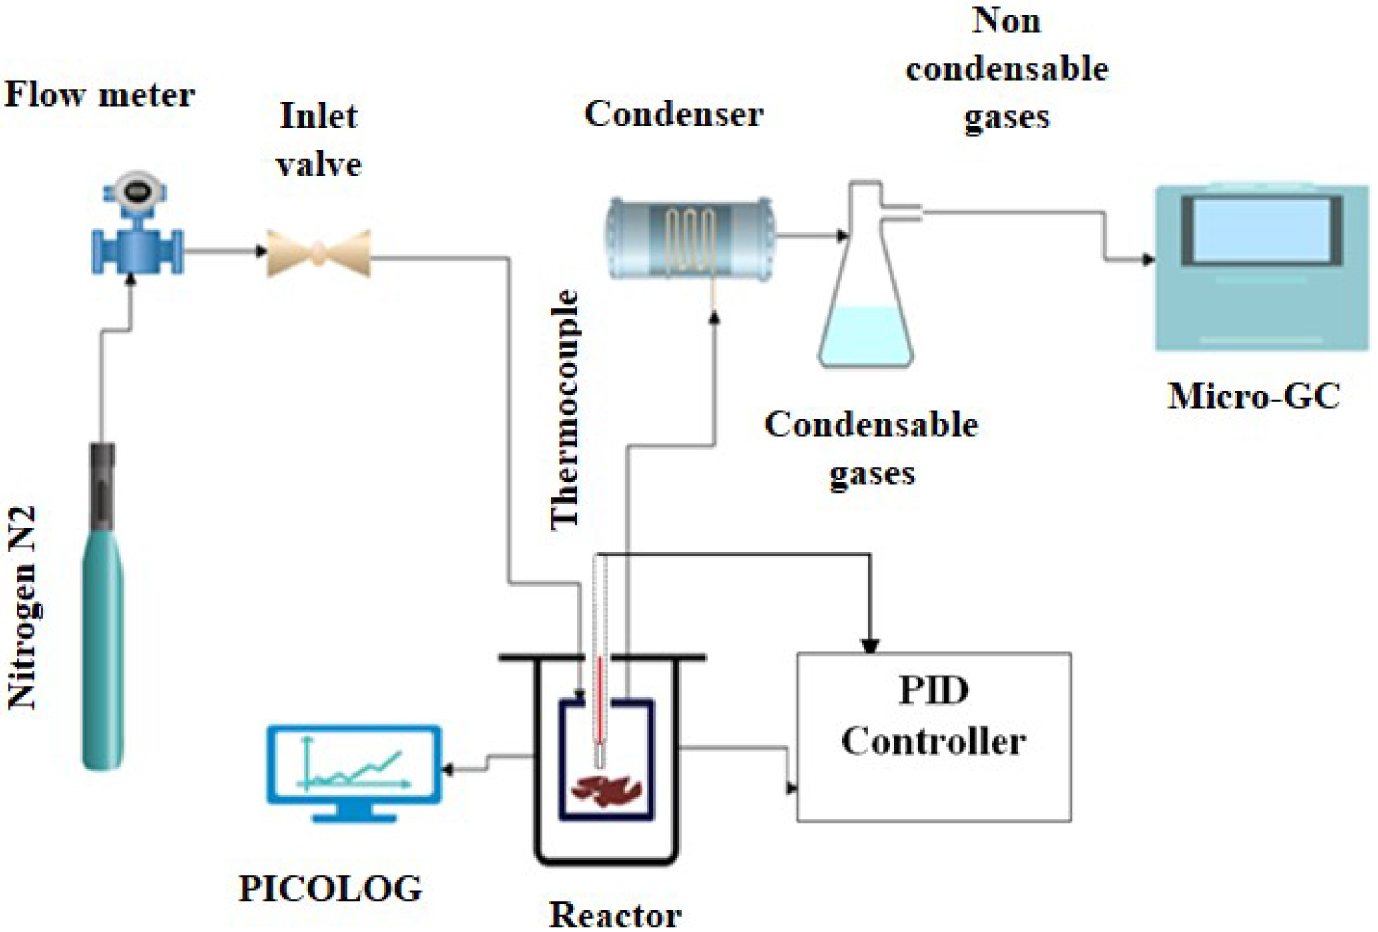
A stream of inert gas (N2) with a flow rate of 50 mL/min was introduced at the top of the reactor before launching the process in order to ensure the reaction environment inerting.
Then the pyrolysis experiments were conducted at two different heating rates (5 °C/min and 10 °C/min) for the single orange peels and at 10 °C/min for the different blends. The pyrolysis temperature was adjusted with a PID controller to reach 650 °C and then maintained for 1 h. During the experiment, a gas analysis system (Micro GC FUSION analyzer) was installed at the output of the reactor allowing the analysis of the chemical composition of the released gases. Measurements were recorded every five minutes. A first condenser was used to protect the analyzer from the water vapour released during the reaction and thus to prevent the penetration of any type of oil or tar inside the Micro-GC.
For the reaction evolution monitoring, the temperature inside the reactor was recorded during all experimentations.
After pyrolysis, the recovered bio-oils and biochars were weighed to determine their percentages, and the biogas yield was obtained using the subtraction method.
2.3. Analytical methods
Elemental analysis was performed using a CHNS elemental analyser (Flash EA 1112 Series) to determine the elemental content of carbon (C), hydrogen (H), nitrogen (N) and sulfur (S) present in the raw material. The ash content was obtained by combustion of the sample in a furnace at 900 °C for a period of 4 h [12]. However, the fixed carbon percentage was estimated by the mass difference [13].
The High Heating Value (HHV) was estimated based on the elemental analysis data (CHN–O) using Sheng and Azevedo’s correlation, as below [14]:
| (1) |
In order to understand the chemical functional groups present in the agro-waste, IR spectra were run taken from the Fourier Transform Infrared Spectroscopy (Perkin Elmer, Spectrum 2).
Atomic fluorescence spectroscopy, commonly known as X-ray fluorescence spectrometry, was employed to identify the mineral composition of the investigated samples.
The morphology of the agricultural waste was determined by using a scanning electron microscope (SEM, JEOL-JSM-6400, LF-Ja). The SEM analysis was performed to identify the agricultural waste based on their morphological structure and to foretell their agglomeration characteristics.
3. Results and discussion
3.1. Characterization of the raw materials
3.1.1. Proximate and elemental analyses
The ultimate and proximate analyses of the raw materials are shown in Table 1. The obtained values were compared with those reported in the literature for the same materials as well as for other food wastes.
Elemental and proximate analyses of the selected biomasses
| Elemental analysis (wt%) | Proximate analysis (wt%) | HHV (MJ/kg) | Ref. | |||||||||
|---|---|---|---|---|---|---|---|---|---|---|---|---|
| C | H | N | O∗ | S | Moisture content db | Volatile matter | Fixed carbon | Ash | ||||
| Orange peels | 41.05 | 6.10 | 0.91 | 51.94 | 0 | 7.65 | 73.87 | 16.18 | 2.3 | 15.95 | This work | |
| 42.40 | 5.80 | 0.60 | 51.20 | 0 | 11 | 62 | 35 | 3 | – | [15] | ||
| 44.51 | 5.99 | 1.08 | 48.20 | 0.22 | 12.84 | 70.51 | 14.05 | 2.06 | 18.32 | [16] | ||
| Coffee grounds | 49.04 | 6.85 | 2.33 | 41.78 | 0 | 7.42 | 76.80 | 14.47 | 1.31 | 18.95 | This work | |
| 54.61 | 6.59 | 3.97 | 34.83 | 0 | 1.31 | 77.51 | 19.83 | 1.35 | 22.74 | [17] | ||
| Date pits | 45.86 | 6.73 | 1 | 46.41 | 0 | 5.71 | 69.45 | 23.86 | 0.98 | 17.88 | This work | |
| 48.43 | 6.44 | 0.67 | 42.20 | 0 | 5.44 | 79.88 | 18.65 | 1.47 | 24.25 | [18] | ||
| Peanut shells | 48.52 | 5.80 | 0.71 | 44.97 | 0 | 6.33 | 76.69 | 11.28 | 5.7 | 18.06 | This work | |
| 46.86 | 6.84 | 1.03 | 44.98 | 0.29 | 5.16 | 80.24 | 8.48 | 6.12 | 18.64 | [19] | ||
| Tea waste | 45.72 | 6.04 | 2.90 | 45.34 | 0 | 7.86 | 80.04 | 8.08 | 4.02 | 17.35 | This work | |
| 46.30 | 6.1 | 3.7 | 42.80 | 1.1 | 6.31 | 70.42 | 19.52 | 3.75 | – | [20] | ||
| Potato peels | 43.49 | 6.08 | 2.78 | 47.20 | 0 | 8.07 | 68.80 | 14.38 | 8.75 | 17.36 | [16] | |
| Prickly pear | 34.70 | 5.3 | 1 | 37.90 | 0 | 7.2 | 79.90 | 16.43 | 0.95 | 14.60–15.30 | [21] | |
∗Obtained by difference; db: dry basis.
The examined biomasses are characterized by a low amount of moisture (ranging from 5.71 wt% to 7.86 wt%). Generally, for the pyrolysis process, biomasses with low moisture contents (10%) are often preferred since pre-drying is an energy-consuming step [22].
Orange peels have a high volatile content of 73.87%, which contributes to their strong reactivity and simple devolatilization during thermal decomposition. The ash content is about 2.3%, demonstrating thus its applicability as a feedstock for the pyrolysis process. In fact, due to its reduced ash percentage, such raw material can result in fewer operational complications such as slag deposition, internal pyrolyzer corrosion, burning up rate, and pollution.
Elemental analysis shows that orange peels contain high amounts of carbon (41.05%), higher than other food residues such as prickly pears and potato peel residues [16, 21]. Moreover, this biomass consists of an important proportion of hydrogen (6.10%) and oxygen (51.94%) contents.
These values are nearly close to those found for the other studied feedstock, which should favour the blending. It can be specifically mentioned those referring to peanut shells (48.52% C, 5.80% H, and 44.97% O) as well as coffee grounds (49.04% C, 6.85% H, and 41.78% O). It is commonly acknowledged that biomass with a high proportion of organic materials is conducive to thermal degradation since organic-rich residues are extremely reactive, simple to devolatilize and generate a significant proportion of biochar via pyrolysis, mainly with low O/C and high H/C ratios. These ratios, an indicator of fuel quality and type, are particularly crucial if the biochar is going to be used as an energy source alternative in fields, such as the transportation sector, that require a pure and homogeneous fuel flow.
Moreover, orange peels and date pits are composed of low nitrogen (0.91% and 1% respectively) and almost no sulfur which inhibits hazardous gases (NOx, SOx) [23], while coffee grounds and tea waste consist of more nitrogen (2.3% and, 3.8% respectively) than the other lignocellulosic biomasses.
The high heating values vary between 14.60 and 22.74 MJ/kg. These measured results are in line with what was stated by previous researchers [15, 16, 17, 18, 19, 20]. The calorific values of the investigated residues are insufficient to allow their direct use as a commercial fuel. As a result, these samples must be enhanced by the pyrolysis process, which appears to be the best procedure for generating biochar with increased calorific value, constituting thus a novel fuel source.
Table 2 shows the different mineral contents of the examined biomasses. Potassium (K) and calcium (Ca) are the most abundant elements that subsequently constitute the basic mineral composition of these raw materials. Concerning the distribution of the other elements (Mn, Fe, Cl, Sr, etc.), small proportions are obtained that differ from one biomass to another according to their composition. The presence of inorganic minerals, and more specifically alkaline metals (K, Na, etc.) and alkaline earth metals (Mg, Ca, etc.) have a direct effect on the distribution of pyrolysis products [12]. In fact, potassium in the mineral matter of biomass acts as a catalyst that promotes the generation of biochar in favour of derived bio-oil [12]. In this study, date seeds, peanut shells and coffee grounds contain the greatest K proportions, suggesting they are adequate materials for pyrolysis in order to recover solid residue.
Mineral composition of the selected wastes∗
| Orange peels | Peanut shells | Coffee grounds | Date pits | Tea waste | |
|---|---|---|---|---|---|
| Ca (%) | 62.58 | 31.87 | 31.4 | 17.51 | 62.74 |
| K (%) | 30.30 | 47.54 | 54.88 | 55.42 | 11.82 |
| Mn (%) | – | – | – | – | 7.75 |
| Fe (%) | 0.93 | 2.23 | 1.79 | 4.35 | 4.07 |
| P (%) | 2.09 | 4.97 | 6.11 | 7.52 | 3.56 |
| Cl (%) | 2.39 | 5.47 | – | 7.62 | 3.46 |
| S (%) | 1.01 | 5.59 | 4.63 | 5.23 | 3.28 |
| Si (%) | – | 1.23 | – | – | 2.74 |
| Cr (%) | – | 0.74 | 1.12 | 1.41 | 0.55 |
| Cu (%) | 0.37 | 0.34 | – | 0.63 | – |
| Sr (%) | 0.32 | – | – | – | – |
| Zn (%) | – | – | – | 0.29 | – |
∗Values are provided on dry basis.
3.1.2. Thermogravimetric analysis
The TG data, T (temperature), X (mass loss), Tpeak (peak temperature), dX/dt (mass loss rate) and RM (mean reactivity) are shown in Table 3. The DTG curves (Figure 2) for biomass can be divided into two main categories. The first type is the one characterized by two degradation zones. These zones are discernible by two peaks indicating that the volatiles are released in two stages during the pyrolysis. The second type of DTG curve is distinguished by a single peak indicating that the degradation of the hemicellulose and the cellulose occur simultaneously. As for lignin, which is the most stable component, it always decomposes during the last pyrolysis phase at a higher temperature. In the present case and regarding the first peak observed during the first stage of analysis (<150 °C), the corresponding mass losses can be attributed not only to the elimination of the residual moisture but also to the release of the light molecular volatile species. The thermal decomposition of date pits and orange peels can be dissociated into two stages: the first step corresponds to the degradation of hemicellulose that starts at 220 °C and ends at 330 °C with −0.173%⋅s−1 mass loss rate and between 155 °C and 293 °C with a mass loss rate of −0.084%⋅s−1 respectively. The following stage is where cellulose decomposes and takes place between 330 °C and 450 °C with −0.049%⋅s−1 mass loss for date pits and develops in the temperature range of 293 °C–420 °C with −0.065%⋅s−1 loss rate in the case of orange peels. These findings perfectly agree with results deducted by several other researchers [12, 16] whose biomass DTG profiles, as well as the main degradation zones were almost identical to these investigated samples. Concerning the tea waste decomposition, the first stage of pyrolysis (230–275 °C) can be principally tied to the hemicellulose degradation with a mass loss rate of −0.015%⋅s−1. The second phase occurs between 275 and 440 °C and can be assigned to the cellulose breakdown (−0.033%⋅s−1), which is consistent with the findings of other studies [20, 24]. The same behaviour is observed for coffee grounds with slightly different zones and comparable mass loss rates to that of tea waste. A similar result was reported by Bejenari et al. [25]. The stages with important mass loss rates are considered as active pyrolysis stages and radical devolatilization reactions take place. Since the sample mass loss is negligible beyond 500 °C, it may be concluded that the thermal decomposition is accomplished and the solid residue is formed at this temperature. Unlike the previously cited biomasses, the DTG curve of peanut shells showed one major peak at 350 °C, indicating that the decomposition of hemicellulose and cellulose occurred in one single phase, in agreement with the outcomes elicited by Cai et al. [26]. In conclusion, the hemicellulose of these biomasses is more reactive than the other two previous ones (Table 3).
TG and DTG curves of biomass samples at 10 °C/min: (a) OP, (b) DP, (c) PS, (d) TW, (e) CG.
TG parameters of the raw biomasses and their derivative blends in the different pyrolysis zones
| Raw materials | Blends | ||||||||||||
|---|---|---|---|---|---|---|---|---|---|---|---|---|---|
| OP | TW | CG | PS | DP | B-OP | B-OC | B-OT | B-OD | B-OTC | ||||
| Pyrolysis zone | T (°C) | 155 | 230 | 285 | 235 | 220 | 175 | 198 | 170 | 187 | 193 | ||
| – | – | – | – | – | – | – | – | – | – | ||||
| 700 | 700 | 700 | 700 | 700 | 700 | 700 | 700 | 700 | 700 | ||||
| X (%) | 26.6 | 27.8 | 23.5 | 25.8 | 22.1 | 25 | 21.3 | 24.2 | 22.3 | 20.6 | |||
| – | – | – | – | – | – | – | – | – | – | ||||
| 94.6 | 91.5 | 90.8 | 93.8 | 95.1 | 96.7 | 93.2 | 94.5 | 92.5 | 93.2 | ||||
| Active pyrolysis | Zone 1 | T (°C) | 155 | 230 | 285 | 235 | 220 | 175 | 198 | 170 | 187 | 193 | |
| – | – | – | – | – | – | – | – | – | – | ||||
| 293 | 275 | 398 | 473 | 330 | 265 | 240 | 298 | 279 | 294 | ||||
| X (%) | 94.6 | 91.5 | 90.8 | 93.8 | 95.1 | 96.7 | 93.2 | 94.5 | 92.5 | 93.2 | |||
| – | – | – | – | – | – | – | – | – | – | ||||
| 60.2 | 81.2 | 43.7 | 34.7 | 50 | 69 | 76.5 | 74.2 | 75 | 78.9 | ||||
| Tpeak 1 (°C) | 210 | 210 | 320 | 350 | 300 | 235 | 221 | 240 | 230 | 243 | |||
| R1 (%⋅s1) | −0.084 | −0.015 | −0.11 | −0.12 | −0.173 | −0.045 | −0.041 | −0.055 | −0.039 | −0.042 | |||
| Zone 2 | T (°C) | 293 | 275 | 398 | – | 330 | 265 | 240 | 298 | 279 | 294 | ||
| – | – | – | – | – | – | – | – | – | |||||
| 420 | 440 | 500 | 450 | 455 | 463 | 456 | 415 | 445 | |||||
| X (%) | 60.2 | 81.2 | 43.7 | – | 50 | 69 | 76.5 | 74.2 | 75 | 78.9 | |||
| – | – | – | – | – | – | – | – | – | |||||
| 30.5 | 37.5 | 28.3 | 35.1 | 34.5 | 33.4 | 40.2 | 41.5 | 41.4 | |||||
| Tpeak 2 (°C) | 342 | 380 | 488 | – | 400 | 384 | 320 | 398 | 330 | 334 | |||
| R2 (%⋅s−1) | −0.065 | −0.033 | −0.04 | – | −0.049 | −0.085 | −0.071 | −0.062 | −0.084 | −0.065 | |||
| RM × 103 (%⋅s−1⋅°C−1) | 0.6 | 0.2 | 0.4 | 0.3 | 0.7 | 0.4 | 0.41 | 0.38 | 0.42 | 0.37 | |||
| Passive pyrolysis | T (°C) | 420 | 440 | 500 | 473 | 450 | 455 | 463 | 456 | 415 | 445 | ||
| – | – | – | – | – | – | – | – | – | – | ||||
| 700 | 700 | 700 | 700 | 700 | 700 | 700 | 700 | 700 | 700 | ||||
| X (%) | 30.5 | 37.5 | 28.3 | 34.7 | 35.1 | 34.5 | 33.4 | 40.2 | 41.5 | 41.4 | |||
| – | – | – | – | – | – | – | – | – | – | ||||
| 26.6 | 27.8 | 23.5 | 25.8 | 22.1 | 25 | 21.3 | 24.2 | 22.3 | 20.6 | ||||
Regarding the DTG of the blends (Figure 3), it was noted that the orange peels have significantly impacted the degradation process of the carried blends. The DTG profile of these samples in their pure form was characterized by a single peak (in the case of peanut shells) or two non-pronounced-peaks. After blending with orange peels, the DTG profiles of our investigated biomasses became distinguished by two visible peaks corresponding to the release of the volatile products (Table 3). This will be thereafter confirmed through the pyrolysis tests, the results of which will be discussed in Section 3.2.1.
TG and DTG curves of orange based-blends at 10 °C/min: (a) B-OP, (b) B-OC,(c) B-OTC, (d) B-OD, (e) B-OT.
In contrast to the pure orange peel pyrolysis, the solid residues recovered from the pyrolysis of blends were substantially lower (Table 3). This is likely attributed to the gaseous species emission due to the thermal degradation of volatile matter and especially that of cellulose, the degradation of which favours the production of biogas in terms of quantity and quality.
3.2. Pyrolysis of pure orange peels
3.2.1. Yields
After pyrolyzing orange peels at a heating rate of 10 °C/min, the yield of the recovered solid residue was 32.05%. This recorded amount is in agreement with the previous works which position the yield of generated biochar between 21% and 57% [4, 7, 9, 10, 27]. Regarding the volatile products (gas + liquid), the recovered gas reached 39.88% while the bio-oil yield was 28.07%. This latter seems rather low when comparing it to those obtained by other studies [7, 28, 29] where they achieved mass yield values of 35 to 53% after pyrolysis of citrus residues. However, overall, the pyrolysis of such biomass under a heating rate of 10 °C/min can be seen as a viable alternative, allowing for the simultaneous valorization of the three types of derivative products (solid, liquid, and gaseous) with significant amounts.
3.2.2. Biochar functional group analysis: FTIR analysis
The FTIR spectra of dried orange peels and their derived biochar are presented in Figure 4. Analysis of the pure biomass spectra indicates the presence of characteristic bands corresponding to the existence of the bonds and chemical groups of which they are formed, the hemicellulose, cellulose and lignin. The largest band in the highly energetic range (3100–3500 cm−1) is allocated to the free and intramolecular hydroxyl compounds associated with a significant percentage of OH groups originating from carbohydrates, lignin, together with both symmetric and asymmetric stretching vibrations related to H2O molecules [30]. The particular peak detected at 2936 cm−1 is attributed to the existence of stretching vibrations C–H accompanied by two peaks around 2100 cm−1 and 2300 cm−1 [31], which can be assigned to C≡C and C≡N respectively, giving thus the basic structure of these lignocellulosic components. The band at 1915 cm−1 corresponds to aliphatic and/or unsaturated aromatic constituents [32]. The peak observed at 1750 cm−1 corresponds to C=O vibrations in carboxylic acid and/or carbonyl groups of esters, whereas the peak seen at 1632 cm−1 is due to C=C vibrations. In addition, S=O elongations contained in sulfates are distinguished by bending vibrations at around 1415 cm−1. Finally, the intense peak at 1050 cm−1 corresponds to the C–O bond present in primary alcohols and/or esters. Moreover, by analyzing the spectra of the derived biochar, it can be determined that the majority of the peaks previously detected in the pure sample appear again but with less attenuated transmittances; this can be explained by the rupture of the various covalent bonds that constitute the sample during pyrolysis. In addition, by converting the pure biomass to its biochemical form (biochar), the simple bonds are transformed into aromatic bonds, and this has been well confirmed by the development of new peaks in the wave zone of [600–1000] that correspond to the C–H vibrations existing in the aromatic groups [30].
FTIR spectra of pure orange peels and their biochars.
3.3. Pyrolysis of blends
3.3.1. Yields
Even if the goal of the blending was the char investigation in terms of quantity and quality, the most striking observation concerns the gas yield. Indeed, almost all blends, except the orange-tea mixture, resulted in a significant increase in gas yields from 39.88% to 44.63%–56.04% (Figure 5). The exception of B-OT was ineffective for boosting gas production with a proportion of 28.20% but very suitable for bio-oil generation (40.48%) via the pyrolysis process.
Yields of different products derived from the pyrolysis of the pure OP and its derivative blends at 10 °C/min.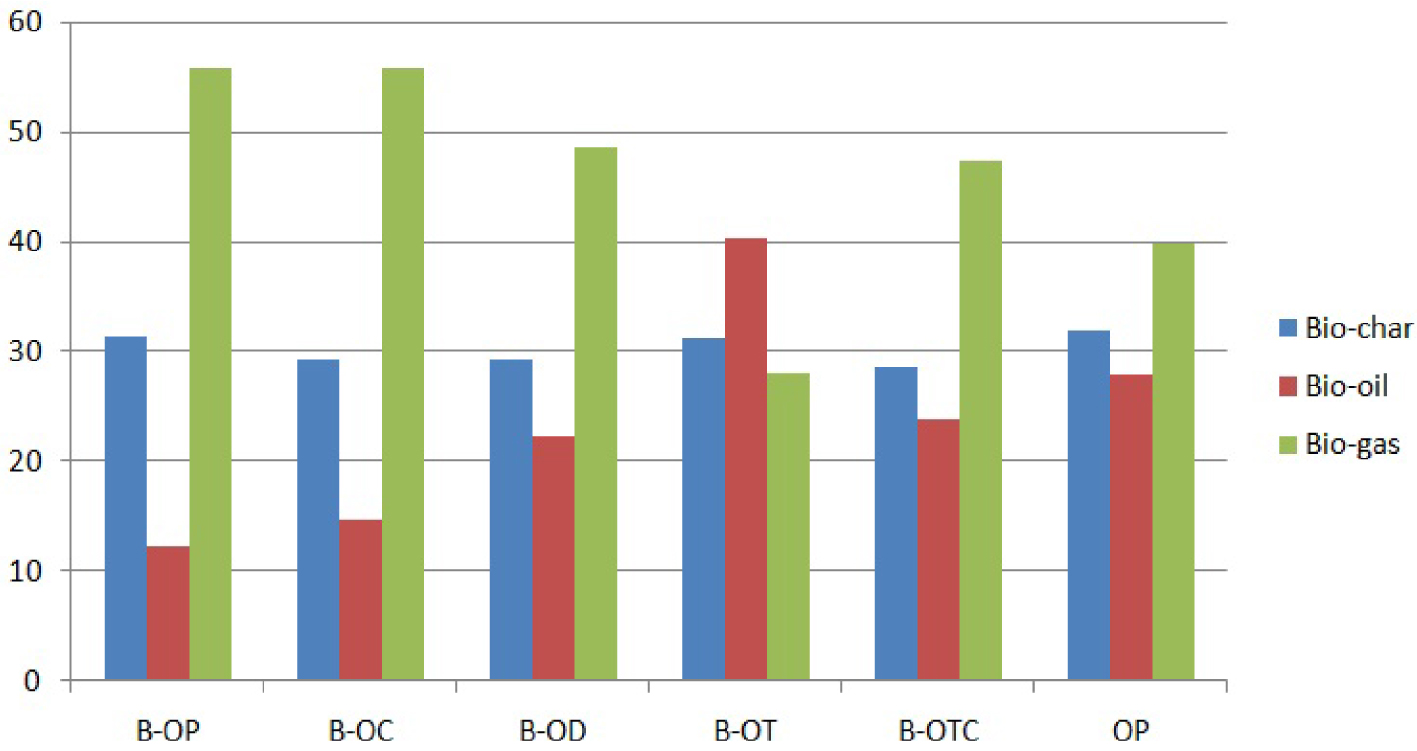
Compared to OP, the char yields of the blends did not substantially change. Indeed, the percentages of biochars obtained from different blends ranged from 28.66% to 31.57%. These values are close to the values provided by Tariq et al. [33] when co-pyrolyzing orange peels with oil palm and empty bunch fruit biomass. They showed that the resultant char residues generated for both individual and biomass blends varied from 28.6–36.8%. However, compared to the char produced by the pyrolysis of coffee grounds (27.83%) and date pits (27.78%), it is noticed that their mixture with orange peels boosted the char formation (29.36%). Moreover, peanut shells as well as tea waste seemed to have the highest solid residue yields of 31.57% and 31.32%, respectively. It also follows that the other mixtures recorded liquid yields, which range from 14.72% to 26.01%.
Finally, the reported outcomes have well confirmed that the orange-peanut blend was particularly advantageous in terms of generating biochar residue as well as enhancing gas yield, as compared to pure orange peels or even the other carried blends.
3.3.2. Biochar functional group analysis by FTIR
Figure 6 represents the different FTIR spectra related to biochars obtained by the various blends. There were strong similarities observed between the biochars of the various samples performed, but there are also some differences that can be highlighted. In the undulating area 1900–2400 cm−1, several peaks are attributed to the C≡C and C≡N stretchings, which correspond to the alkynes and nitriles respectively. On the other hand, the peaks that are detected in the range 1680–1760 cm−1 are linked to C=O elongation found within the carbonyl, aldehyde, ester and carboxylic groups. The wide band that is observed at wavelengths between 1000 and 1600 cm−1 for orange-dates, orange-peanut, orange-coffee-tea and orange-tea mixtures turns into more attenuated peaks in the spectra of the orange-coffee blend, confirming that the structure of the molecules constituting the functional groups of the residual biochars is distinct. Thus, the peaks detected at around 1500–1600 cm−1 may correspond to the C=C bonds contained in alkenes, as well as the N–O stretching present in nitro components. The peaks in the 1200–1400 cm−1 undulating zone can be attributed to S=O vibrations associated with sulfate groups. The largest peaks, visible between 1000 and 1200 cm−1, are ascribed to the elongation of C–O bonds in carboxylic groups, esters, ethers, or alcohols. Several compounds such as cellulose, hemicellulose and lignin, can explain the presence of these vibrations. Moreover, the wavelength range between 500 and 1000 cm−1 is probably due to the C–H bonds that exist in the aromatic groups as well as the alkenes. However, the spectra of the various biochars show significant differences concerning the intensity of the peaks detected in all the bands defined above. This fact seems quite logical following the different chemical compositions, which makes the uniqueness of each blend. This same observation (the attenuation of the intensity of the peaks measured) is also accurate in relation to the dissimilarities observed between biochars and their primary samples (blends before pyrolysis) which do not differ too much from the spectrum of pure orange peels.
FTIR spectra of orange-based blends at 10 °C/min: (a) B-OP, (b) B-OC, (c) B-OD, (d) B-OT, (e) B-OCT.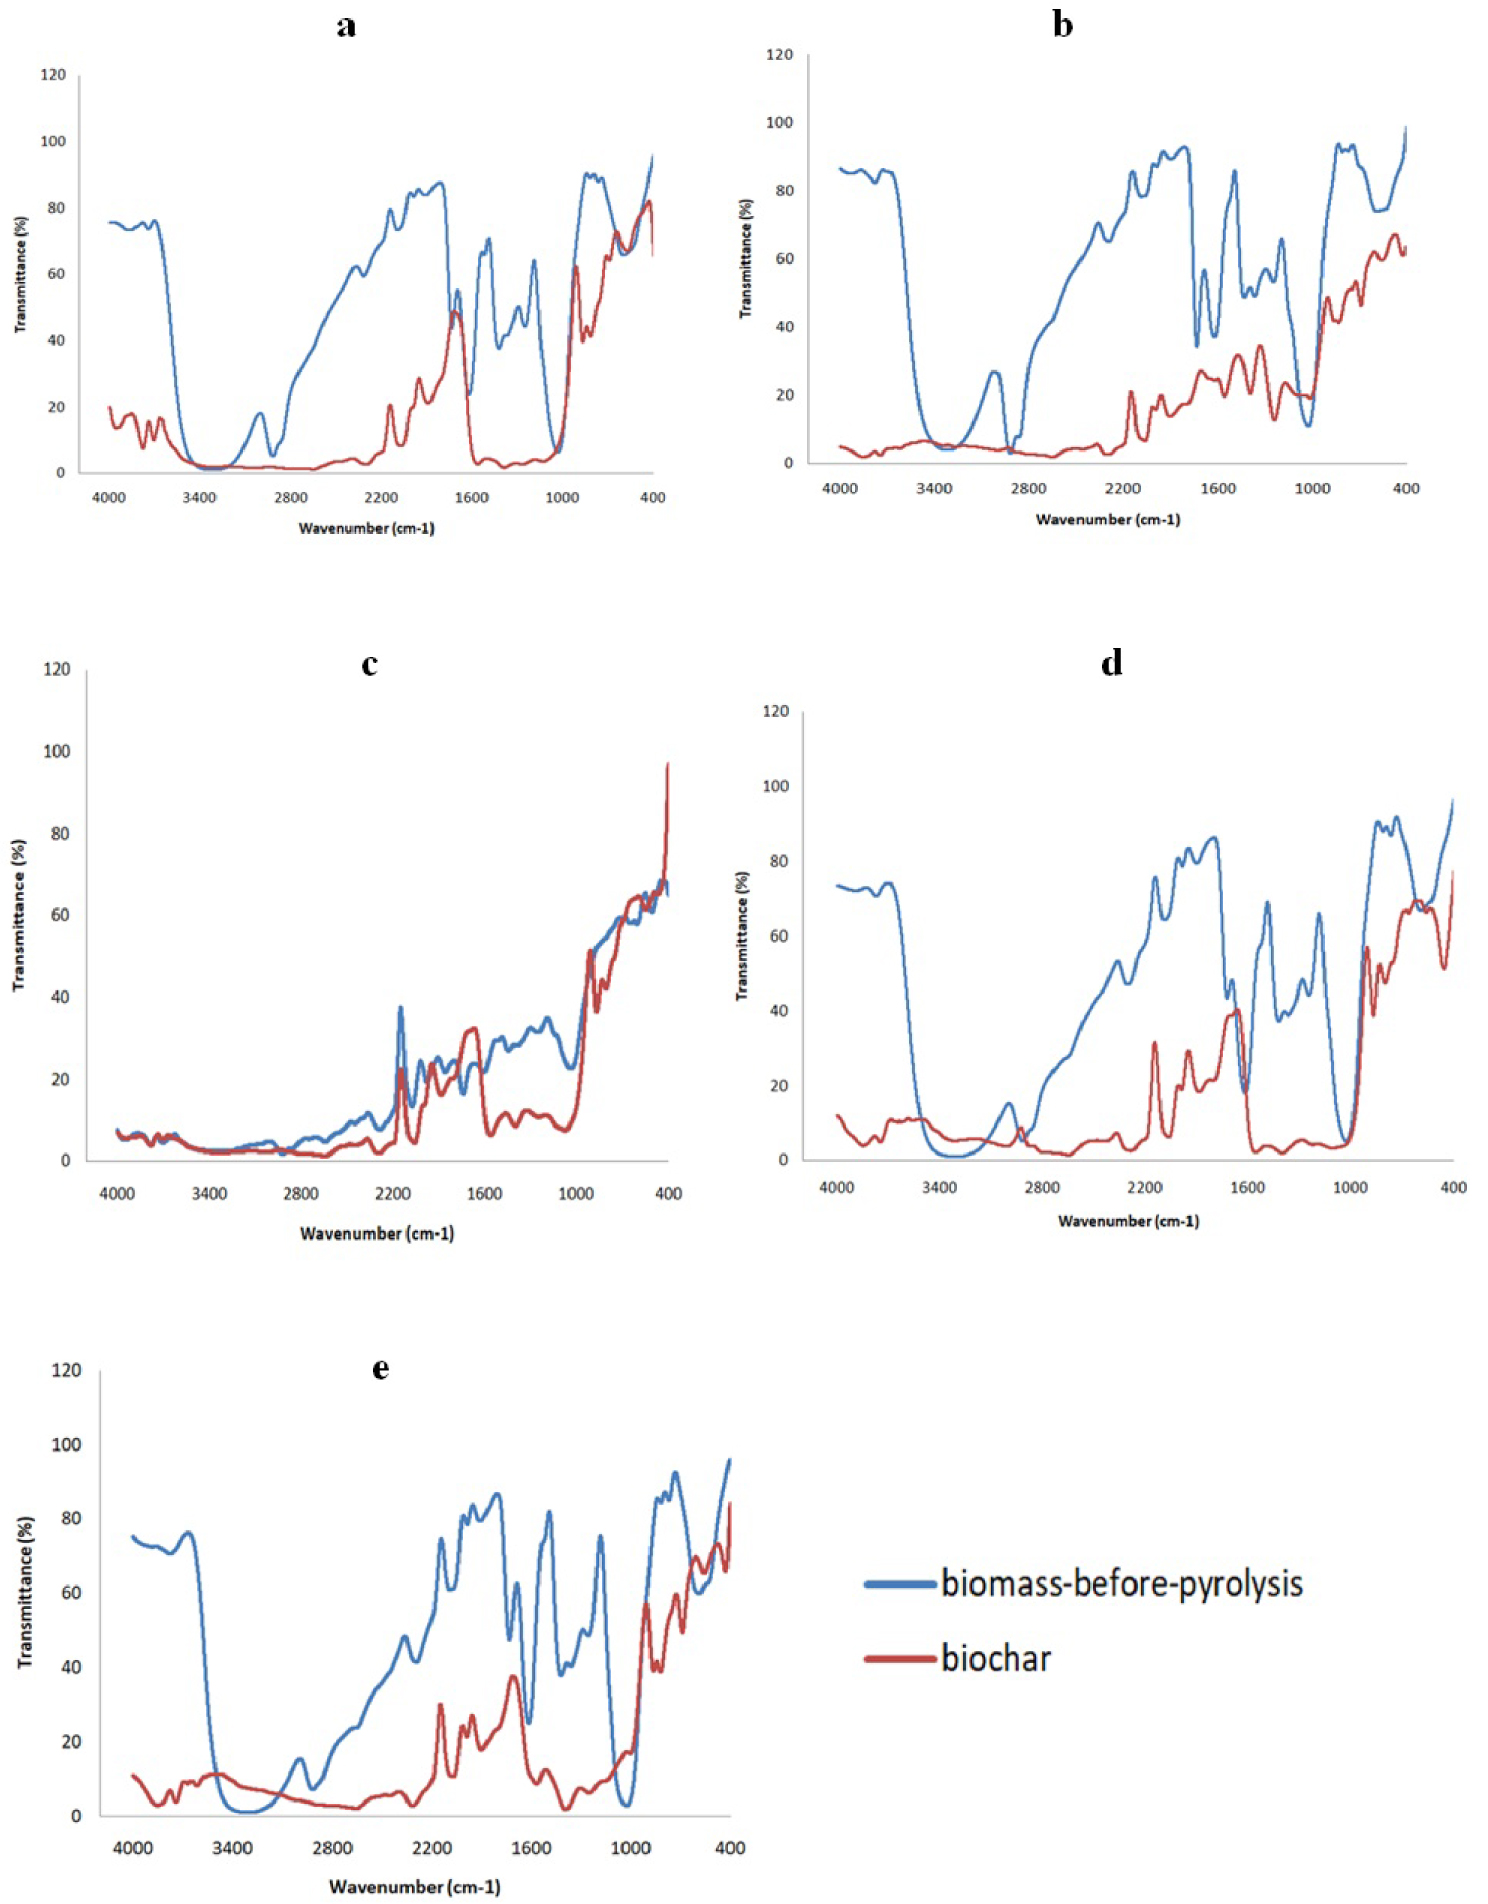
3.3.3. Biochar morphology characterization by SEM
Scanning electron microscope (SEM) was used to examine morphological changes in both pure orange peels and their derivative blends by visualizing the upper surface of the different resulting biochars. Figure 7 displays the SEM images at various magnifications. The samples noticeably show significant morphological differences between the raw orange peels and the final combinations. Developing blends results in partial morphological changes compared to the primary components of the pure biomass sample. The pure sample’s 5000-fold magnified image depicts an extremely rich exterior surface on which the pores of the biomass are clearly visible and different forms are observed such as fluffy sponges, balls and simply small formless particles. These structures are expected to benefit the water permeation and to facilitate the uptake of pollutants from aqueous solutions. Before pyrolysis, the SEM images of the different blends presents a heterogeneous structure with a significant concentration of organic matter conglomerates on the surface, which seems relatively smooth with significant pores. The pyrolysis results in visible differences in surface structure. Indeed, after pyrolysis, all the biochars develop a fairly high porosity with a clear presence of spherical pores due to the loss of moisture and volatile matter. The chars’ surfaces appear to be rougher, with less sharp forms on particle edges, fewer conglomerated surface forms and thin walls randomly generated and distributed with the presence of some porosity. This might be attributed to the disintegration of the contained volatile organic matter into soluble short sugar molecules. The orange-date waste exhibits irregular coral-shaped structures accompanied by large amounts of dense holes. As for the orange-coffee-tea blend char, the structure is sponge-like, undefined and rough, with numerous pores on the surface. It is also interesting to observe that the orange-coffee waste produces smaller pores compared to the other blends. In fact, the porous structure grows more pronounced in (B-OC), revealing its viability as catalyst support and adsorbent. It is more likely to contribute significantly to the improvement of soil quality when applied as a soil conditioner. However, for the other blends, the external pores are separated into fibres. This reflects a loss of cohesion of structural blocks and a partial regeneration of biomass. This phenomenon is probably due to the release of certain alkaline and alkaline earth minerals initially present in the biomass, which guarantees the binding of structural units (cellulose, fibres) using electrostatic and Van der Waals interactions [31].
SEM images of the different biochars obtained at 10 °C/min.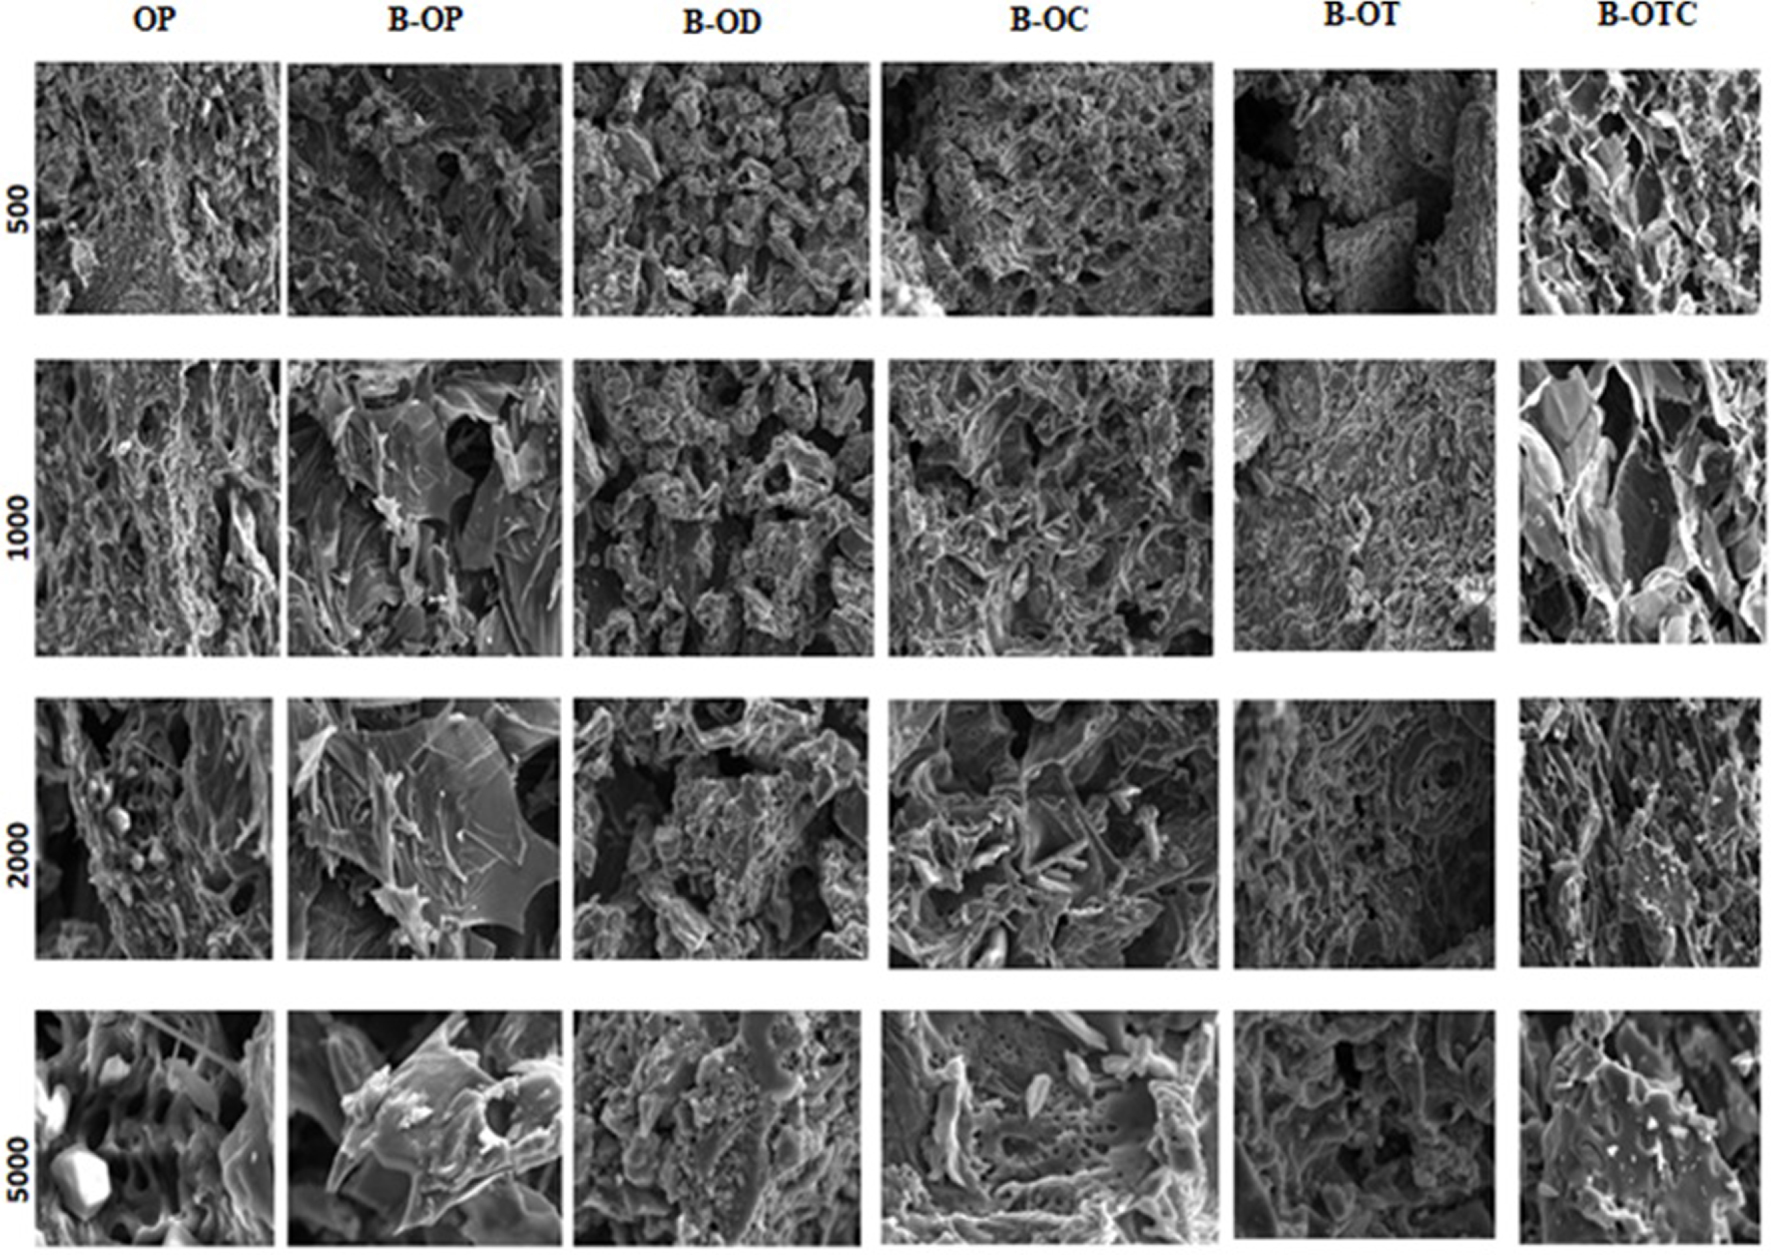
4. Conclusion
To enable the valorization of agricultural waste, developing technologies to convert waste into value-added products is critical to ensure environmental, social and economic sustainability. In this context, the current study investigated the pyrolysis of single orange peels but also and more importantly, the co-pyrolysis of orange peels blended with other problematic agro-wastes, namely date pits, coffee grounds, peanut shells as well as tea waste. All these biomasses could be implemented as suitable candidates for the generation of interesting biochars in terms of quantity and quality. More precisely, Orange peels-Peanut shells blend (B-OP), as well as Orange Peels-Tea waste blend (B-OT) were shown to be the optimal choices for generating biochar with yields of 31.57% and 31.32%, respectively. Meanwhile, the Orange peels-Date pits blend (B-OD), along with the Orange peels-Coffee grounds blend (B-OC) exhibited the same biochar rate of 29.36%. Even though this last rate is less than that of (B-OT) and (B-OP), it should be noted that this is superior to the char outputs of the sole coffee grounds (27.83%) or the sole date pits (27.78%) before their blending with orange peels, indicating the positive effect of the addition of this last biomass on the enhancement of their char yields.
Interestingly, all the applied combinations (except B-OT) led also to an improvement in the biogas production. For example, the biogas yield increased by about 40%, from 39.88% w/w for pure orange peels to 56.04% w/w for the Orange-Peanut blend (B-OP).
FTIR and SEM analyses showed that biochars from orange-based blends exhibited a relatively high porous area, especially for the orange-coffee mixture, proving its capacity to serve as a catalytic support. It can also contribute effectively to the enhancement of soil quality when applied as a soil conditioner. Until now, the lack of information regarding pilot-scale systems and industrial transfer represents one of the limitations of this study. Future studies would help providing the proper solutions by using large devices to confirm these promising results through testing more heating rates. These findings will also be completed by future works on biogas generation to ensure a sustainable blended orange by-products waste management and to guarantee a circular economy within energy reliability for the agri-food industry.
Conflicts of interest
Authors have no conflict of interest to declare.
Acknowledgment
We gratefully thank Mohamed Ouerhani for his assistance in carrying out the experimental tests.