

 CC-BY 4.0
1. Introduction
Energy plays an important role in the world in the present and will so in the future. Socioeconomic development depends on its production and on its long-term availability in increasing quantity from sources that are reliable, safe, and environmentally sound. Over millennia, humans have found ways to extend various sources of energy ranging from wood, coal, oil, and petroleum to nuclear power. Renewable energy sources such as biomass, small hydropower, and geothermal, solar, and wind energy have a share of 14% in total world energy consumption of which 62% is biomass [1]. Biomass is considered an interesting energy source due to several reasons. The main reason is that bioenergy can make a substantial contribution to sustainably meeting future energy demand. Resources are often locally available as is waste. Biomass allows not only waste management but also energy and chemical recovery using thermochemical conversion processes.
Thermochemical processes can be categorized into gasification, combustion, and pyrolysis. Pyrolysis has attracted more attention than the other thermochemical processes due to the possibility of optimizing its conditions to produce high energy density pyrolytic bio-oil as well as derived bio-char and bio-gas [2, 3, 4]. The liquid product (bio-oil) can be used directly or upgraded using further physicochemical processes, heat boilers, drive diesel engines, or turbines. As it is in liquid form, it can be easily transported and stored more efficiently than the original biomass. The combustion of pyrolysis oils results in zero net contribution to carbon dioxide (CO2) emissions as the burned carbon is fixed by biomass during its lifetime. Furthermore, during the burning of bio-oils, there are no sulfur oxide (SOx) emissions and very low nitrogen oxide (NOx) emissions when compared to fossil fuels. Therefore, it may be a potential fuel replacement in the future [5, 6, 7]. The use of the solid product (bio-char) in various environmental applications including adsorption (for water pollutants and air pollutants), catalysis (for syngas upgrading, biodiesel production, and air pollutant treatment), and soil conditioning has been discussed. The recent research trend for bio-char in other applications, such as fuel cells, super-capacitors, and hydrogen storage, has also been reviewed.
The main sources of biomass are agricultural wastes such as olive and date wastes. These agricultural wastes are available in large quantities, and their use does not compromise food crops. In addition, they may be a potential fuel replacement in the future [8]. The date palm is one of the main fruit crops in arid and semi-arid regions in Morocco. About 105 million date palms are currently being grown around these regions. The production of dates has seen considerable expansion over the last decade, rising from 0.4 million tons in 2006 to 2.4 million tons in 2018 [9]. The expansion of fruit production has naturally led to the increase in waste every year. For this reason, exploitation of this palm waste would help us to (i) improve waste disposal, (ii) produce new value-added materials, and (iii) provide livelihoods for people in these areas. Therefore, a systematic and comparative investigation of the distribution of pyrolysis products was performed using a fixed-bed reactor. We note that the effects of distinct conditions on pyrolysis product yields from date stone have not yet been reported in detail in the literature. However, the use of date stones for pyrolysis has been reported in the literature [10, 11, 12]. However, all these works investigated the pyrolysis of date stones in N2 atmosphere and did not examine the effect of pyrolysis conditions such as temperature, heating rate, and other parameters on the bio-oil and the bio-char yield. Besides, the effect of pyrolysis conditions on the production of bio-oil from date stones via pyrolysis was only reported by Fadhil et al. [13], who investigated the effect of individual parameters and did not examine the combined effect of all process parameters. It is time-consuming and requires several experiments to determine the optimal levels. This process could be unreliable. These limitations of the classical method can be eliminated by optimizing all the process parameters collectively using a statistical experimental design such as the Box–Behnken experimental design (BBD). The most important aim of this optimization study is to gain the optimal amount (quantity) of bio-oil and bio-char by the pyrolysis process.
This work aims to study the combined effect of three process parameters, namely, pyrolysis temperature, heating rate, and particle size, on the bio-char and bio-oil yield from date stones based on the BBD. Under the optimal condition, the pyrolytic bio-oil and bio-char were characterized using elemental analysis, Fourier transform infrared spectroscopy (FTIR), proton nuclear magnetic resonance (1H-NMR), gas chromatography–mass spectrometry (GC–MS), and scanning electron microscopy (SEM).
2. Materials and methods
2.1. Chemicals and reagents
To evaluate the local by-products in terms of energetic valorization, we used biomass-based date stones from the region of Errachidia in Morocco as the feedstock.
All the chemicals used in this study were of analytical grade. They were used without any further pre-treatment. Iodine (I2), sodium thiosulfate (Na2S2O3 ⋅ 5H2O), Na2CO3, NaHCO3, and HCl (37%) were purchased from Sigma-Aldrich (Germany). NaOH was purchased from Merck (Germany), potassium iodide (KI) from Pharmac (Morocco), and methylene blue (C16H18ClN3S) (85%) from Panreac (Spain). All the instruments and apparatuses used in this work are mentioned in Section 2.3.
2.2. Pyrolysis procedure
The pyrolysis experiments were carried out in a fixed-bed reactor. An electric furnace was used to heat the reactor externally. Then, the reactor was cooled down to a temperature equal to 0 °C with an ice–salt bath. The condensed liquid products did not only contain the oil phase product but also the aqueous phase products. They were separated by decantation after being washed with dichloromethane. Pyrolytic oil or bio-oil was dried using anhydrous sodium sulfate and was collected by evaporating the solvent at a temperature of 60 °C followed by calculating its yield. After cooling the pyrolysis reactor, the solid (bio-char) was removed and weighed. The amount of gas released was then calculated by subtracting the amount of solid and liquid products from the amount of initial raw material. Repeatability expressed using the relative standard deviation was less than ±0.5%, which was obtained thrice.
2.3. Characterization of raw materials and bio-oil and bio-char
2.3.1. Proximate and ultimate analyses
The proximate analysis was conducted using a thermogravimetric analyzer (METTLER TOLEDO TGA/DSC 3+). The moisture content was determined by mass loss after the sample was heated to 105 °C in N2. Volatile matter corresponds to the mass loss between 105 and 900 °C in N2. Fixed carbon is the solid combustible material that leads to the mass loss at 900 °C when the atmosphere is switched from N2 to air; the residue left is the ash content.
The ultimate analysis for C, H, N, and S content was performed using an elemental analyzer (vario MICRO cube V4.0.2). The H/C and O/C molar ratios and empirical formula were calculated from elemental composition. The higher heating value (HHV) of the samples was experimentally measured using a bomb calorimeter (Model 1261, Parr Instrument) according to ASTM D5865-04.
2.3.2. Infrared spectroscopy
Surface functional groups were determined by using an FTIR spectrometer (FTIR-2000, PerkinElmer). The spectrum was recorded in the range 400–4000 cm−1.
2.3.3. Scanning electron microscopy
Surface morphologies of the optimally prepared activated carbon were studied by SEM and energy-dispersive X-ray spectroscopy. The SEM images were recorded using TESCAN VEGA3 at an accelerating voltage of 20 kV.
2.3.4. Iodine number
The iodine number is the most fundamental parameter used to characterize the performance of activated carbon. It is a measure of the micropore (0–20 Å) content of activated carbon by the adsorption of iodine from solution according to the ASTM D4607-94 method. The experiment consists in treating 1 g of activated carbon with 10 mL of 5% HCl. This mixture is boiled for 30 s and subsequently cooled. Soon afterward, 100 mL of 0.1 mol⋅L−1 iodine solution is added, shaken for 30 min, and filtered. The resulting solution is filtered and 50 mL of the filtrate is titrated with 0.1 mol⋅L−1 sodium thiosulfate by using starch as an indicator.
2.3.5. Methylene blue index
The methylene blue index (MBI) is a measure of mesoporosity (2–5 nm) present in activated carbon. It is defined as the maximum amount of dye adsorbed by 1 g of adsorbent. It is also determined according to the standard method (JIS K 1470-1991). In this assay, 0.1 g of activated carbon was placed in contact with 100 mL of methylene blue solution at different concentrations (20 −−500 mg⋅L−1) for 24 h at room temperature (approximately 25 °C). After shaking for 24 h, the suspensions were filtered and the remaining concentration of methylene blue in the solution was determined by a spectrophotometric method at a 𝜆 max value of 665 nm. Standard solutions of methylene blue were used for calibration.
2.3.6. Boehm titration
The Boehm titration method was used to quantify the basic and oxygenated acidic surface groups on activated carbons. Generally, carboxyl, phenolic hydroxyl, and lactonic groups are acidic, while the basicity of activated carbon derives primarily from delocalized π-electrons of graphene structure with a small contribution from oxygen-containing surface functionalities (such as pyrene, chromene, and quinone). These surface functional groups were quantified by back-titration with NaOH solution for acidic groups and with HCl solution for basic groups.
Experimentally, approximately 0.1 g of each sample was mixed with 50 mL of 0.01 mol⋅L−1 aqueous reactant solution (NaOH, or Na2CO3, or NaHCO3). The mixtures were stirred for 24 h at room temperature. Then, the solid phase was filtrated by a 0.45 mm membrane filter. To determine the oxygenated group’s content, titrations of the filtrate approximately 10 mL were performed with standardized HCl (0.01 mol⋅L−1). The numbers of all acidic sites were calculated under the assumption that NaOH neutralizes carboxylic, phenolic, and lactonic groups. Basic groups’ contents were also determined by titration of the filtrate with NaOH (0.01 mol⋅L−1).
2.3.7. Point of zero charge (pH zpc)
The pHzpc is an important characteristic of any activated carbon as it indicates the acidity/basicity of the adsorbent and the net surface charge of the carbon in solution. To measure the pHzpc, 0.1 mg of activated carbon was added to 100 mL of solution of 0.01 mol⋅L−1 NaCl with pH varying from 2 to 12 and stirred for 6 h. The final pH was measured and plotted against the initial pH. The pHzpC was determined at the value for which pHfinal = pHinitial.
2.3.8. 1H-NMR spectroscopy and GC–MS
1H-NMR spectroscopy was recorded on 600 MHz Bruker spectrospin instruments. The oil samples were diluted using CDCl3. The GC–MS analysis of bio-oil was carried out using a Thermo Scientific ISQ Single Quadrupole. The temperature program adopted is as follows: initial and final temperatures were 60 and 300 °C, respectively; the total time was 20 min at a heating rate of 10 °C⋅min−1. The injector and detector temperatures were 250 °C and 300 °C, respectively. The gas sample was injected by a Hamilton syringe of 50 mg/mL.
3. Results and discussion
3.1. Physicochemical characterization of date stone
3.1.1. Ultimate and proximate analyses
Table 1 presents the proximate and ultimate characterization of the date stone and its empirical structure. The results obtained show that the date stone has high volatile matter content and a low amount of ash, moisture, and fixed carbon as compared to the results in the literature [14, 15].
Proximate and ultimate analyses and chemical groups on the surface of date stone
| Characteristics | Percentage | |
|---|---|---|
| Proximate analysis (wt%) | Moisture content | 6.59 |
| Volatile matter | 73.46 | |
| Ash | 2.24 | |
| Fixed carbon | 24.3 | |
| Ultimate analysis (wt%) | Carbon | 46.9 |
| Hydrogen | 6.41 | |
| Nitrogen | 0.45 | |
| Sulfur | 0.19 | |
| Oxygen | 43.81 | |
| H/C molar ratio | 1.64 | |
| O/C molar ratio | 0.70 | |
| Empirical formula | CH1.640O0.700N0.008 | |
| Higher heating value (MJ⋅kg−1) | 18.77 | |
| pHpzc | 6.13 | |
| Carboxylic groups (meq/g) | 0.465 | |
| Lactonic groups (meq/g) | 0.538 | |
| Phenolic groups (meq/g) | 0.535 | |
| Acidic groups (meq/g) | 1.538 | |
| Basic groups (meq/g) | 0.282 | |
The percentages of carbon, hydrogen, nitrogen, sulfur, and oxygen present in the date stone are determined by elemental analysis. The analysis shows that the tested samples are rich in carbon, hydrogen, and oxygen contents (43.81%, 6.41%, and 46.9%, respectively). On the contrary, the relative contents of nitrogen and sulfur are low (0.15% and 0.19%, respectively). The high carbon and oxygen contents give the material a high calorific value. This value showed that the biomass could be considered suitable for pyrolysis, gasification, or combustion processes. Moreover, the knowledge of ratios of H/C and O/C is important for thermochemical conversion processes. In most cases, biomasses have higher O/C and H/C ratios than those of fossil fuels. The high values of the atomic H/C ratio (1.64) in date stone agree with the high volatile content found by proximate analysis (73.46%). The values obtained for these parameters are relatively similar to those reported for date stone in the literature [14, 16]. The HHV was 18.7 KJ⋅kg−1. These values are of the same order of magnitude as the results obtained for sawdust, olive solid waste, oil palm fruit bunches, wood pellets, and wood chips. A comparison with the data from the literature for wood biomass and energetic crops shows that the investigated biomass has a typical composition [17, 18] with a significant HHV value.
3.1.2. Infrared spectroscopy
The raw date stone was also characterized by FTIR in the middle region (Figure 1), including the wavenumbers between 4000 and 400 cm−1. The aim of the analysis was to identify the functional groups of the raw material and then compare any structural changes after the pyrolysis experiments. The bands in the spectra of raw date stone indicate that it is mainly composed of lignin, cellulose, and hemicelluloses [19, 20, 21]. The band at 3335 cm−1 is caused by the OH- group of lignin in the date stone. The absorption peak at wavenumber 1736 cm−1 is characteristic of hemicellulose. The absorption peaks at approximately 3362, 2900, 1365, and 1143 cm−1 are characteristic of cellulose. Generally, similar absorption peaks are observed in the spectrum of lignin. The absorption peaks at 2900, 1600–1500, 1416, 1314, and 830 −−750 cm−1 are attributed to lignin [22, 23]. The characteristic absorption peaks of raw date stone prove the presence of lignin, cellulose, and hemicelluloses.
FTIR spectra of date stone and its bio-oil and bio-char obtained at 500 °C, 10 °C∕min, and 1.5 mm.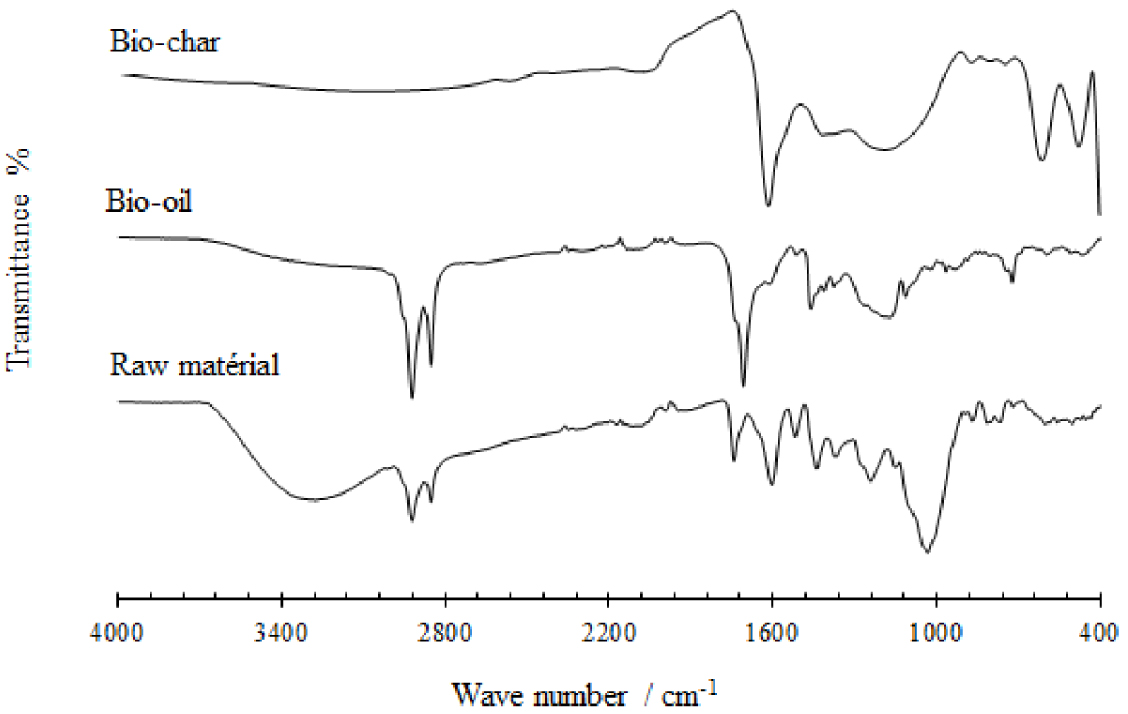
Process factors and their levels
| Factors | Unidimensional variables | Levels of factors | ||
|---|---|---|---|---|
| − 1 | 0 | 1 | ||
| Pyrolysis temperature (°C) | A | 400 | 500 | 600 |
| Heating rate (°C∕min) | B | 10 | 30 | 50 |
| Particle size (mm) | C | 0.5 | 1.0 | 1.5 |
3.1.3. Boehm titration
The functional groups of date stone were estimated by the Boehm titration (Table 1). The results show that the date stone mainly contains more acidic groups than basic groups. This indicates that the date stone has an acidic character. Thus, the high content of oxygenated groups is due to the presence of a large quantity of phenolic, lactonic, and carboxylic groups. Therefore, these results are in agreement with the (pHZPC value of 6.29, which indicates the acidity of the date stone.
3.2. Study of the influence of factors on pyrolysis product yields
3.2.1. Response surface methodology
Pyrolysis experiments were conducted to aid in the design of response surface methodology based on the BBD. Box and Wilson introduced this method in 1951, which is a regression method for exploring the correlation between some explanatory factors and one or more responses. The BBD consists of three factors, the pyrolysis temperature (A), heating rate (B), and particle size (C), as the independent variables. Thus, the pyrolysis product yields consisting of the solid product (bio-char), the liquid product (bio-oil), and the gaseous product (gas) are the dependent variables. All the responses are listed in Table 2. These variables with their respective domain are chosen based on the data from the literature and preliminary experiments [24, 25, 26, 27, 28]. The experiments were conducted according to the BBD at three levels, − 1, 0, and + 1, for 16 experiments. The number of experiments was calculated by using (1):
| (1) |
Experimental design matrix and dependent variables attributed to the factors of Box–Behnken design
| Exp. | Coded level | Actual level | Experimental responses | ||||||
|---|---|---|---|---|---|---|---|---|---|
| A | B | C | Pyrolysis temperature (°C) | Heating rate (°C∕min) | Particle size (mm) | Y1 (%) | Y2 (%) | Y3 (%) | |
| 1 | − 1 | − 1 | 0 | 400 | 10 | 1.0 | 44.12 | 09.26 | 46.62 |
| 2 | 1 | − 1 | 0 | 600 | 10 | 1.0 | 31.76 | 15.16 | 53.08 |
| 3 | − 1 | 1 | 0 | 400 | 50 | 1.0 | 42.69 | 10.75 | 46.56 |
| 4 | 1 | 1 | 0 | 600 | 50 | 1.0 | 30.48 | 15.79 | 53.73 |
| 5 | − 1 | 0 | − 1 | 400 | 30 | 0.5 | 43.22 | 10.06 | 46.72 |
| 6 | 1 | 0 | − 1 | 600 | 30 | 0.5 | 30.02 | 14.96 | 55.02 |
| 7 | − 1 | 0 | 1 | 400 | 30 | 1.5 | 43.06 | 10.32 | 46.62 |
| 8 | 1 | 0 | 1 | 600 | 30 | 1.5 | 30.92 | 15.16 | 53.92 |
| 9 | 0 | − 1 | − 1 | 500 | 10 | 0.5 | 36.76 | 15.05 | 48.19 |
| 10 | 0 | 1 | − 1 | 500 | 50 | 0.5 | 36.60 | 16.10 | 47.30 |
| 11 | 0 | − 1 | 1 | 500 | 10 | 1.5 | 37.55 | 15.26 | 47.19 |
| 12 | 0 | 1 | 1 | 500 | 50 | 1.5 | 36.46 | 16.26 | 47.28 |
| 13 | 0 | 0 | 0 | 500 | 30 | 1.0 | 37.13 | 15.05 | 47.82 |
| 14 | 0 | 0 | 0 | 500 | 30 | 1.0 | 37.19 | 15.10 | 47.71 |
| 15 | 0 | 0 | 0 | 500 | 30 | 1.0 | 37.12 | 15.05 | 47.83 |
| 16 | 0 | 0 | 0 | 500 | 30 | 1.0 | 37.10 | 15.08 | 47.82 |
The mathematical model associated with this design is generally a quadratic equation or second-order model. The model can be written as in (2) (Xi are the unidimensional variables corresponding to the above described A, B, and C variables):
| (2) |
| (3) |
| (4) |
| (5) |
3.2.2. Experimental results
Table 3 lists the coded and actual values of the three important factors together with the response values and the observed results for the three responses: bio-char, bio-oil, and bio-gas yields.
From these results, it appears that for the bio-char and bio-oil yield responses, the pyrolysis temperature and the heating rate have a strong impact on the development of response during the pyrolysis step. Therefore, a yield of bio-oil from the date stone varies between 9.26% and 16.26%, which represents a high value at a carbonization temperature of 600 °C, a heating rate of 50 °C∕min, and a particle size of 1.5 mm. Therefore, these date stones have a medium bio-oil yield. Moreover, it could be noted that the maximum value of bio-char is approximately 44.12%. It is obtained for date stone pyrolysis at 400 °C, a heating rate of 10 °C⋅min−1, and a grain size of 1 mm. Finally, the yield of pyrolysis gases released during the thermal decomposition of date stone reaches a maximum of 55.02%, and it is obtained at 600 °C, 30 °C, and 0.5 mm for pyrolysis temperature, heating rate, and particle size, respectively.
In addition, a regression analysis was performed to fit the response functions with the experimental data. The effect values of regression coefficients are shown in Table 4.
Analysis of variance of bio-char yield (Y1), bio-oil yield (Y2), and bio-gas yield (Y3)
| Source | Main coefficients | Sum of squares | df | Mean squares | F-value | p-value Prob > F | ||
|---|---|---|---|---|---|---|---|---|
| Y1 | Model | 37.135 | 315.171019 | 9 | 35.019002 | 1059.32462 | 3.977 × 10⁻¹⁰ | Significant |
| A | −6.364 | 311.0018 | 1 | 311.0018 | 9407.80277 | 3.2626 × 10⁻¹² | ||
| B | −0.557 | 2.5200125 | 1 | 2.5200125 | 76.2303645 | 5.1942 × 10⁻⁵ | ||
| C | 0.111 | 0.4465125 | 1 | 0.4465125 | 13.5070007 | 0.00790982 | ||
| AB | −0.213 | 0.0036 | 1 | 0.0036 | 0.10889998 | 0.75105599 | ||
| AC | 0.265 | 0.2809 | 1 | 0.2809 | 8.49722348 | 0.27561155 | ||
| A2 | 0.108 | 0.04620026 | 1 | 0.0462002 | 1.39755771 | 0.27572917 | ||
| B2 | 0.207 | 0.00125289 | 1 | 0.0012528 | 0.03790006 | 0.85117362 | ||
| C2 | −0.438 | 0.84412658 | 1 | 0.8441265 | 25.5348245 | 0.00147453 | ||
| Residual | 0.231405 | 7 | 0.0330578 | |||||
| Cor. total | 315.402424 | 16 | ||||||
| Model | 15.07 | 86.4954668 | 9 | 9.61060742 | 366.128341 | 1.6244 × 10⁻⁸ | Significant | |
| A | 2.585 | 53.4578 | 1 | 53.4578 | 2036.54304 | 6.8551 × 10⁻¹⁰ | ||
| B | 0.521 | 2.1736125 | 1 | 2.1736125 | 82.806539 | 3.9702 × 10⁻⁵ | ||
| C | 0.104 | 0.0861125 | 1 | 0.0861125 | 3.28056546 | 0.11301055 | ||
| Y2 | AB | −0.215 | 0.1849 | 1 | 0.1849 | 7.0440012 | 0.03274845 | |
| AC | 0.015 | 0.0009 | 1 | 0.0009 | 0.03428665 | 0.85834927 | ||
| A2 | −2.686 | 30.3376761 | 1 | 30.3376761 | 1155.75244 | 4.9384 × 10⁻⁹ | ||
| B2 | 0.356 | 0.54039184 | 1 | 0.54039184 | 20.5869161 | 0.00267636 | ||
| C2 | 0.243 | 0.24913921 | 1 | 0.24913921 | 9.49127581 | 0.01779559 | ||
| Residual | 0.183745 | 7 | 0.02624929 | |||||
| Cor. total | 86.6792118 | 16 | ||||||
| Model | 47.79 | 136.943931 | 9 | 15.2159924 | 175.113559 | 2.1161 × 10⁻⁷ | Significant | |
| A | 3.65 | 106.799113 | 1 | 106.799113 | 1229.09977 | 3.9861 × 10⁻⁹ | ||
| B | 0.036 | 0.0105125 | 1 | 0.0105125 | 0.12098332 | 0.73819512 | ||
| C | −0.34 | 0.9248 | 1 | 0.9248 | 10.6430797 | 0.01381903 | ||
| AB | 0.177 | 0.126025 | 1 | 0.126025 | 1.45036129 | 0.26760568 | ||
| AC | −0.25 | 0.25 | 1 | 0.25 | 2.8771301 | 0.13366307 | ||
| A2 | 2.58 | 28.0976024 | 1 | 28.0976024 | 323.36183 | 4.0637 × 10⁻⁷ | ||
| B2 | −0.37 | 0.58188658 | 1 | 0.58188658 | 6.69665357 | 0.03606072 | ||
| Y3 | C2 | 0.196 | 0.16968658 | 1 | 0.16968658 | 1.95284146 | 0.20497622 | |
| Residual | 0.608245 | 7 | 0.08689214 | |||||
| Cor. total | 137.552176 | 16 | ||||||
According to this table, the pyrolysis temperature presents a negative effect on the bio-char yield and a positive effect on other responses. In contrast, the heating rate has a positive effect on bio-oil and bio-gas yields and has a negative effect on the bio-char yield. Furthermore, the particle size has a positive impact on the yields of bio-oil and bio-char and a negative effect on the yield of bio-gas. Besides, an analysis of interaction effects indicates greater interaction between the pyrolysis temperature and the particle size with a positive effect on the bio-char yield. Moreover, for the yields of bio-gas and bio-oil, the most important interaction is the quadratic combination of pyrolysis temperatures.
3.2.3. Analysis of variance
To determine the main and significant interaction effects in the responses, the analysis of variance (ANOVA) was used at a confidence level of 95%. After removing the insignificant terms, the ANOVA data for the three responses are presented in Table 4.
According to the ANOVA analysis, the significant effects are the pyrolysis temperature (A), heating rate (B), particle size (C), interactions AB and AC, and quadratic interactions A2, B2, and C2 (Equations (6)–(8); Table 4):
| (6) |
| (7) |
| (8) |
Furthermore, the pyrolysis temperature (A), heating rate (B), and particle size (C) and AB, B2, and C2 interaction terms have significant effects on the responses, implying that the increase in these terms enhances the bio-oil yield. In contrast, the interactions AC and A2 have a negative effect on the response of the bio-oil yield.
Moreover, the particle size and the interaction between the pyrolysis temperature and the particle size had a negative effect on the gaseous product yield. Besides, an increase in the yield of noncondensable gases occurred for A and B and interactions AB, A2, and C2. As a result, the yield of the gaseous product increased at higher pyrolysis temperatures.
3.2.4. Response surface analysis
In this step, the response surface methodology and the optimal conditions of this process were determined on the basis of mathematical models for the yield of pyrolysis products. Figure 2 shows the three-dimensional response surface plots for the significant interactions. For the yields of bio-char, bio-oil, and bio-gas, the most significant interactions were the pyrolysis temperature/heating rate and pyrolysis temperature/particle size.
Surface response plots for bio-char yield (A, B), bio-oil yield (C, D), and bio-gas yield (E, F).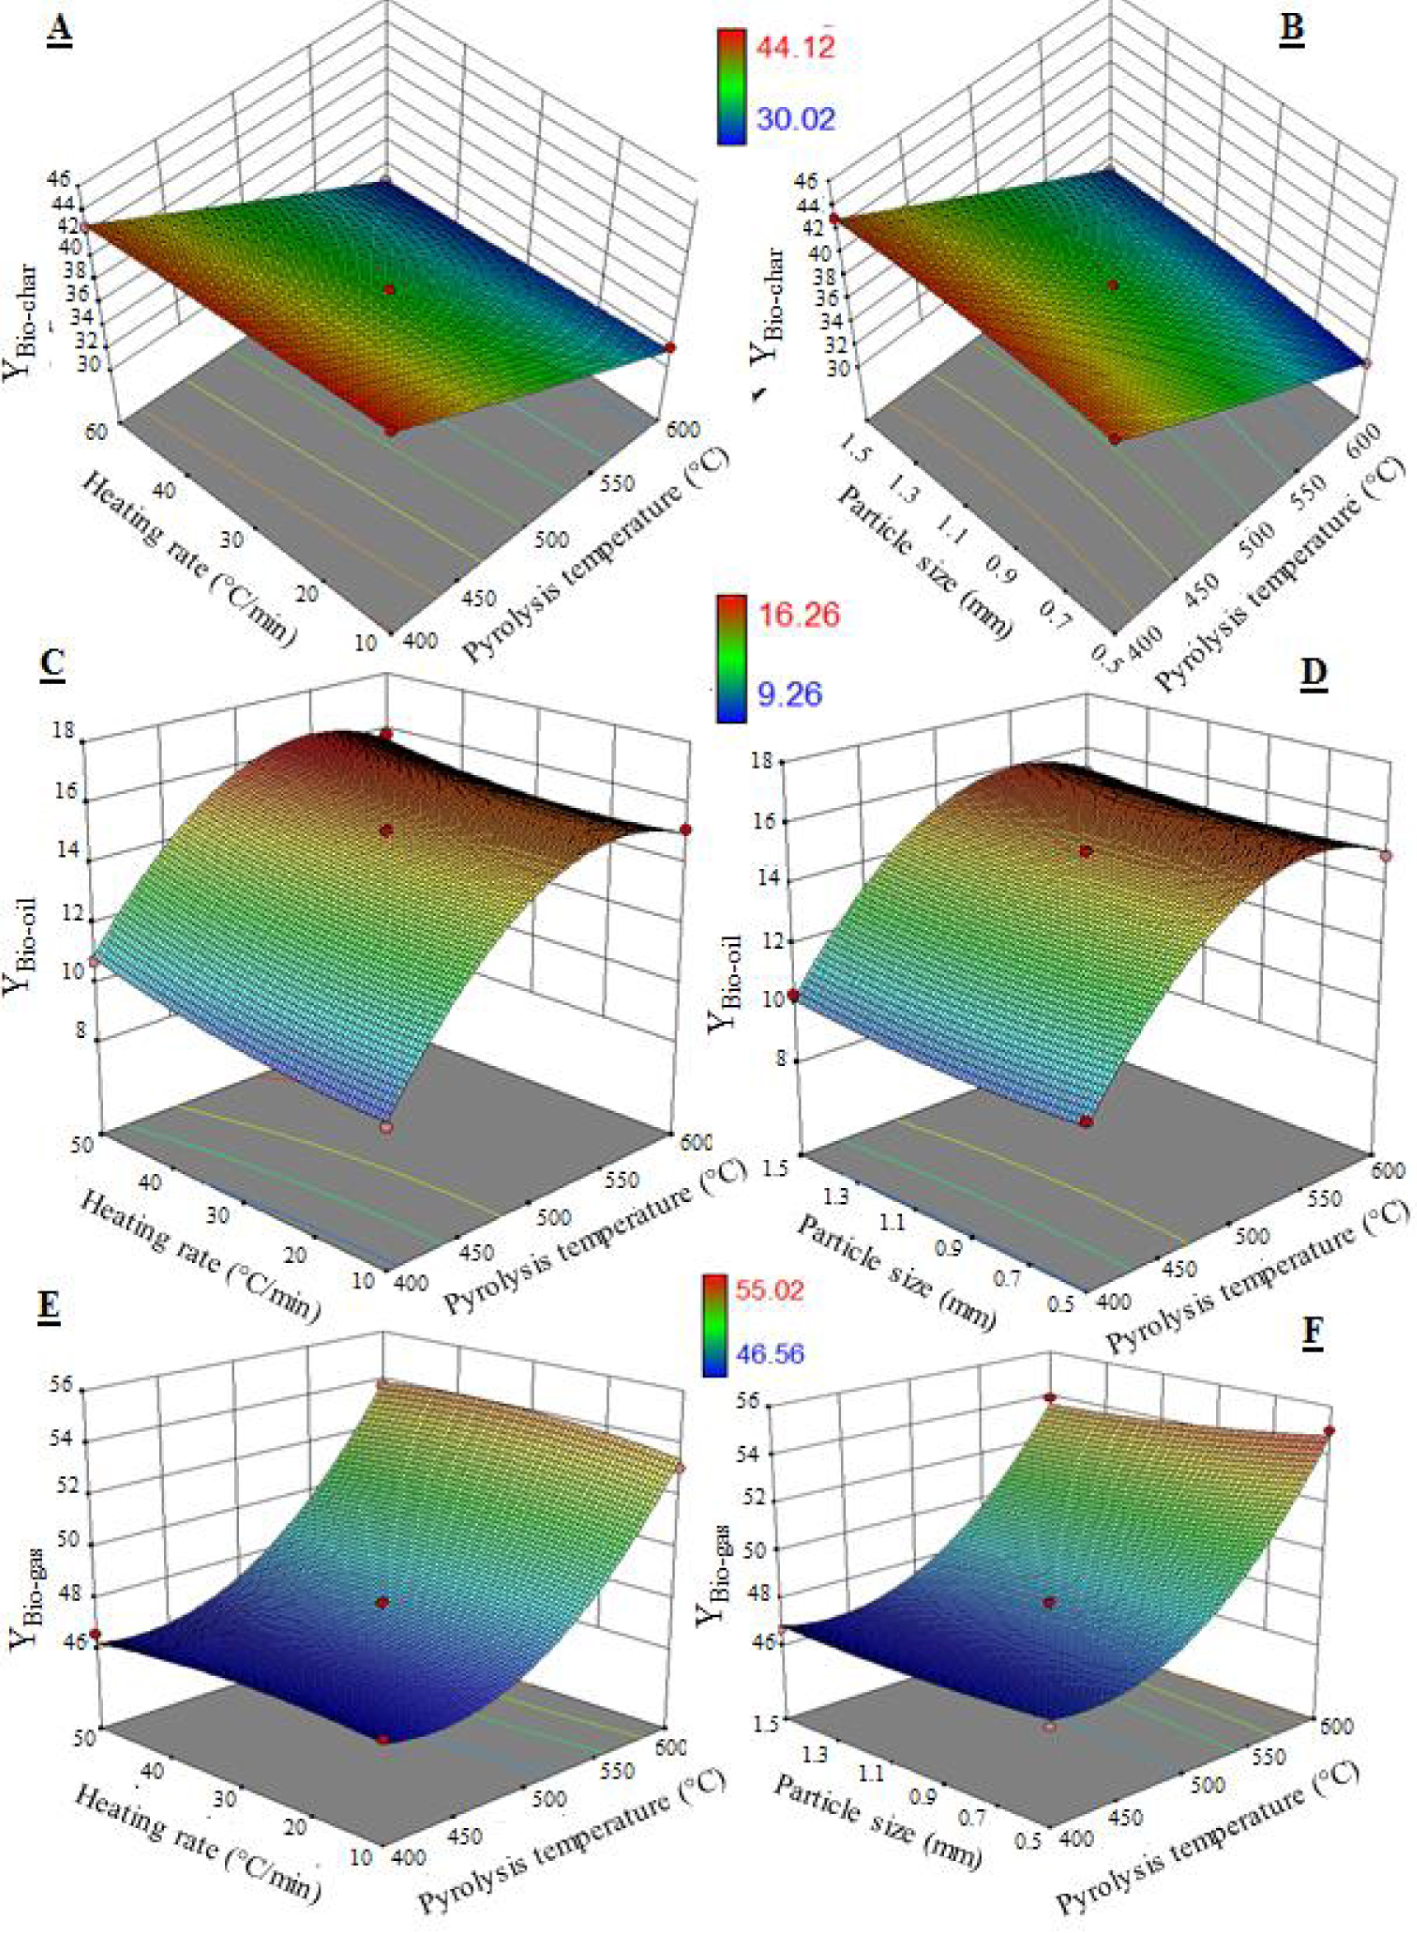
For the bio-char yield, it can be seen from Figure 2A that the surface area increases with decrease in pyrolysis temperature and increase in heating rate for a constant particle size (1 mm). The maximum bio-char yield is obtained at regardless of heating rate. Moreover, Figure 2B shows that the yield increases at low pyrolysis temperatures regardless of particle size. The maximum bio-char yield is obtained at a pyrolysis temperature of 400 °C, a heating rate of 50 °C⋅min−1, and a particle size of 1 mm.
It can be seen from Figure 2C that the bio-oil yield increases with increase in pyrolysis temperature and decrease in heating rate when the particle size is 1 mm. A maximum yield is observed at a pyrolysis temperature of 500 °C at a heating rate of 10 °C⋅min−1. However, Figure 2D shows that the bio-oil yield increases regardless of particle size. Then, a maximum value appears at pyrolysis temperature, heating rate, and particle size values of 500 °C, 10 °C⋅min−1, and 1.5 mm, respectively.
On the other hand, Figures 2E and F show that the efficiency of noncondensable gases increases with increase in pyrolysis temperature. A high gas efficiency value is obtained at the pyrolysis temperature of 600 °C regardless of heating rate and particle size, indicating that the gas efficiency is necessarily dependent on the pyrolysis temperature.
3.2.5. Diagnostic model
The graphs of the normal probability of residues are shown in Figures 3A–C. We can see from the figure that the data points for the performance of pyrolysis products (bio-char, bio-oil, and bio-gas) are close to the straight line, which shows that the experiments are at the origin of a normally distributed population.
Normal probability plots of residuals for three responses: (A) bio-char yield, (B) bio-oil yield, and (C) bio-gas yield.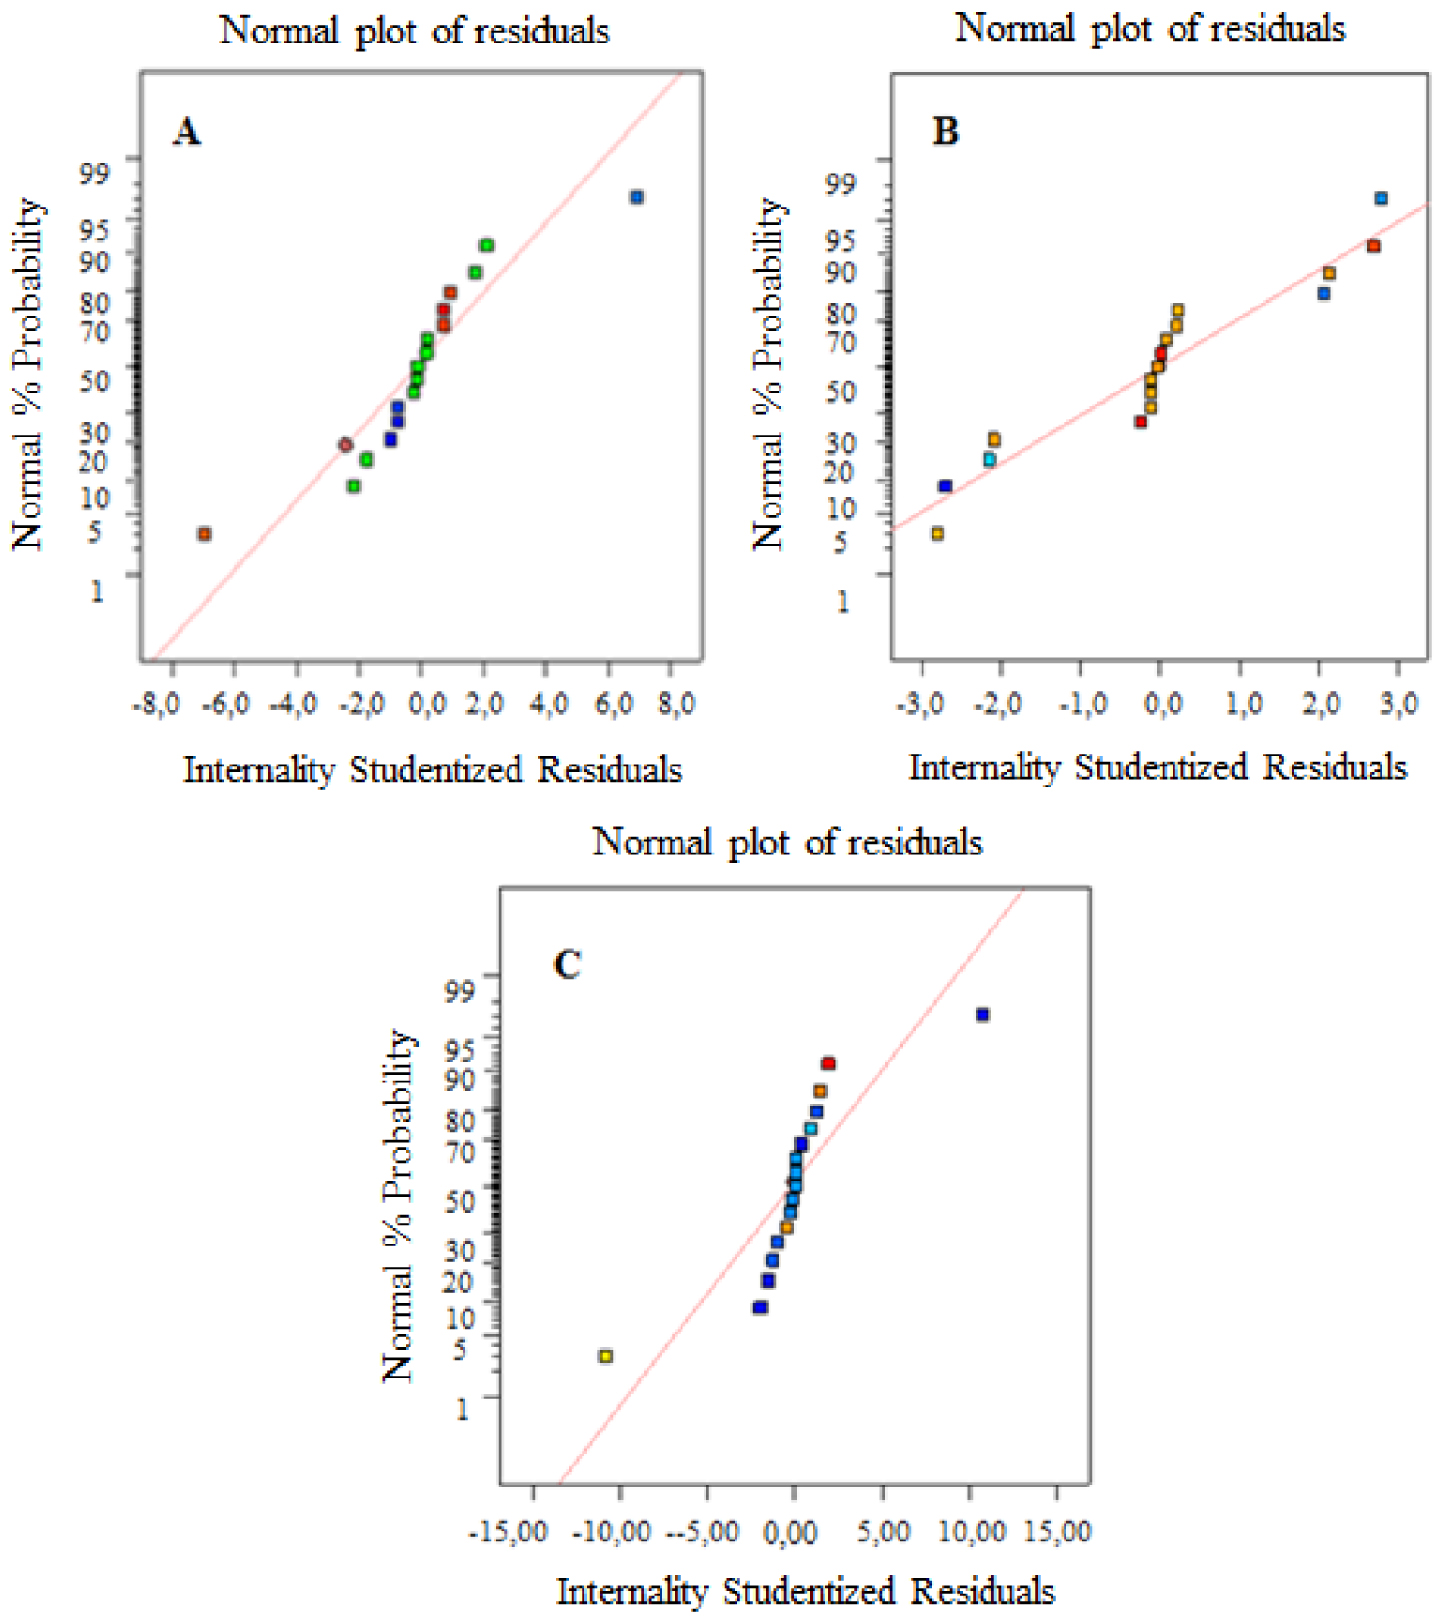
3.2.6. Optimal values and discussion
The desirability function was used for optimizing the three responses studied, including bio-char, bio-oil, and bio-gas yields. The maximum value of the desirability function was obtained at a pyrolysis temperature of 500 °C, a heating rate of 10 °C⋅min−1, and a particle size of 1.5 mm. Under these conditions, the predicted responses for bio-char, bio-oil, and bio-gas yields were 36.64 ± 2.03%, 16.12 ± 0.98%, and 47.24 ± 3.21%, respectively.
All the obtained results can be analyzed as follows. At temperatures below 500 °C, the lowest yields are attributed to the incomplete conversion of organic compounds. At temperatures above 500 °C, the decrease in the bio-oil yield may be due to the secondary cracking of pyrolysis vapors at higher temperatures. At intermediate temperatures, there is a compromise between secondary reactions and the final temperature, which leads to an optimal bio-oil yield. The optimal yields of bio-oil and bio-char were obtained at 500 °C.
The heating rate also plays a significant role in the destruction and reforming of bio-char and bio-oil.
It is well known from a survey of the literature and previous studies that the heating rate plays an important role in product distribution [30, 31, 32, 33]. In this work, faster heating rates maximized the yield of bio-oil, while low heating rates favored the formation of bio-char [30, 34, 35, 36]. However, at low heating rates, secondary cracking remained low and the flow of locally produced gases was insufficient to break the organic molecules outside the grain of the date stone. On the other hand, it can be explained that bio-oil yields increased with increase in organic and specific products and secondary cracking of volatiles at higher heating rates. At a heating rate of 10 °C⋅min−1, we obtained a good compromise among the effects of the above-mentioned parameters. Furthermore, we obtained optimal bio-oil and bio-char yields.
Comparison of physicochemical characteristics of date stone bio-char and bio-oil obtained at 500 °C, 10 °C∕min, and 1.5 mm with other biomasses’ bio-char and bio-oil
| Properties | Grape bagasse [37] | Residual chañar [38] | Eastern giant fennel [39] | Date stone [this work] | ||||
|---|---|---|---|---|---|---|---|---|
| Bio-oil | Bio-char | Bio-oil | Bio-char | Bio-oil | Bio-char | Bio-oil | Bio-char | |
| Carbon | 71.72 | 72.09 | 56.7 | 35.5 | 53.96 | 63.92 | 67.38 | 69.63 |
| Hydrogen | 8.69 | 3.05 | 7.1 | 7.8 | 7.41 | 3.268 | 7.24 | 3.54 |
| Nitrogen | 2.69 | 1.4 | 0.2 | <0.1 | 1.227 | 0.949 | 0.304 | 0.421 |
| Oxygen | 16.90 | 23.46 | 35.9 | 56.6 | 37.403 | 31.86 | 22.65 | 23.89 |
| Empirical formula | CH1.45O0.17 N0.03 | CH0.51O0.24N0.02 | CH1.5O0.46N0.003 | CH2.63O0.47 | CH1.65O0.52N0.02 | CH0.61O0.37N0.013 | CH1.289O0.252N0.004 | CH0.61O0.258N0.005 |
| H/C molar ratio | 1.45 | 0.51 | 0.46 | 2.63 | 1.647 | 0.61 | 1.289 | 0.610 |
| O/C molar ratio | 0.17 | 0.24 | 0.46 | 0.47 | 0.52 | 0.37 | 0.252 | 0.258 |
| HHV (MJ/kg) | 32.95 | 28.40 | 23.0 | 13.1 | 22.20 | 20.59 | 25.1 | 23.25 |
The particle size of the date stone has a slight influence on the yield of the pyrolysis product, making it a parameter that controls the drying rate and primary pyrolysis and the extent to which these processes overlap during thermal decomposition. The effect of particle size is explained in terms of the heating rate at which bigger particles heat up more slowly resulting in a lower temperature for average particles, which leads to less amounts of volatile yields. Uniform heating could be established with sufficiently small particle size samples. The results of our study show that 1.5 mm particle size samples are the most suitable for obtaining optimal yields from the pyrolysis of date stone.
3.3. Physical and chemical characterization of the pyrolysis product
In this step, only bio-oil and bio-char that were obtained under the most suitable conditions, a temperature of 500 °C, a heating rate of 10 °C∕min, and a particle size of 1.5 mm, were retained for the next characterization.
The analytical methods we used to characterize the liquid fraction (bio-oil) and the solid fraction (bio-char) are as follows. For elemental analyses, SEM, FTIR, 1H-NMR spectroscopy, and GC–MS were carried out.
3.3.1. Bio-oil characterization
a. Physical property and elemental composition
Table 5 lists the results of elemental analysis of bio-oil produced by the pyrolysis of date stone at a temperature of 500 °C, a heating rate of 10 °C⋅min−1, and a particle size of 1.5 mm. We note that the values for carbon (67.38%) and hydrogen (7.420) contents and the HHV (25.10 MJ/kg) of bio-oil are higher than those of the raw date stone. Furthermore, the average chemical composition of the pyrolysis oil is CH1,289O0,252N0,004. The significant decrease in oxygen content of the oil (22.65%) compared to that of the original feedstock (43.81%) is important because the high oxygen content is not conducive to the production of transport fuels. The cause of this decrease is decarboxylation and dehydration reactions of molecules in the biomass.
Table 5 presents the characteristics of the pyrolysis oil derived from date stone in comparison with other biomass-derived oils [37, 38, 39]. It is evident that the HHV of date stone oil is favorable than that of other pyrolysis oils. Furthermore, the oil from the date seed may be considered as an important potential source of alternative fuel.
GC–MS spectrum of bio-oil obtained at 500 °C, 10 °C∕min, and 1.5 mm.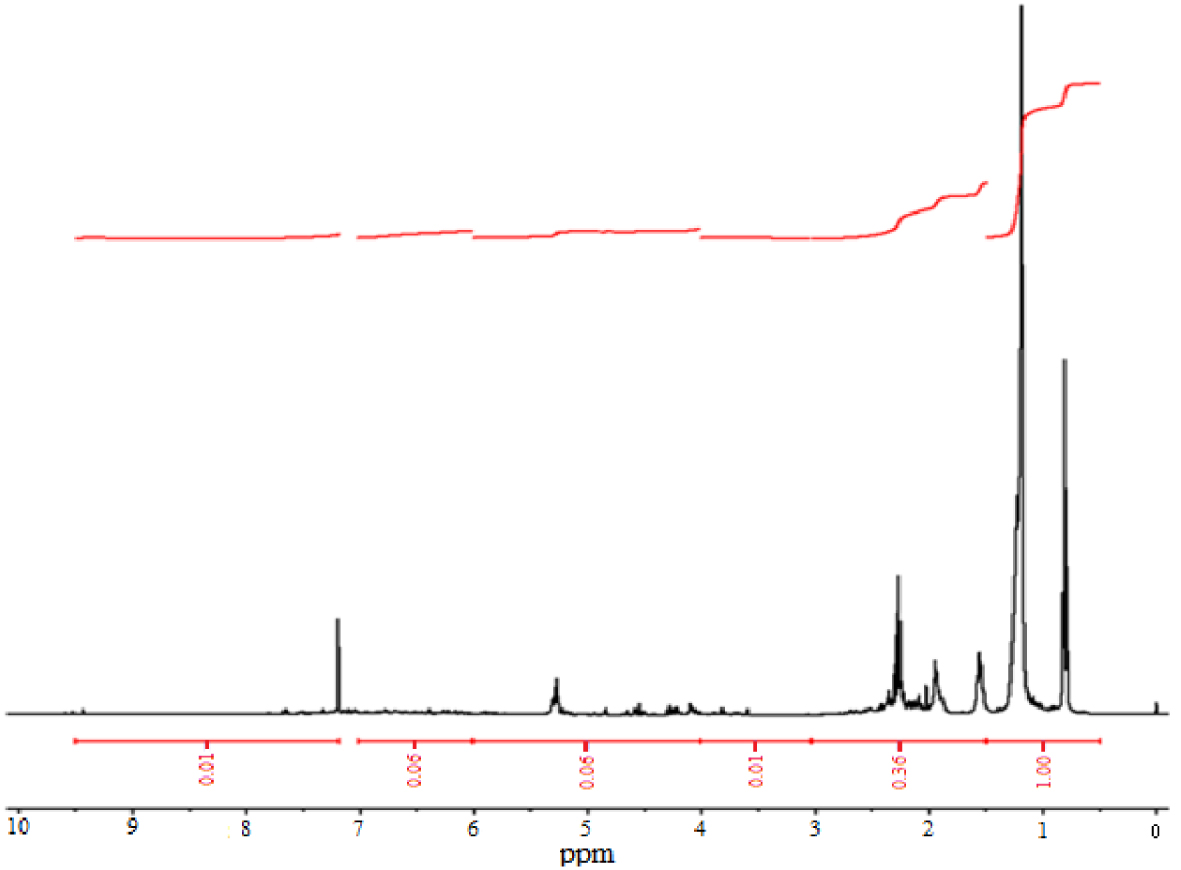
FTIR bands and functional groups of bio-oil obtained at 500 °C, 10 °C∕min, and 1.5 mm
| Peak (cm−1) | Bond | Attribution |
|---|---|---|
| 3200–3600 | O–H | Polymer O–H |
| 2850 and 2930 | C–H | Aliphatic stretching band |
| 1700 | C =O | Ketones, aldehydes, lactones, and carboxylic groups |
| 1600–1680 | C =C | Olefinic |
| 1200–1350 | C–H | Aromatic |
| 1000–1200 | C–O | Alcohol, ester, and ether |
| 3150 | N–H | Heteroatoms |
b. FTIR spectroscopy
We used FTIR to analyze the functional group composition of bio-oil (Figure 1 and Table 6). The FTIR spectra indicate the presence of O–H group stretching vibrations between wavenumbers 3200 and 3400 cm−1 and C–H deformation vibrations between 1350 and 1450 cm−1, which shows the existence of alkane groups. The C =O stretching vibrations between 1680 and 1750 cm−1 confirm the presence of ketones, quinones, and carboxylic acid or aldehyde groups. The wavenumbers 1645 −−1678 cm−1 show C =C stretching vibrations, which indicate the presence of alkenes. Besides, mono- and polycyclic and substituted aromatic groups can be identified by the absorption peaks between 690 and 900 cm−1 and 1350 and 1450 cm−1, respectively [40, 41].
All these absorption bands suggest the presence of a wide variety of chemical groups such as phenols, aromatics, alcohols, esters, ethers, carboxylic acids, aldehydes, and ketones. We explain that this heterogeneity arises from the thermal degradation of the constituents of the date stone during secondary pyrolysis reactions such as polymerization, polycondensation, and etherification or esterification.
c. 1H-NMR spectroscopy
To have a better understanding of the complete chemical composition of bio-oil, we performed an analysis using nuclear magnetic resonance (NMR) spectroscopy. We used the 1H-NMR spectrum (Figure 4) to obtain information about functional groups and quantify integration areas. On this spectrum, it is therefore also possible to distinguish the percentages of proton types, which can be calculated from the chemical deviation values (Table 7).
1H-NMR spectrum of bio-oil obtained at 500 °C, 10 °C∕min, and 1.5 mm.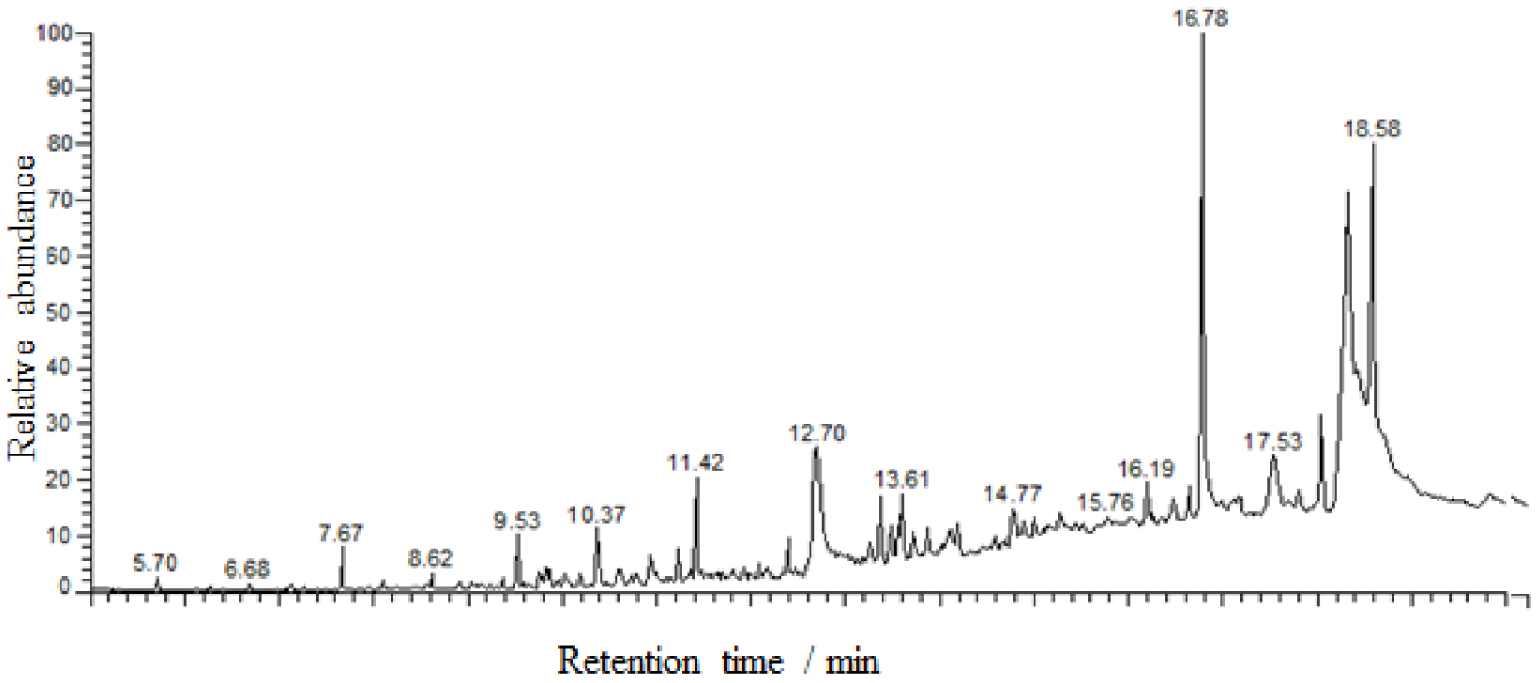
Chemical composition of bio-oil obtained at 500 °C, 10 °C∕min, and 1.5 mm from GC–MS
| Chemical shift (ppm) | Type of proton | Area (%) |
|---|---|---|
| 0.5–1.5 | ° CH3 𝛾 or farther from aromatic ring and paraffinic CH3 | 66.66 |
| ° CH3, CH2, and CH 𝛽 to aromatic ring | ||
| 1.5–3.0 | ° CH2 and CH attached to naphthenes | 24.00 |
| ° CH3, CH2, and CH 𝛼 to aromatic ring or acetylenic | ||
| 3.0–4.0 | ° Hydroxyls, ring-joining methylene, methine, or methoxy | 0.67 |
| 4.0–6.0 | ° Phenols, nonconjugated olefins | 4.00 |
| 6.0–9.5 | ° Aromatics, conjugated olefins | 4.67 |
The resonances of a proton between chemical shift 0.5 and 1.5 ppm correspond to the presence of 66.66% of aliphatic protons attached to paraffinic CH3. Peaks in the following region between 1.5 and 3.0 ppm are attributed to the proton of an aromatic ring or acetylenic (24.0%). The region 3.0–4.0 ppm is due to hydroxyls, ring-joining methylene, methine, or methoxy (0.67%). We observed phenols and nonconjugated olefins in the bio-oil, and they resonate in the range of 4.0–6.0 ppm (4%). Finally, a region between 6.0 and 9.5 corresponds to aromatic protons, aldehyde protons, and also protons in heteroaromatics containing oxygen and nitrogen. The content of this region was 4.67%.
A higher number of aliphatic protons (90%) from date stone are due to the destruction of side chains of date stone compounds in pyrolysis processes. As a result, the bio-oil produced from the date stone can be used as a bio-fuel.
d. Gas chromatography–mass spectrometry
The GC–MS spectrum of bio-oil produced by the pyrolysis of date stone at a temperature of 500 °C, a heating rate of 10 °C⋅min−1, and a particle size of 1.5 mm is given in Figure 5. As we can see, the bio-oil produced consists of a complex mixture of hundreds of compounds. However, the identification of the main peaks has been made in the first 40 peaks in terms of relative areas. For these identifications, structural formula, chemical name, and GC peak areas of compounds with more than 0.4% of the total area identified in this fraction are listed in Table 8. The volatile fraction of bio-oil is mainly composed of heavy compounds, in particular, fatty acids and their derivatives. They represent almost half of the total area of the detected peaks. Among these compounds are long-chain amides and fatty acid esters. These derivatives of fatty acids are obtained by the hydrolysis of the lipids present in the date stone. Fatty acids are released by the hydrolysis of triglycerides. The fatty acids then react with alcohols by esterification or with amino acids to form amides [42, 43].
1H-NMR analysis results of bio-oil obtained at 500 °C, 10°C∕min, and 1.5 mm
| No. | Retention time (min) | Compounds | Molecular formula | Surface (%) |
|---|---|---|---|---|
| 1 | 7.67 | Nonane, 2-methyl-5-propyl | C13H28 | 0.90 |
| 2 | 8.62 | Tetradecane | C14H30 | 0.51 |
| 3 | 9.53 | Hexadecane | C16H34 | 1.17 |
| 4 | 9.82 | Benzyl nonyl maleate | C20H28O4 | 1.69 |
| 5 | 10.03 | 2-Cyclopenten-1-one, 3-methyl | C6H8O | 0.40 |
| 6 | 10.37 | 2-Furancarboxaldehyde, 5-methyl | C6H6O2 | 1.81 |
| 7 | 10.60 | Carbonic acid, ethyl octadecyl ester | C21H42O3 | 0.88 |
| 8 | 10.78 | N,N’-bis(carbobenzyloxy)-lysine methyl(ester) | C23H28N2O6 | 0.75 |
| 9 | 10.93 | 3-Furanmethanol | C5H6O2 | 1.10 |
| 10 | 11.22 | Eicosane | C20H24 | 0.80 |
| 11 | 11.42 | 8-Heptadecene | C17H34 | 3.28 |
| 12 | 11.81 | (Z)6-Pentadecen-1-ol | C15H30O | 0.86 |
| 13 | 12.39 | 1,2-Cyclopentanedione, 3-methyl | C6H8O2 | 1.38 |
| 14 | 12.70 | n-Hexadecanoic acid | C16H32O2 | 8.28 |
| 15 | 13.08 | 5,8,11-Heptadecatriynoic acid, methyl ester | C18H24O2 | 0.57 |
| 16 | 13.38 | Decanoic acid, 2-propenyl ester | C13H24O2 | 1.71 |
| 17 | 13.48 | 5-Methylcytidine | C10H15N3O5 | 1.10 |
| 18 | 13.61 | Phosphonic acid, (p-hydroxyphenyl)- | C6H7O4P | 2.69 |
| 19 | 13.86 | Oxiraneoctanoic acid, 3-octyl-, cis | C18H34O3 | 0.82 |
| 20 | 14.19 | Phenol, 4-methyl | C7H8O | 3.16 |
| 21 | 14.77 | 5,8-Decadien-2-one, 5,9-dimethyl-, (E)- | C12H20O | 1.31 |
| 22 | 15.01 | Pentadecanoic acid, 13-methyl-, methyl ester | C17H34O2 | 0.51 |
| 23 | 15.14 | Heptaethylene glycol monododecyl ether | C26H54O8 | 0.42 |
| 24 | 15.28 | n-Decanoic acid | C10H20O2 | 0.60 |
| 25 | 15.51 | Heptaethylene glycol monododecyl ether | C26H54O8 | 0.57 |
| 26 | 15.76 | Heptaethylene glycol monododecyl ether | C26H54O8 | 1.04 |
| 27 | 16.19 | Octadecanoic acid, 2-propenyl ester | C21H40O2 | 1.13 |
| 28 | 16.46 | Cyclododecanol, 1-aminomethyl | C13H27NO | 1.02 |
| 29 | 16.64 | Methyl 11-octadecenoate | C19H36O2 | 1.04 |
| 30 | 16.78 | Dodecanoic acid | C12H24O2 | 14.55 |
| 31 | 17.16 | 2-Furancarboxaldehyde, 5-(hydroxymethyl)- | C6H6O3 | 1.31 |
| 32 | 17.53 | Octadecanoic acid | C18H36O2 | 3.47 |
| 33 | 17.81 | Octadecanoic acid, 2-propenyl ester | C21H40O2 | 0.54 |
| 34 | 18.04 | cis-Vaccenic acid | C18H34O2 | 3.11 |
| 35 | 18.31 | cis-13-Octadecenoic acid | C18H34O2 | 15.37 |
| 36 | 18.43 | cis-13-Octadecenoic acid | C18H34O2 | 0.41 |
| 37 | 18.58 | Tetradecanoic acid | C14H28O2 | 11.72 |
| 38 | 18.76 | cis-13-Octadecenoic acid | C18H34O2 | 0.51 |
| 39 | 18.95 | cis-13-Octadecenoic acid | C18H34O2 | 0.42 |
| 40 | 19.83 | Ethyl 9,12-hexadecadienoate | C18H32O2 | 0.84 |
We also detected other molecules in small quantities such as phenolic derivatives. These compounds are obtained from lignin degradation. A significant diversity of nitrogen compounds is also found in bio-oil. The structures identified are long-chain amides and also aromatic molecules: pyridine derivatives, pyrazine, pyridinol, indole, and so on. We assumed these molecules to be derived from protein degradation.
As can be seen clearly, the results obtained by GC–MS are highly consistent with those obtained by infrared spectroscopy. This is because all classes of identified chemical compounds are similar to those obtained by infrared spectroscopy. Furthermore, we note that the vast majority of the compounds identified are rich in hydrogen (particularly aliphatic hydrocarbons) in accordance with the results of elemental analysis. In addition, the aliphatic hydrocarbons detected are mainly alkylated fatty acid esters, ethers, and alkenes with a large number of protons, which is consistent with the 1H-NMR analysis.
3.3.2. Bio-char characterization
a. Physical property and elemental composition
Table 5 presents the elemental composition and calorific value of bio-char obtained by the pyrolysis of date stone under optimized experimental conditions. The analysis findings show that the bio-char is rich in 69.63%, 3.54%, 0.21%, and 23.98% of carbon, hydrogen, nitrogen, and oxygen contents, respectively.
The obtained results show that the bio-char of date stone has a high carbon content and low oxygen and hydrogen contents in comparison to its raw material. The decrease in H and O contents and increase in C content are due to dehydration, decarbonylation, and decarboxylation reactions of biomass. It appears that the pHPZC value of bio-char is neutral.
These results show that the bio-char obtained has interesting physical and chemical properties, which make it suitable for soil remediation. Moreover, with some functionalization, bio-char can be converted into functional materials, finding applications in catalysis, energy storage and conversion, and environmental protection. Bio-char production and applications for soil remediation and pollutant removal have been discussed and reviewed extensively [44, 45, 46]. Bio-char is also used in metallurgy and as a feedstock for the production of activated carbon, which has many uses. For example, it is used as an adsorbent to remove odorants from airstreams and both organic and inorganic contaminants from wastewater streams.
The properties of the bio-char from date stone were evaluated by comparison with other biomass samples reported in the literature (Table 5) [37, 38, 39]. The date stone stood out among the other biomass samples when the published HHV values were compared as it had an HHV value higher than 23 MJ/kg. The bio-char has an HHV comparable to that of biomass samples because of its lower proportion of H and O than C. This considerably increases the energy value of the fuel as more energy is present in C–C bonds than in C–O and C–H bonds.
b. Characterization of surface functional groups
The functionality of bio-char is evaluated by characterization with Boehm titration and FTIR methods. The Boehm titration method is applied to determine the acidic and basic sites in the bio-char. The results show that the bio-char produced at 500 °C, 10 °C∕min, and 1.5 mm has 1.423 meq⋅g−1 of acidic groups and 0.334 meq⋅g−1 of basic groups. These results indicated that the bio-char obtained has an acidic character.
These results are confirmed by infrared spectroscopy. As can be seen from the FTIR spectra of bio-char (Figure 1), remarkable changes are present compared to that of the raw material, which indicates an effective conversion of date stone under optimal pyrolysis conditions. The hydroxyl group band O–H at 3100 −−3600 cm−1 in the FTIR spectra of the bio-char sharply decreases after pyrolysis, probably due to the dehydration of the date stone with the release of an amount of water. The bands observed at 2860 −−2970 cm−1, which can be attributed to C–H alkyl functional groups, are almost absent in the bio-char. The bands occurring on the spectrum at 875 cm−1 and 1400 cm−1 are attributed to the vibrations of the C =C and C =O bonds in the aromatic rings. The high intensity of the C =O band in the bio-char and the decrease in carboxylic groups, as previously observed from Boehm titrations, suggest the presence of a higher amount of ketone compared to the raw material. A wide band at 900–1200 cm−1 shows the presence of aromatic functional groups C–O and phenolic groups O–H. Between 700 and 900 cm−1, another band is observed. This band is attributed to aromatic C–H stretching vibrations, which indicate the presence of an adjacent aromatic hydrogen in the bio-char [47].
c. Scanning electron microscopy
We observe the morphology of the bio-char obtained by SEM as shown in Figure 6. From this micrograph, it can be seen that the morphology of the bio-char shows the presence of empty spaces and greater porosity on its surface compared to that of the raw material. This confirms that the bio-char produced has a larger surface area than that of the raw date stone. We attribute this to the fact that the heat treatment improves the porous structure of the bio-char due to the loss of mass of some of the volatile matter from the date stone.
SEM micrograph of the date stone (A) and its bio-char (B).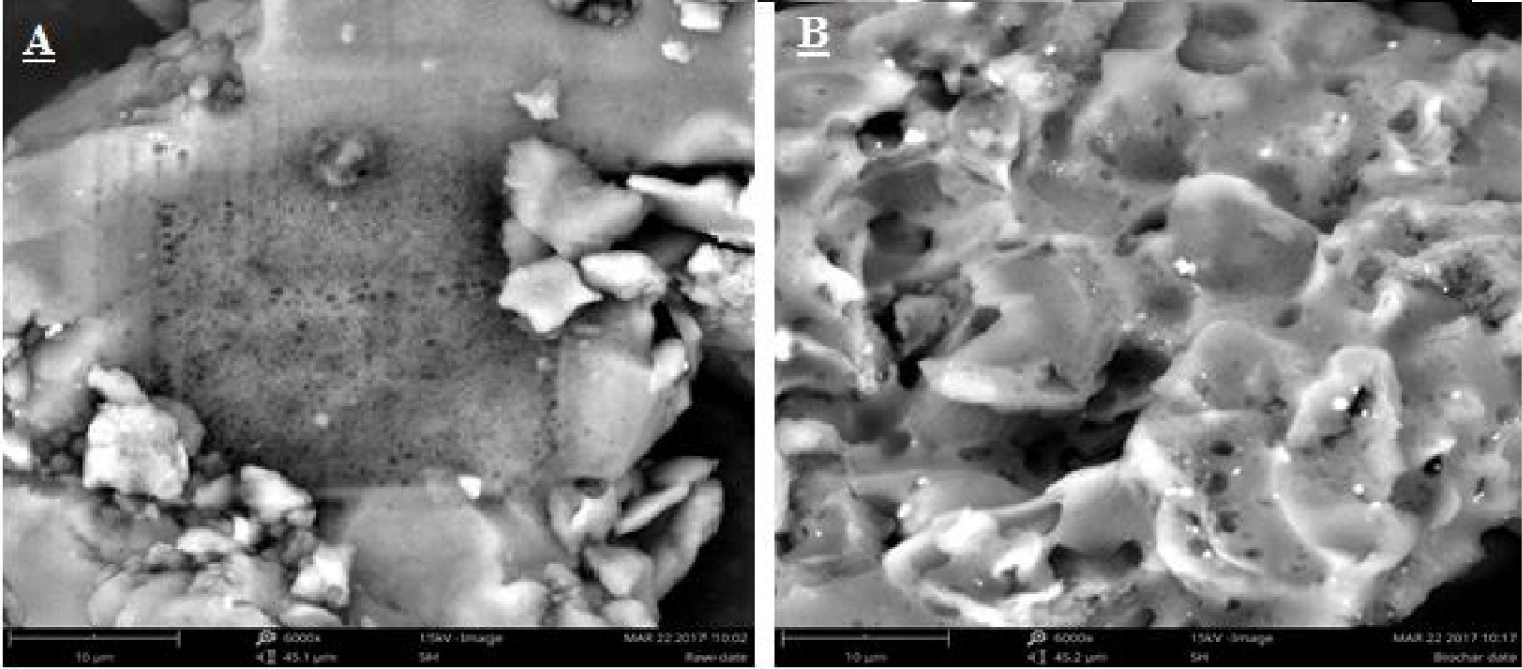
d. Iodine number and methylene blue index
The iodine number (I2) and MBI are widely used parameters for bio-char testing due to their simplicity and their rapid assessment of adsorbent quality. The values obtained are of the order of 100.83 mg/g and 51.28 mg/g for the iodine number (I2) and MBI, respectively. These values indicate that the surface of the bio-char has a low porosity, which may be less significant for adsorption or catalysis. Therefore, it is recommended to activate the surface of bio-char to improve its porosity. This result is verified by the calculation of the surface area specific to bio-char, which is of the order of 8.083 m2⋅g−1.
4. Conclusion
In sum, this work is part of research devoted to the valorization of the date stone by converting it to bio-oil and bio-char by pyrolysis using a fixed-bed reactor. All the experimental results obtained show that the best yields of bio-oil, bio-char, and bio-gas are approximately 36.64 ± 2.03%, 16.12 ± 0.98%, and 47.24 ± 3.21%, respectively, at a pyrolysis temperature of 500 °C, a heating rate of 10 °C∕min, and a particle size of 1.5 mm. However, the characterization of the liquid phase shows that the bio-oil produced under these optimal conditions consists mainly of aliphatic hydrocarbon in the form of alkylated fatty acids and their derivatives. This preliminary study shows that the bio-oil can be used as a bio-fuel or as a source of value-added chemicals. In addition, the bio-char has good properties suitable for its use as a solid fuel and as a carbon source for the production of activated carbon.