

 CC-BY 4.0
1. Introduction
Many investigations into the development of alternative resources and renewable energy are aimed at addressing the growing demand for energy as well as the continuing rise in energy prices and the persistent shortage of hydrocarbon resources [1]. Switching to a scenario with a greater share of renewable energies involves the use of biomass since this resource is certainly effective in providing energy in diverse forms such as heat, electricity, fuel for transportation, and so on depending on the thermochemical process used. Furthermore, zero carbon dioxide emissions associated with biomass and its availability in many areas of the world can be cited as an additional advantage.
A variety of thermochemical or biological processes can be used to convert biomass in the absence of oxygen to products with higher degrees of carbon content than the original biomass.
Traditional pyrolysis processes have been largely used to convert biomass in the absence of oxygen to products with a higher proportion of carbon content than the original biomass. Recently, hydrothermal carbonization (HTC), also known as wet pyrolysis or autohydrolysis and wet torrefaction [2], has attracted much attention as a sustainable, eco-friendly, and costless thermochemical process to convert organic biomass, in the presence of water, into bio-oil and a carbon-rich solid product (called hydrochar [HC]) [3] and also to recover nutrients from biomass in contrast to traditional pyrolysis [4]. The HTC temperature is much lower, ranging from 180 °C to 300 °C compared to the pyrolysis temperature (between 500 °C and 900 °C) [5]. As a result of the hermeticism of the system and the presence of liquid water under these conditions, autogenous pressures in the range 2–6 MPa are associated with HTC [6]. Besides, a variety of dwell times have been reported from several minutes to hours [7] although most of the reaction seems to occur within the first 20 min [8]. The distributions of the final products as well as its properties are strongly influenced by the reaction temperature of hydrothermal conversion processes [9, 10].
During biomass pyrolysis, the organic matter is thermochemically decomposed by heating in the absence of oxygen. Differently, during HTC processes, the biomass is submerged in subcritical liquid water and transformed into an HC; so prior costly drying of high-moisture biomass is not an issue [11], making the HTC process cheaper and more environment-friendly as compared to the traditional pyrolysis process [12]. As a result of HTC, the biomass structure is broken down, and an energy-rich carbonaceous HC is obtained, with a high calorific value, suitable as a renewable solid fuel or for value-added material applications [13, 14, 15].
Waste materials such as lignocellulosic biomass [16, 17, 18], algae [19], and food waste [20, 21] have been commonly used as starting materials for energy and resource recovery by HTC. In addition, HTC has recently attracted considerable interest from the research field, but only few authors have analyzed the HTC as a pretreatment and used HCs as a precursor for the traditional pyrolysis.
Aleppo pine (Pinus halepensis) forests cover a high area along North Africa and the Mediterranean basin. According to Ayari [22], pine forests cover more than 3.5 million ha with the highest surface area (2.5 million ha in the Mediterranean region). In Tunisia, the Aleppo pine forest is the most important woodland in the country; it extends from its subhumid zone in the north to the arid zone in the south [23]. Forests cover 1.1 million ha, where about 300 000 ha of Aleppo pine is found [24]. In fact, more than 10% of the Tunisian population live within the forest area, where they earn a good part of their resources [25].
The multiple functions and products extracted from Aleppo pine forests make this tree species one of the most appreciated ones in the Mediterranean basin. In Tunisia, their uses are related to different types of industries: seed (zgougou/food) and wood production, tannins (skin industry), soil protection, biodiversity, programs for reforestation of degraded areas, and as an anti-erosion species. Among these applications, pine seed production is an economically important food subsector in Tunisia.
Pine cones (PCs) are one of the most important products of Aleppo pine trees; these are mainly used in decoration applications. According to Ayari et al. [22], an average tree produces about 51 ± (7) cones per tree weighing a total of 921.6 ± (151.2) g/tree. After being emptied of seeds for food, the PCs are also used for decoration handcrafts.
Recently, a variety of thermochemical or biological treatments of PCs have been investigated in several studies such as pyrolysis [26, 27] and combustion [28], but they have been barely investigated during the HTC process. The high degree of heterogeneity and complexity of the PC structure makes its use as a raw material a tough challenge for HTC treatment.
The previous research of Boutaieb et al. [27], on the effect of the pyrolysis temperature on biochar characteristics and gas production, showed that under optimum conditions (at 600 °C for 30 min using 100 mL⋅min−1 of nitrogen flow rate) a high heating value (HHV) as high as 30.95 MJ⋅kg−1 was obtained, allowing its possible use as a briquette biofuel.
To the best of our knowledge, the HTC of PCs has been scarcely studied, and in particular, the influence of experimental conditions (temperature and residence time) on the process has not been analyzed so far. Moreover, the pyrolysis of HCs produced from PCs has not been reported in the literature.
The main objective of the present work is to provide deep insight into the HTC of PC, and to compare it to fast pyrolysis, as well as to evaluate the synergies of combining both processes. The fast pyrolysis was performed in a fixed-bed reactor and HTC was performed in an autoclave, while two-step reactions combined both processes. The comparison of the two treatments was based on the fraction yields, molar composition of gases, chemical composition, surface characteristics, and thermal stability.
2. Experimental procedure
2.1. Materials
Mature PCs (P. halepensis) were collected from southern Tunisia and then brushed to remove all seeds and soil particles. After the separation of the cone scales from the axis, the scales were sieved to obtain samples with particle size diameters ranging from 1.25 to 1.6 mm. The samples were then stored in sealed ziplock bags for further processing.
The PCs were investigated in terms of proximate and elemental analyses following suitable technical specifications as reported in Section 2.3. Their HHV was determined using a bomb calorimeter (Parr). These results are collected in Table 1.
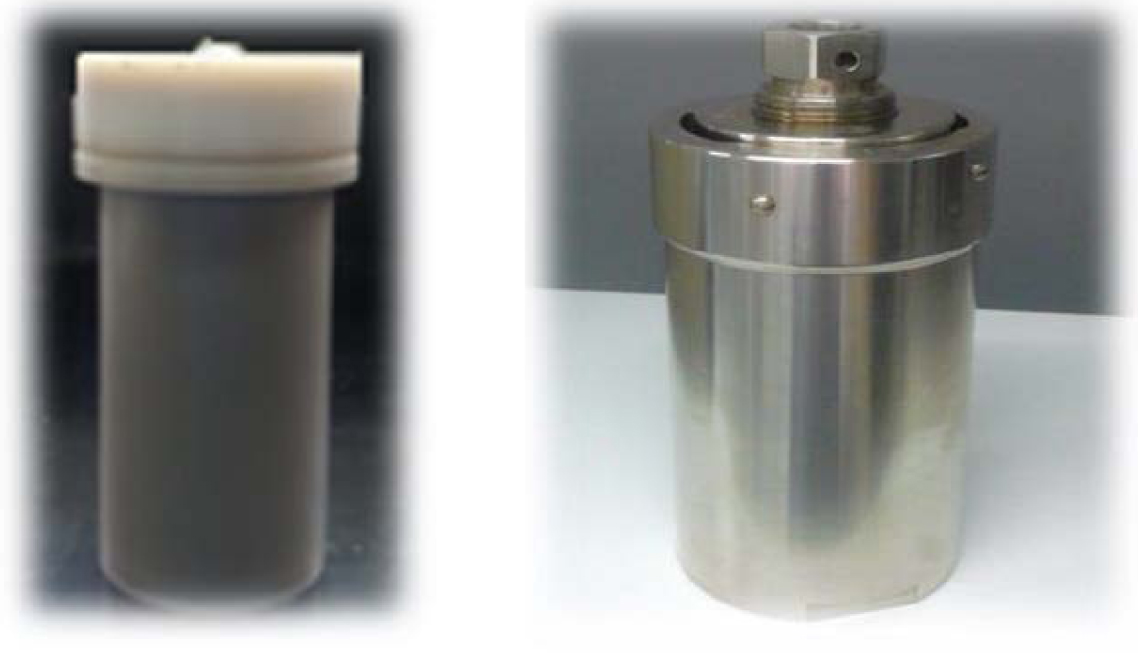
HTC Teflon vessel and stainless steel autoclave.
Proximate and elemental analyses (wt%) and HHV (MJ⋅kg−1) of raw scales and Spanish PC [28]
| Precursor | Proximate analysis (wt%) | Elemental composition (wt%) | HHV (MJ⋅kg−1) | ||||||
|---|---|---|---|---|---|---|---|---|---|
| Moisture | Volatile matter | Fixed carbon | Ash | C | N | H | O∗ | ||
| Raw-Sc | 10 | 79.2 | 10.2 | 0.6 | 50.5 | 0.29 | 5.86 | 43.35 | 18.0563 |
| Spanish PC [28] | 8.9 | - | - | 0.8 | 54.2 | 0.3 | 6.8 | 38.7 | 18.782 |
∗ The sulfur content in the hydrochars was not measured due to its minimal content in the raw biomass ( <0.01 wt%). ∗ Balanced (O% = 100 − (%C + %N + %H)).
2.2. Preparation of pyrochar
2.2.1. Pyrolysis process
Pyrolysis was carried out in a fixed-bed vertical cylindrical stainless steel reactor equipped with a heating system (electronic furnace). The experimental setup was described in detail in our previous work [27]. At each run, 15 g of PC was filled in the basket, which was then placed inside the preheated electronic furnace. All experiments were carried out isothermally in a fast pyrolysis regime at 600 °C, based on a previous optimization study [27].
Each experiment was carried out at least twice, and the values reported in this study correspond to their average.
2.2.2. Hydrothermal carbonization process
The HTC assays were performed in a 0.25 L stainless steel autoclave (Berghof Digestec DAB-3, Germany) as shown in Figure 1. In a 0.2 L Teflon vessel (unstirred), an appropriate amount of the sample (15 g) and 0.120 L of deionized water at room temperature were added to obtain the targeted biomass/water ratio R (1:8) at the same time that the biomass was completely submerged in water. Then, the Teflon vessel was sealed and placed into the autoclave, and the system remained overnight at room temperature. Thereafter, the system was heated in a preheated electric furnace at the required temperatures (180, 200, 220, and 240 °C). Based on previous research, the authors determined the time it took for the reactor to reach the target temperature using a simulation model. The heating period was considered for each temperature, and then 30 min (proper processing time) was added. After the reaction, the heater was turned off. The autoclave was removed from the oven and subsequently placed in a cold-water bath and allowed to cool down to room temperature (for about 15 min). After cooling, the resulting solid was separated from the liquid by filtration, washed with abundant distilled water until the filtrate was clean, and subsequently dried at 105 °C overnight to remove residual moisture. The resulting liquid was collected and stored in a glass beaker at 4 °C in a freezer. The dried HC was stored in a ziplock bag until the start of the analysis and pyrolysis process.
The effectiveness of HTC as a pyrolysis pretreatment was then tested. For this task, HC samples were pyrolyzed in the same reactor used for the previously described pyrolysis process [27] at 600 °C for 30 min under nitrogen atmosphere. The biochar derived from the pyrolysis of HCs is referred to as pyrochar (PYC), and the solid yield values were determined as follows.
HCy (wt%) is the solid yield of HTC processes and is calculated by (1), where mHC (g) is the mass of HC and mi (g) is the mass of the initial feedstock (15 g of raw scales):
| (1) |
| (2) |
2.3. Solid characterization
2.3.1. Elemental analysis
Elemental analyses were carried out using a LECO CHNS (EA 1108) elemental analyzer to quantify the carbon (C), hydrogen (H), and nitrogen (N) contents of raw PC scales (Raw-Sc), biochars, HCs, and PYCs, following the corresponding technical specification CEN/TS 15104 [29]. Specification CEN/TS 15289 [30] was used to determine sulfur (S) content. Oxygen (O) content was determined by difference using expression (3):
| (3) |
2.3.2. Textural characterization
Nitrogen adsorption isotherms at 77 K were performed by AUTOSORB equipment (Quantachrome). Before analyses, the selected samples were outgassed at 250 °C for 12 h. Characteristic parameters such as the apparent Brunauer–Emmet–Teller (BET) surface
2.3.3. Thermogravimetric analysis
The thermogravimetric behavior under inert atmosphere was analyzed by a thermobalance (TGA/DTG) (STA 449 F3 Jupiter–Netzsch) coupled with mass spectrometry (QMS 403D Aëolos III—Netzsch) using a flow rate of 100 mL⋅min−1 of argon and a heating rate of 20 °C⋅min−1 from 30 °C to 800 °C.
2.3.4. Surface chemistry
The surface chemistry of selected samples was studied by means of Fourier transform infrared (FT-IR) spectroscopy. The FT-IR spectra were recorded by a PerkinElmer model (PerkinElmer, 1000 PC), and bands were assigned according to suitable results from the literature [8, 12, 27].
2.3.5. Surface morphology analysis
Surface morphology studies were carried out by scanning electron microscopy (SEM, Quanta 3D FEG, FEI). The samples were prepared by depositing about 50 mg of the sample on an aluminum stud covered with conductive adhesive carbon tape and then coated with Rh–Pd for 1 min to prevent charging during observations. Imaging was carried out under high-vacuum conditions (<6 × 10⁻⁴ Pa) at an accelerating voltage of 30 kV by using secondary electrons for high vacuum (ETD).
3. Results
3.1. Precursors
Table 1 presents the proximate and elemental composition (wt%) of the Raw-Sc as well as their HHVs (MJ⋅kg−1).
The results obtained here are similar to data presented by other authors [28] for Spanish PCs. As seen in Table 1, PC has a high amount of volatile matter content, greater than 79%, and a low moisture content <15%. This result is as expected for lignocellulosic materials [31] and most of the agricultural and forest wastes [32].
The elemental analysis showed that the raw material was mainly composed of carbon ( >50%) and oxygen ( >40%) with a low percentage of nitrogen ( <0.29%) and a negligible amount of sulfur ( <0.01%). From an environmental point of view, a low N content ( <1%) is advantageous for minimizing toxic NOx emissions during combustion processes [33]. Besides, a low content of S is also important to prevent the formation of SO2 [32] and hence the corrosion of equipment [33].
3.2. Fraction yield and gas production
The influence of different process conditions on both Raw-Sc and HCs prepared at different temperature and residence time conditions is observed from the results in Table 2. It is noted that both variables influence the value of yields significantly.
Fraction yield of derived chars at different conditions
| Samples | HTC | HTC | Pyrolysis | SY | LY | GY |
|---|---|---|---|---|---|---|
| T (°C) | t (min) | T (°C) | (wt%) | (wt%) | (wt%) | |
| HC-180-30 | 180 | 30 | - | 84.07 | 15.17 | 0.76 |
| HC-200-30 | 200 | 30 | - | 80.13 | 9.87 | 10.00 |
| HC-220-30 | 220 | 30 | - | 80.47 | 7.93 | 11.6 |
| HC-240-30 | 240 | 30 | - | 76.13 | 11.00 | 12.87 |
| HC-240-60 | 240 | 60 | - | 66.47 | 24.06 | 9.47 |
| HC-240-180 | 240 | 180 | - | 62.20 | 27.87 | 9.93 |
| PY-600 | - | - | 600 | 27.07 | 41.47 | 31.46 |
| PYC-180-30-600 | 180 | 30 | 600 | 23.93 | 43.58 | 32.49 |
| PYC-200-30-600 | 200 | 30 | 600 | 23.53 | 43.34 | 33.13 |
| PYC-220-30-600 | 220 | 30 | 600 | 22.00 | 43.20 | 34.80 |
| PYC-240-30-600 | 240 | 30 | 600 | 21.67 | 42.39 | 35.94 |
| PYC-240-60-600 | 240 | 60 | 600 | 20.47 | 50.8 | 28.73 |
| PYC-240-180-600 | 240 | 180 | 600 | 20.20 | 57.87 | 21.93 |
HC = hydrochar; PYC = pyrochar; PY = biochar. SY = solid yield; LY = liquid yield; GY = gas yield.
First, compared to pyrolysis, HTC produces higher solid yields, fewer liquid yields, and a smaller quantity of gases. The HTC of raw feedstock under mild conditions is associated with a solid yield of 84.07%; the solid yield from pyrolysis is 27.07%. It may also be inferred that the liquid yields follow an inverse trend as compared to the solid yields—41.47% of liquid produced from raw feedstock pyrolysis as compared to 27.87% produced from HTC. This result is consistent with a more pronounced thermal decomposition of the feedstock during pyrolysis [34].
On the other hand, from Table 2, it can be observed that the reaction temperature has a major effect on the HTC process. The HC yields decrease as the reaction temperature increases from 84.07% at 180 °C to 76.13% at 240 °C. According to Lucian et al. [34], this decline in HC yield with temperature is due to the enhancement of a series of dehydration and decarboxylation reactions, which at higher temperatures become more effective and lead to an increase in the gaseous phase with a decrease in solid yield.
Moreover, it can be seen that different residence times have the same effect as the reaction temperature. They decrease with increase in residence time, from 76.13% for 30 min to 62.2% for 180 min (at the same temperature 240 °C). A larger amount of HCs was obtained at shorter residence times.
This decrease in HC yields at longer reaction times could be explained in terms of the formation of permanent gases and lighter organic compounds by prolonging the carbonization time [35].
As shown also in Table 2, the pyrochar yields tend to decrease from 23.93% to 21.67% with rising HTC temperature, while the gas yield increases from 32.49% to 35.94%. However, an increase in the HTC time leads to a decrease in the pyrochar yield from 21.67% to 20.2% and a decrease in the gas yield from 35.94% to 21.93%. In addition, an increase in HTC temperature has a negative effect on the formation of liquid yield due to a more pronounced thermal decomposition of the raw biomass and the liquid product at a high amount of gas and solid yields.
The effect of the temperature process on pyrochar production can be explained in terms of the decrease in volatile matter during HTC, which leads to the increase in carbon content after HTC and then after pyrolysis [36]. These results are in agreement with the results of thermogravimetric analysis in Section 3.3.
This decline in pyrochar yield and the increase in gas yield with rising HTC temperature or time are due to the previous decrease in volatile components [32].
Figure 2 shows the molar accumulation of gases with time. In general, at the beginning of the pyrolysis process, there is a negligible increase in the production of all gases followed by a significant gas release during the first 15 min at the maximum decomposition rate. However, after 20 min, cumulative molar gas is produced at a relatively slower rate until the end of the process to the end of the pyrolysis reaction.
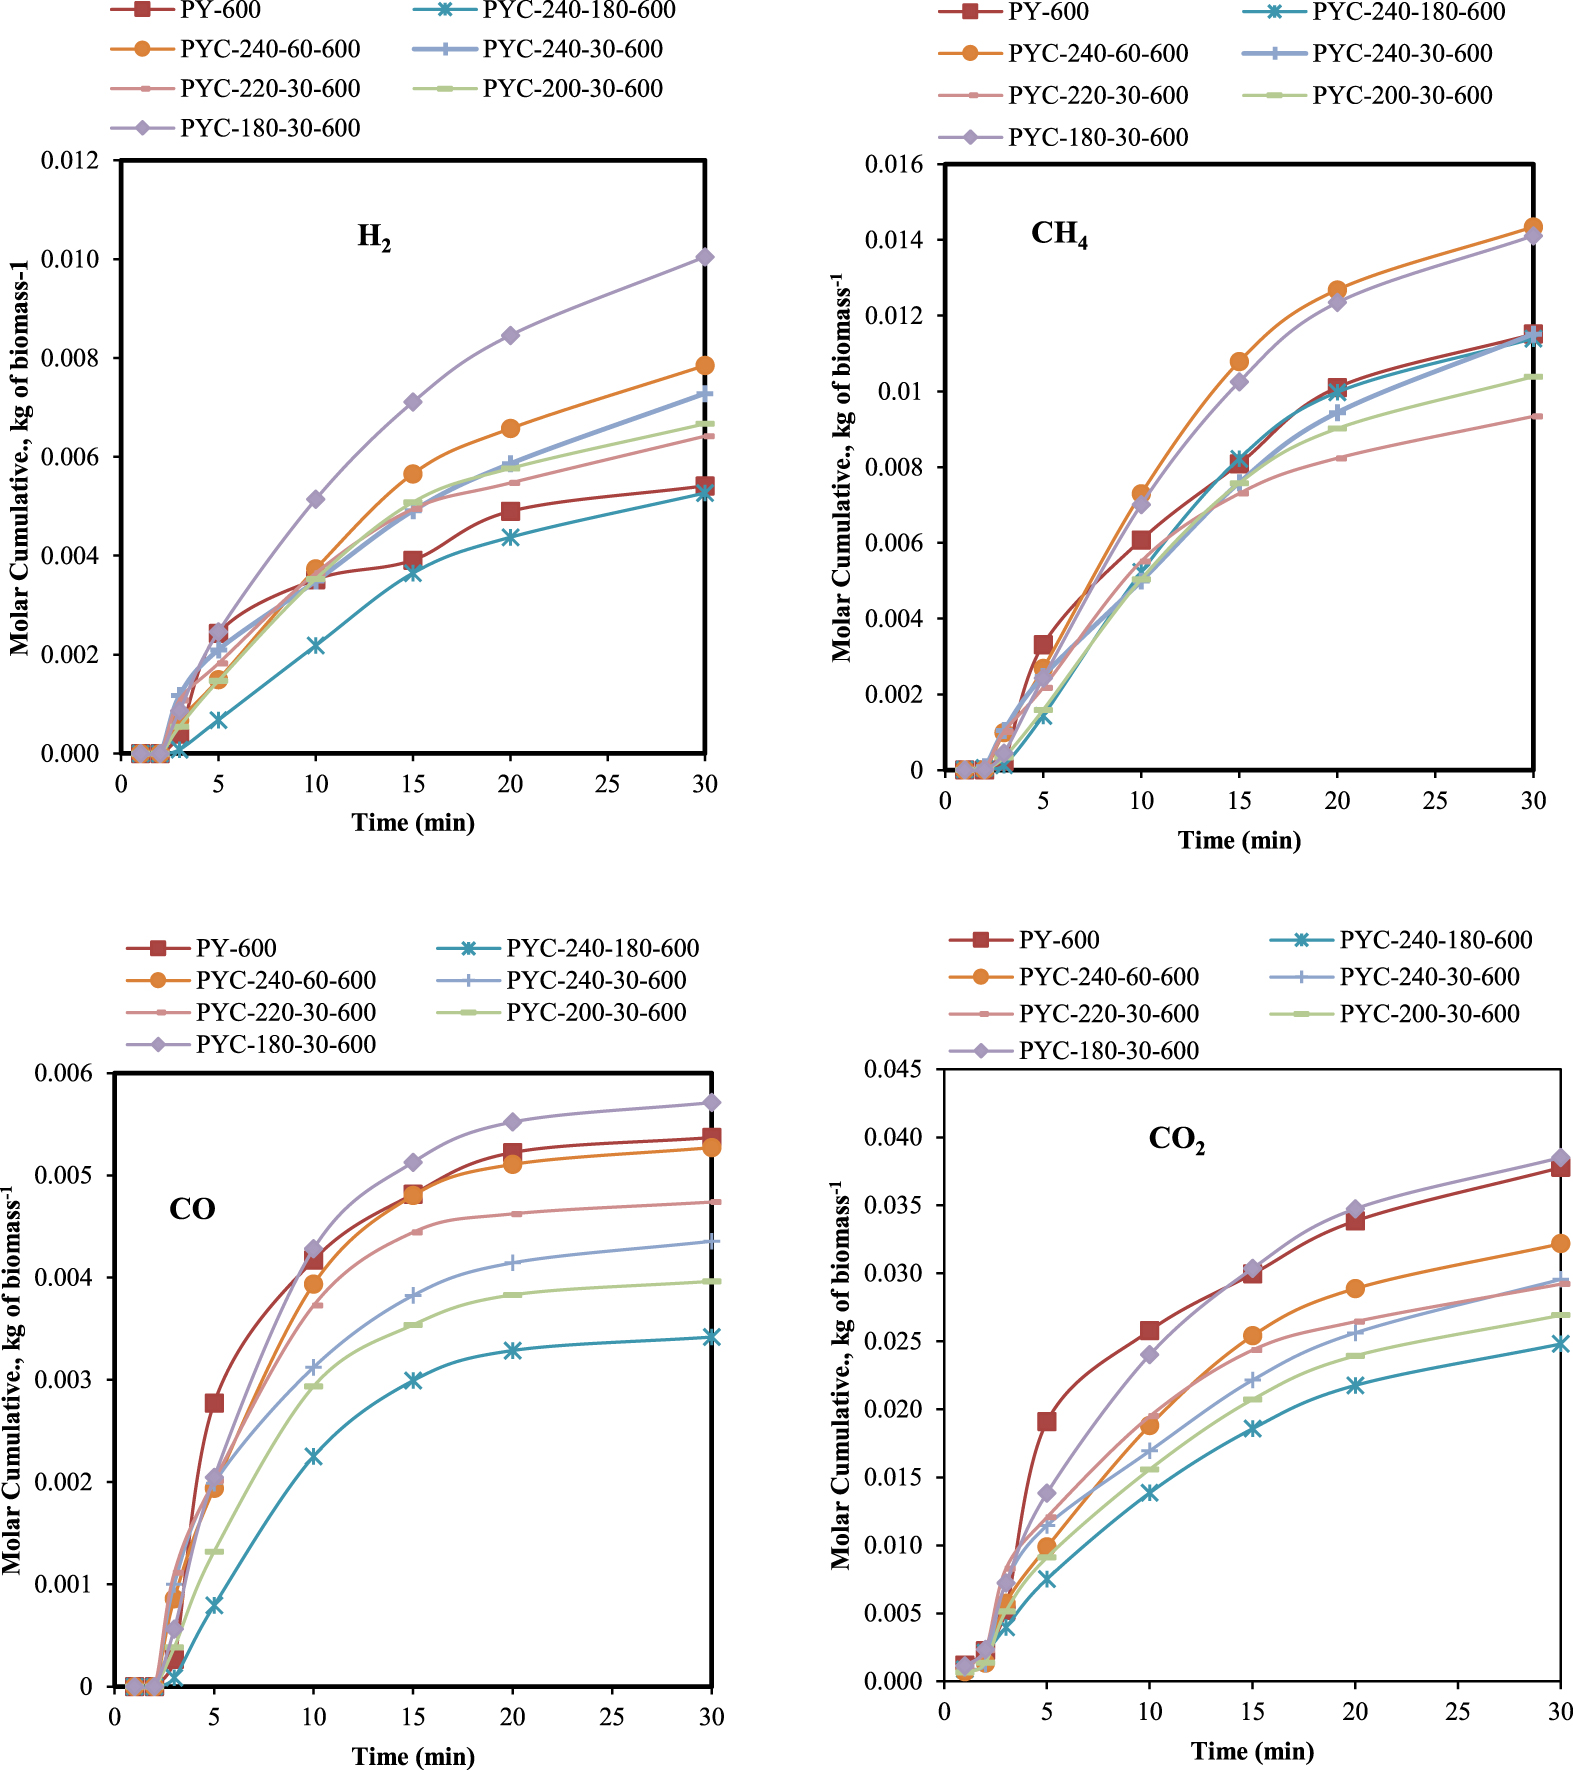
Effect of process conditions on gas molar cumulative.
The composition of gas was mainly CO2, CH4, which are the dominant components, H2, and a small fraction of CO. Figure 2 indicates that the production of gases is affected by the reaction time and the temperature. The more severe the reaction conditions, the greater the maximum gas yield. The figure also highlights the fact that under severe conditions, HTC maximizes gas production almost twice as that compared to conventional pyrolysis. A larger amount of gases was obtained at a higher HTC temperature 240 °C and pyrolysis temperature 600 °C for 60 min (0.86 mol⋅kg−1 of H2, 0.58 mol⋅kg−1 of CO, 1.57 mol⋅kg−1 of CH4, and 3.52 mol⋅kg−1 of CO2 with higher LHV = 562.46 kJ⋅L−1).
As shown in Figure 3, the CO and CO2 yields were reduced with increase in time and temperature. This could be related to the decomposition of the hemicellulose with rise in temperature since CO2 (and CO) was mainly produced as a consequence of the rearrangement of cellulose and hemicellulose during the early stages of thermal degradation [37].
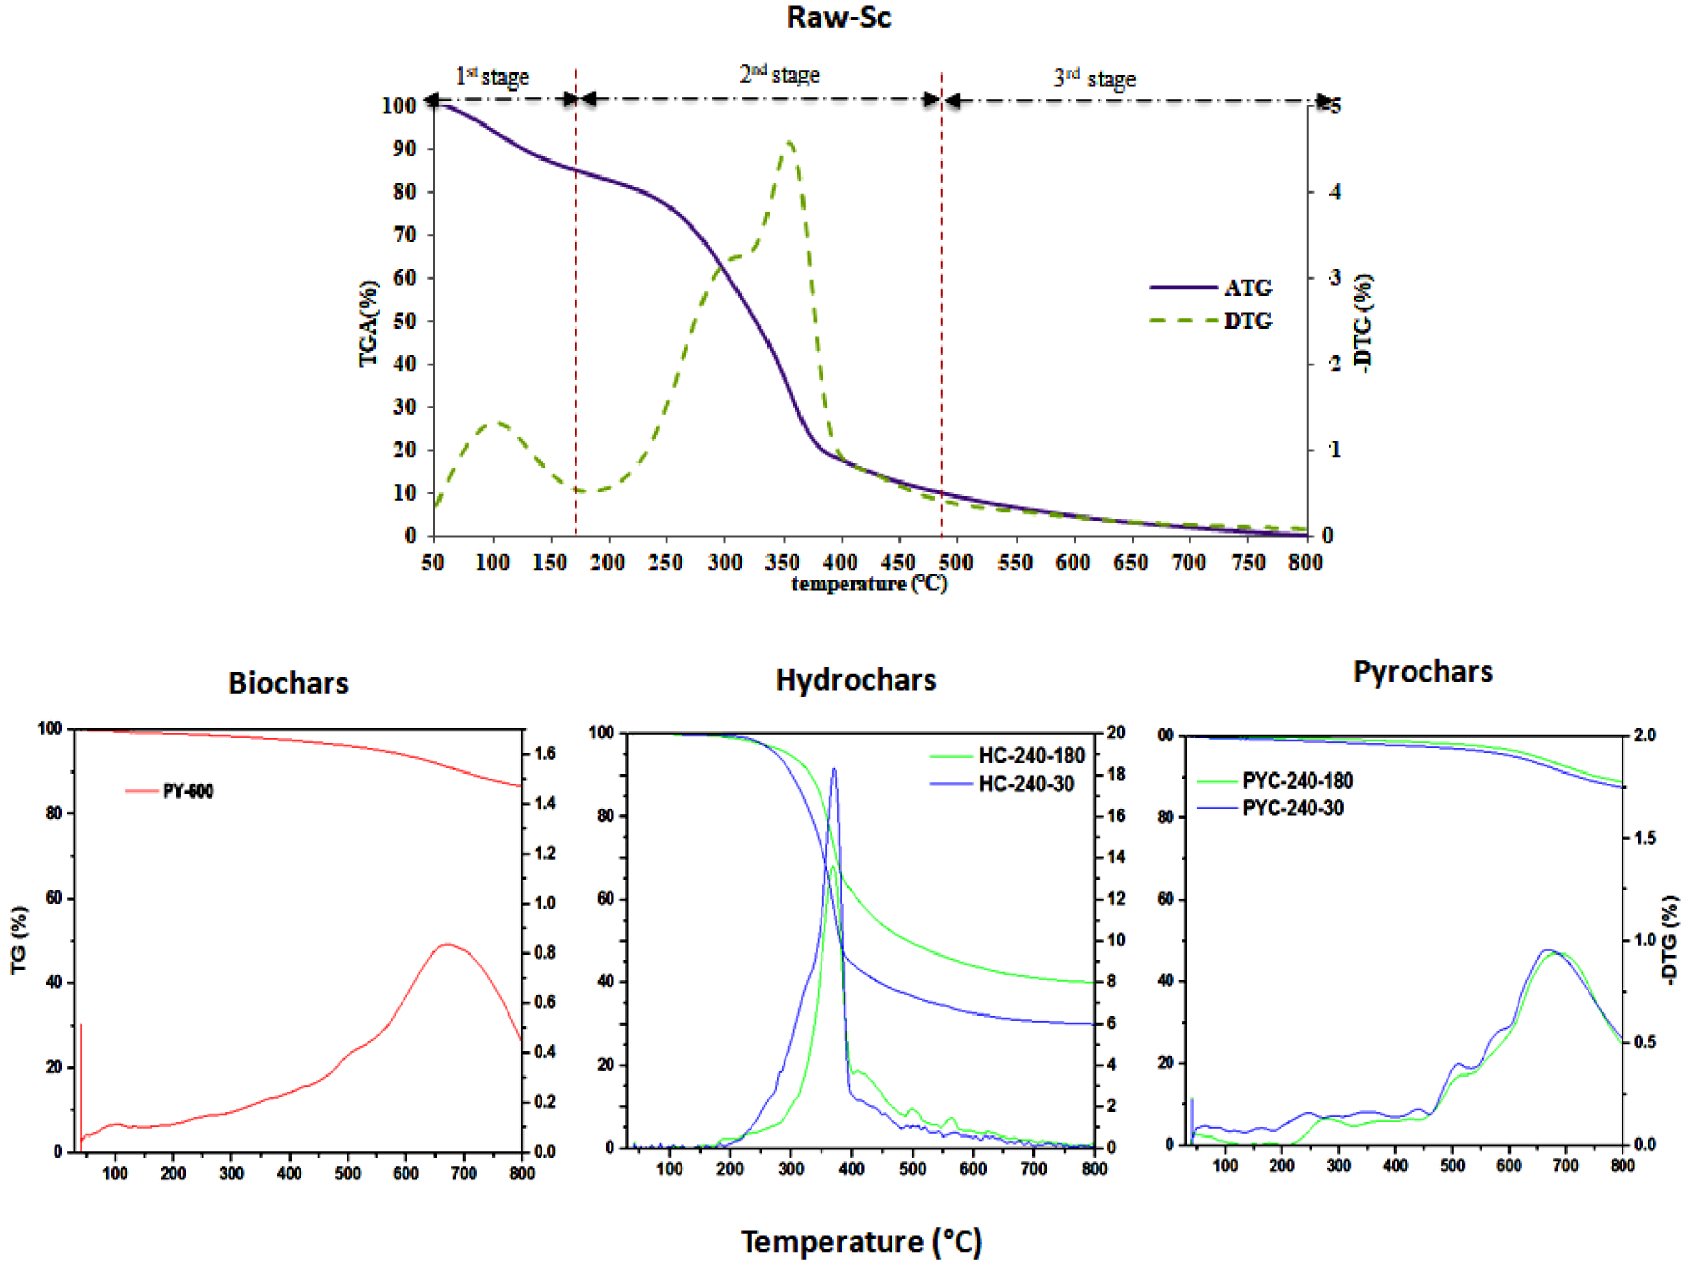
Thermogravimetric analysis of raw material and different chars.
These results were confirmed later from the thermogravimetric behavior of the chars.
In contrast to the release of CO and CO2, H2 emission increases with increase in process parameters. This rise can be related to secondary reactions in the liquid phase, which is greater in amount [38].
3.3. Thermogravimetric behavior of different chars
An analysis of the thermal behavior of chars was carried out from the thermogravimetric and dTG curves that are plotted in Figure 3.
The Raw-Sc showed three mass-loss peaks in pyrolysis. The first phase, ranging from 58.65 °C to 163.29 °C, corresponds to dehydration reaction and a release of volatile products. The second mass-loss peak (79.2%), between 160 °C and 400 °C, corresponds to the degradation of hemicellulose and cellulose. A small shoulder peak was observed in the dTG profile at approximately 290 °C due to the decomposition of hemicellulose. Finally, the third phase begins at a temperature of 400 °C, and it can be associated with the degradation of lignin[39].
In contrast, the chars exhibited only two peaks. The second mass loss and the small shoulder peak in dTG at 290 °C disappeared, which indicates the decomposition of hemicellulose in both processes. These results are in agreement with the trends found by other authors for the HTC process [16, 40].
Moreover, the initial decomposition temperature of both pyrochars and HCs was higher than that of biochars and raw scales, respectively, which could be related to the reduction in volatile matter during the HTC step [35].
An interesting observation is that the rise in pyrolysis and HTC temperatures resulted in a slight shift of the loss peak to a higher temperature (up to 700 °C), which explains the thermally stable structures in chars (pyrochars). In turn, this means a significant advantage in terms of subsequent combustion applications. Correa et al. [40] and Wang et al. [41] related the presence of inorganic content in the HC to changes in the mass-loss velocity as a consequence of inhibition of particular decomposition reactions.
This can promote the HTC step, which therefore results in the stability of char when used as a combustible.
3.4. Elemental and proximate analyses
The process temperature and reaction time are the main factors influencing the char composition. Table 3 presents the elemental composition of chars from pyrolysis, HTC, and HTC–pyrolysis as well as their HHV values:
| (4) |
As compared to the HCs, the pyrochars and the biochars showed higher carbon and nitrogen contents and lower hydrogen and oxygen contents. In general, carbon content is higher than 85%, nitrogen content is lower than 1%, hydrogen content is up to 3%, and the oxygen content is close to 9%.
Elemental composition and higher heating value of different chars
| Samples | HTC | HTC | Pyrolysis | C (%) | N (%) | H (%) | O (%) | H/C | O/C | HHV |
|---|---|---|---|---|---|---|---|---|---|---|
| t (min) | T (°C) | |||||||||
| Raw-Sc | - | - | - | 50.5 | 0.29 | 5.86 | 43.35 | 1.38 | 0.64 | 18.06 |
| HC-180-30 | 180 | 30 | - | -* | -* | -* | -* | -* | -* | 20.30 |
| HC-200-30 | 200 | 30 | - | 53.7 | 0.27 | 6.19 | 39.84 | 1.37 | 0.56 | 21.79 |
| HC-220-30 | 220 | 30 | - | 55.2 | 0.35 | 6.20 | 38.25 | 1.34 | 0.52 | 20.89 |
| HC-240-30 | 240 | 30 | - | 56.2 | 0.33 | 6.14 | 37.33 | 1.30 | 0.50 | 20.99 |
| HC-240-60 | 240 | 60 | - | 58.1 | 0.33 | 6.02 | 35.33 | 1.23 | 0.46 | 22.54 |
| HC-240-180 | 240 | 180 | - | 66.6 | 0.47 | 5.75 | 27.18 | 1.03 | 0.31 | 24.72 |
| Pyro-600 | - | - | 600 | 91.4 | 0.88 | 2.65 | 5.07 | 0.35 | 0.04 | 30.63 |
| PYC-180-30-600 | 180 | 30 | 600 | 90.7 | 1.01 | 2.64 | 5.65 | 0.35 | 0.05 | 29.77 |
| PYC-200-30-600 | 200 | 30 | 600 | 86.0 | 0.85 | 2.74 | 10.41 | 0.38 | 0.091 | 31.99 |
| PYC-220-30-600 | 220 | 30 | 600 | 91.4 | 0.96 | 2.80 | 4.84 | 0.36 | 0.040 | 31.85 |
| PYC-240-30-600 | 240 | 30 | 600 | 87.0 | 0.99 | 2.71 | 9.30 | 0.37 | 0.080 | 32.81 |
| PYC-240-60-600 | 240 | 60 | 600 | 92.5 | 0.98 | 2.81 | 3.71 | 0.36 | 0.030 | 34.28 |
| PYC-240-180-600 | 240 | 180 | 600 | 87.1 | 0.89 | 2.84 | 9.17 | 0.39 | 0.080 | 34.17 |
In addition, the carbon content of the pyrochar treated under different HTC process conditions and pyrolyzed at 600 °C (≈<92%) decreased by about 4% compared to the corresponding biochar (91.4%).
The higher the HTC temperature (240 °C) and residence time (180 min), the higher the carbon (66.6%) and nitrogen (0.47%) contents and the lower the oxygen (27.18%) and hydrogen (5.75%) contents of the HCs produced. By comparison with the biochars produced from the raw material, it could be concluded that the HTC step improves the elemental content of the pyrochars except the carbon content.
The carbon enrichment was explained by Zhang et al. [42], who related it to a greater degree of aromatization and condensation during the HTC and the reduction in the H and O contents to dehydration and decarboxylation reactions. In addition, Chen et al. [43] related this drop in H and O contents to the cracking and decomposition of biomass, which was coupled with gas emission. The fact that most of the carbon in the biomass is retained in HC suggests that the HTC is beneficial to the enrichment of the pyrochar carbon content compared with that of the conventional pyrolysis process. This is one of the strengths of this work.
Using the elemental composition data (Table 3), the H/C and O/C atomic ratios were calculated and then plotted in Figure 4 (Van Krevelen diagram). From this diagram, it can be clearly found that both H/C and O/C atomic ratios of the HCs closely resemble the initial raw material and biomass unlike pyrochars and biochars, which both exhibit lower H/C and O/C atomic ratios similar to those of natural coal. These results could be explained by the higher rate evolution of H2O and CO2 in the dehydration and decarboxylation reactions during HTC and then in pyrolysis [15].
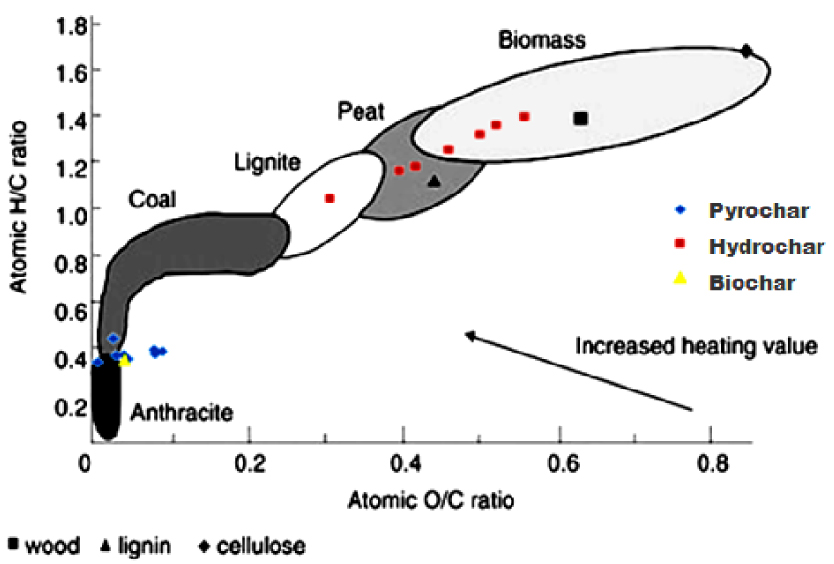
Van Krevelen diagram of different chars produced at different conditions.
As illustrated in Figure 5, where the correlation between H/C and O/C atomic ratios of the HCs is given, it can be clearly observed that the HC points lie almost on a straight line (R2 = 0.9951), with a slope close to 1.4, showing that 1.4 atoms of H are lost for each atom of O. In addition, the straight line corresponds to dehydration reactions. Therefore, it can be concluded that decarboxylation and dehydration reactions are dominant in the PC HTC under different experimental conditions.
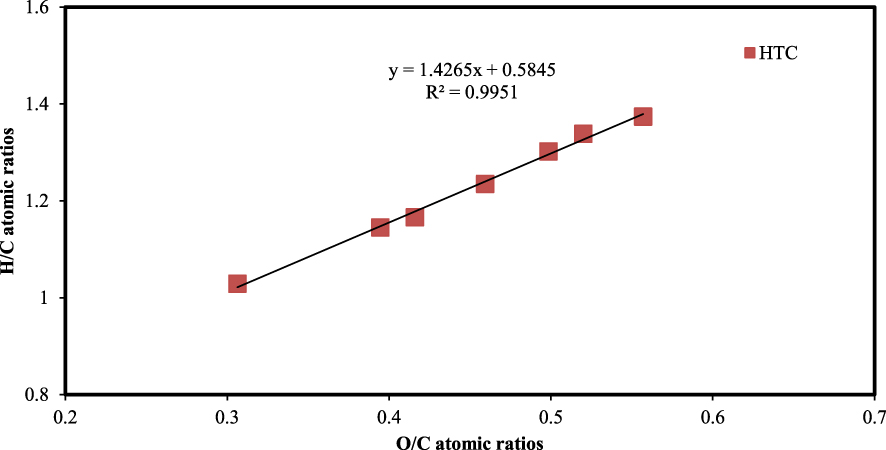
Correlation between H/C and O/C atomic ratios of hydrochar samples.
Energy production is a crucial element in determining the feasibility of a biomass conversion process. For this reason, the comparison of the HHVs of solid products from both processes is necessary. Both processes convert PC to a coal-like material that has potential for energy production. The HHVs of the HCs are in the range from 20.3 to 24.72 MJ⋅kg−1, while 30.63 MJ⋅kg−1 is reported for pyrolysis. Moreover, similar measurements for the combined process (pyrolysis with HTC) produced values up to 34.28 MJ⋅kg−1.
From these results, it can be observed that HTC increases the HHV of pyrochars compared to that of biochars. Furthermore, there is an optimum temperature for which the HHV of char is maximum. This occurs at the highest HTC temperature and time (240 °C for 60 min) and pyrolysis temperature (600 °C).
In addition, the HHV of the final chars (34.28 MJ⋅kg−1) is equivalent to the HHV of anthracite, indicating that the chars derived from hydrothermally treated PC have the potential to be used as solid fuels for combustion applications [33]. According to French standards [44], this pyrochar, with an HHV of 34.28 MJ⋅kg−1 and high fixed carbon content of 92.5% ( >70%) could be utilized as a category-A briquette for domestic use. Thus, it is important to keep in mind that complex reaction mechanisms are involved in the calorific nature of the process reactions and highly dependent on reaction conditions. In fact, although the overall reaction is exothermic, the initial phases of both pyrolysis and HTC are endothermic.
3.5. Characterizing pore structure of chars
The N2 adsorption isotherms of selected chars (biochars prepared at 600 °C, HCs [HC-200-180, HC-240-180, and HC-240-30], and pyrochars [PYC-200-180-600, PYC-240-180-600, and PYC-240-30-600]) are plotted in Figure 6. The N2-BET surface area of the same biochars and pyrochars are also listed in Table 4.
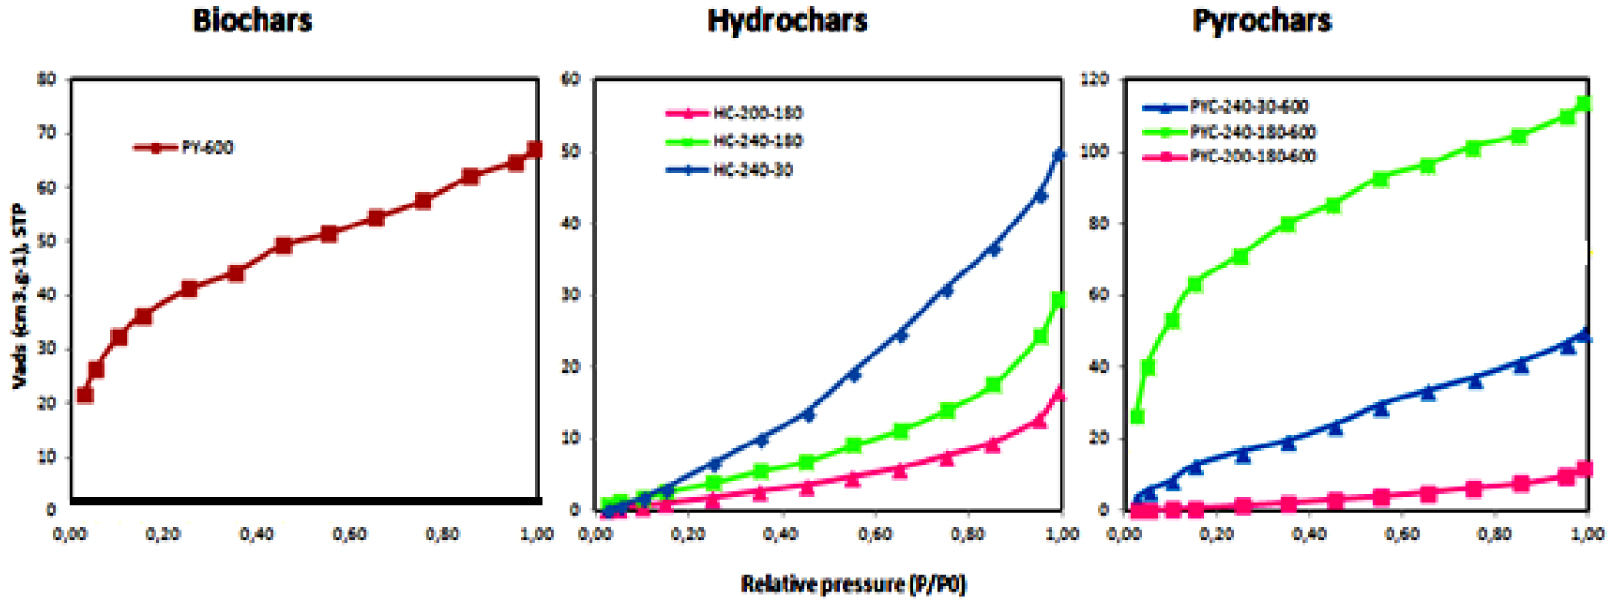
Nitrogen adsorption isotherms of selected chars at −196 °C.
These samples were chosen to compare both the effect of the HTC temperature (HC-200-180 and HC-240-180) and the effect of HTC residence time (HC-240-30 and HC-240-180) as well as to analyze the effect of pyrolysis of the HCs produced.
As shown in Figure 6, where the N2 adsorption isotherms of selected chars at −196 °C have been plotted, the isotherms of HCs have the same shape, indicating that the HTC temperature and time had no significant influence on the pore-size distribution [33]. The isotherms are of type II according to the IUPAC classification [45], indicating that the HCs have a mesoporous structure [46] with weak adsorbate–adsorbent interactions. Furthermore, the adsorbed N molecules are clustered around the most favorable sites on the surface of the pores, which makes the amount adsorbed at the saturation pressure finite and reduces the BET surface area [36].
Physical characteristics of selected chars
| Samples | SBET (m2⋅g−1) | Vmi (cm3⋅g−1) | Vme (cm3⋅g−1) | SEXT (m2⋅g−1) |
|---|---|---|---|---|
| PY-600 | 123 | 0.077 | 0.027 | 154 |
| PYC-200-180-600 | 135 | 0.009 | 0.01 | 65 |
| PYC-240-180-600 | 237 | 0.152 | 0.024 | 227 |
| PYC-240-30-600 | 64 | 0.052 | 0.024 | 207 |
In contrast to HCs, pyrochar and biochar isotherms exhibit a gradual increase in the adsorbed volume, and most of the uptake of N2 adsorption occurs in low relative pressure regions (P∕P0 < 0.1), indicating the presence of micropores [16]. This is consistent with a rearrangement of carbon layers during the creation of small pores, which is more evident for the sample obtained from one-step pyrolysis and also for the pyrolysis of high-temperature HCs.
These results confirm the observations made during the SEM analysis, which is further described in Section 3.6.
The results of physical characteristics listed in Table 4 show that char samples have a moderate apparent BET surface area, which in general is lower than 240 m2⋅g−1. Compared to biochars, pyrochars have a significantly greater surface area.
Considering the pyrolysis process, there is a very significant increase in the BET specific surface area of both chars that are prepared with (PYC) and without (PY) HTC.
A similar observation is made as follows. When the HTC temperature is increased, the pyrochar sample prepared at a higher HTC temperature (PYC-240-180-600) has a surface area 1.75 times larger (237 m2⋅g−1) than the pyrochar prepared at a lower HTC temperature (PYC-200-180-600).
Since pores can be formed by the loss of volatiles [35], it can be suggested that the increase in pores on the PYC surface compared to that on the biochars can be caused by the loss of total volatiles during the HTC process.
These results confirm the observations made during the SEM analysis in Section 3.6.
3.6. External surface morphology of chars by SEM
The surface morphology of selected samples was studied by SEM. Figures 7 and 8 show representative micrographs corresponding to the selected biochar (PY-600) and the pyrochar (PYC-240-180-600). First, it is important to note that the cellular morphology of the feedstock is maintained after both processes.
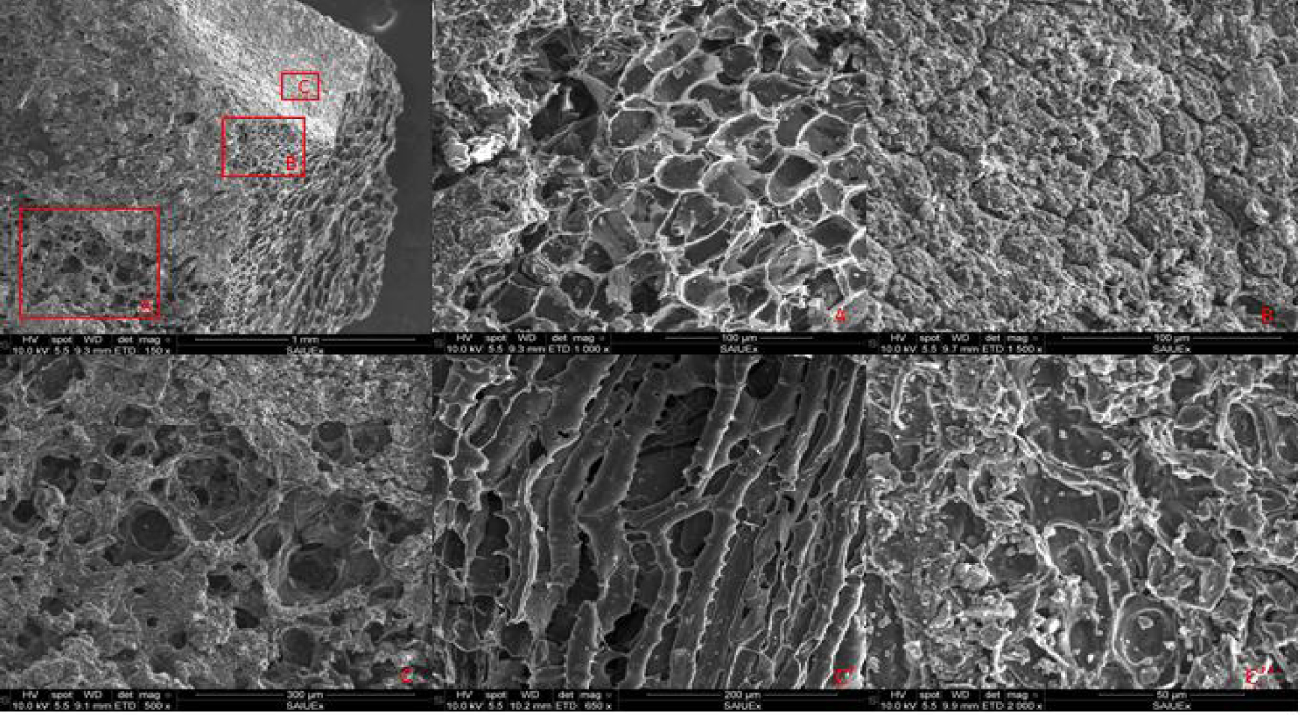
SEM for biochar (PY-600).
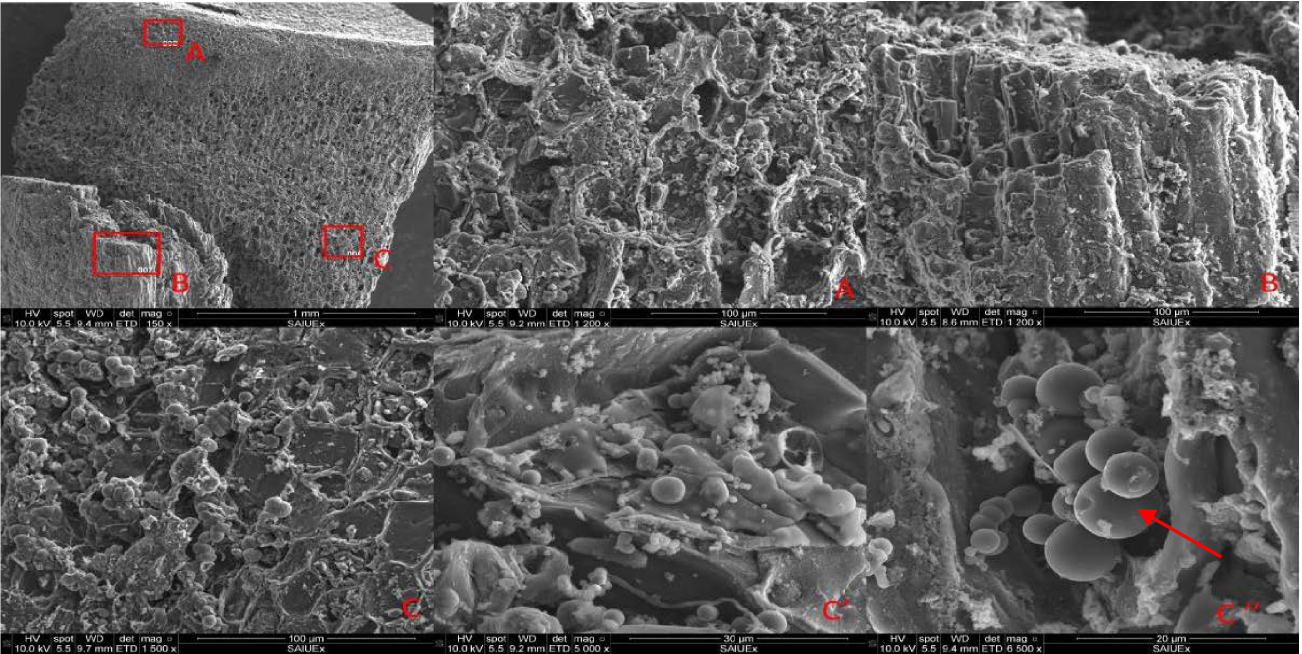
SEM for pyrochar (PYC-240-180-600).
From these figures, it can be observed that the surface structure of the pyrochar differs substantially from that of the biochar.
In contrast to the biochar, the pyrochars are covered with carbon microspheres on the surface with a distinctive size distribution. The carbon microspheres are mainly produced by the breakup of cellulose molecules [47] that might be decomposed during the HTC process and then during the pyrolysis process as well as by the recombination of carbon products from decarboxylation reactions [2]. Azzaz et al. [12] also explained that these carbon microspheres are formed due to a change in the crystalline arrangement associated with the condensation of cellulose and hemicellulose in the carbon content.
On the other hand, in all samples, the fibrous structure of the starting material is maintained. The distinctive differences in the char structures result from a shift in the reaction mechanisms governing the processes.
From the EDX surface composition analysis of the two chars, it was reported that their outer surface is mainly made up of carbon with very low oxygen content [48]. These results confirm the observations made during the elemental analysis (Section 3.4).
As a result of hydrolysis, cellulose breaks up into small-chain polymers and monomers, which later can polymerize as higher molecular weight compounds (this is the second solid phase as was previously indicated by thermogravimetric profiles). After hydrolysis, dehydration is assumed to take place. This process can be both physical (rejection of water from the solid precursor) and chemical (removal of hydroxyl groups). The spherical configuration is related to their limited solubility and hydrophobicity as it minimizes the interfacial surface HC-solvent [8].
3.7. FT-IR analysis
To study the surface chemistry transformations that take place in both processes, only the IR spectra of selected samples (PY-600, HC-240-30, PYC-240-30-600, HC-240-180, and PYC-240-180-600) have been included in this part. The spectra are shown in Figure 9.
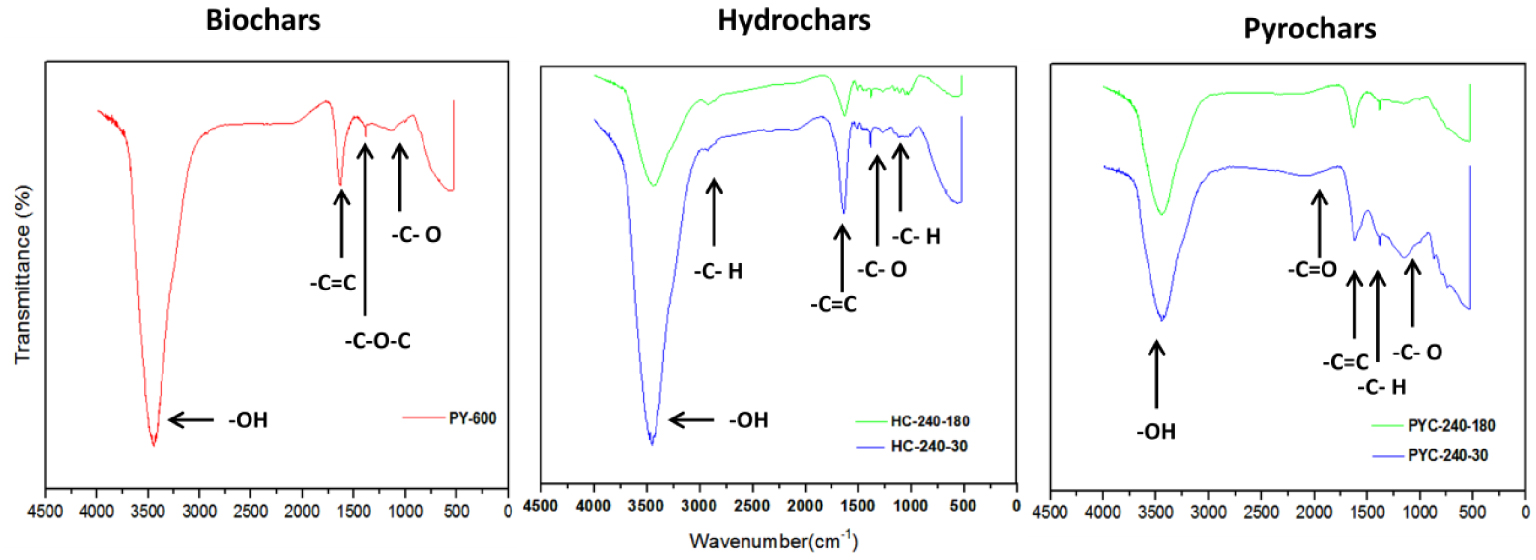
FT-IR spectra of chars prepared under different conditions.
From Figure 9, the FT-IR spectra indicate that the biochars and HCs share similar functional groups.
In all cases, a large peak at 3454 cm−1 can be attributed to O–H stretching vibration in the hydroxyl and carboxyl groups, indicating the presence of a large number of hydroxyl groups in the chars. The intensity of this peak is gradually weakened as the HTC and pyrolysis temperature and time increase, which is due to the dehydration and decarboxylation reactions in both processes [48, 49]. These results are in agreement with those from elemental analysis (Figure 5) in Section 3.4.
From the HC spectrum, it can be observed that small peaks appear at 2920 cm−1, which represent C–H stretching vibrations of aliphatic compounds. This indicates the presence of aliphatic and aromatic structures. These peaks present in the HC spectrum disappear in the pyrochar and biochar spectra (after pyrolysis). This implies the destruction of hemicellulose and cellulose during pyrolysis.
Another peak is characteristic of cellulose and lignin and is associated with different C–O–C (carbonyl) linkages and primary alcohols within the structure of these materials. These bands are found in the aromatic (1450–1650 cm−1) and nonconjugated carbonyl (1730 cm−1) regions.
The peak at 1730 cm−1 can be attributed to the C =O stretching vibration of acetyl in hemicellulose [8, 49]. It can be observed that with rise in the pyrolysis and HTC time and temperature, the peaks are substantially diminished, indicating an increase in the destruction of hemicellulose.
The peak at 1650 cm−1 is attributed to the stretching vibration of C =C in the aromatic structure [8, 27]. The peak at 1386 cm−1 is assigned to the stretching vibration of C–H bonds in cellulose or C–O bonds in syringyl derivatives [8].
At the highest HTC and pyrolysis temperatures (240 °C and 600 °C, respectively), the intensity of peaks at 1030 cm−1 associated with the stretching vibrations of C–O and C–C in cellulose and hemicellulose [27, 36] is gradually weakened. This indicates that the cellulose in biomass is degraded during both processes, but there is still a fraction of it that did not react [27]. On the other hand, [36] explained that during the HTC process, aliphatic and aromatic hydrocarbons are formed and suggested that this increase in aromaticity is confirmed by the decrease in H/C atomic ratios. This result is in good agreement with the elemental analysis result presented in Table 3.
4. Conclusions
This work has focused on the study of pyrolysis and HTC of PC for converting it into a carbon-rich material. The resulting chars have been characterized in terms of their composition, energetic power, and morphology and surface chemistry. It can be concluded that the HTC of PC leads to an increase in the fixed carbon content of the material. This is accompanied by a reduction in volatile matter, compared to the pyrolysis process, which results in an increase in the calorific value of the material. This is one of the strengths of this work. Especially influential is the temperature variable followed by the HTC time. Results show that increasing the HTC temperature from 180 °C to 240 °C leads to a decrease in the solid yield and an increase in the gas yield, while increasing the HTC time leads to a decrease in both solid and gas yields. The optimum HTC conditions (240 °C and 60 min) yield a carbon content and a higher heating value of 92.5% and 34.28 MJ⋅kg−1, respectively, leading to a material that might be utilized as a category-A briquette for domestic use.
Moreover, the adsorbed heat modified the surface morphology of the HCs with the appearance of carbon microspheres related to the breakup of cellulose and the condensation of hemicellulose in the carbon content.
Finally, the chemical structure of pyrochars more closely resembles natural coal than charcoal with respect to the types of chemical bonds and their relative quantity as well as their elemental composition.
Highlights
- The pyrochar yield decreases and gas production increases with increment in HTC temperature.
- The HTC maximizes gas production almost twice as much as conventional pyrolysis.
- A larger amount of gases is obtained at the highest HTC temperature with a higher PCI to produce heat and electricity.
- The pyrochar generated at the highest HTC temperature and time has the highest HHV.
- The biomass is transformed into a coal-like material to be utilized as briquettes for domestic use.
Vous devez vous connecter pour continuer.
S'authentifier