


 CC-BY 4.0
1. Introduction
Phenol is a precursor for numerous products such as herbicides, drugs, paints, cosmetics, and lubricants with its primary use as an intermediate in the production of phenolic resins (e.g., phenol–formaldehyde resins). It is also converted to a precursor of plastics via condensation with acetone, which results in bisphenol A for the manufacture of polycarbonates and epoxide resins, which forms its other major use. This in addition to phenolic resins constitutes about two-thirds of its total use. When phenol and phenol-containing compounds (alkylphenols or diphenols) are condensed with formaldehyde, the end product is Bakelite, a synthetic thermosetting phenolic resin. Other important compounds obtained from phenol include cyclohexanone (a material for the production of nylon), alkylphenols (nonylphenol or its ethoxylated product, which is used for the production of non-ionic detergents). Secondary uses of phenol and its compounds include a multifaceted raw material for manufacturing drugs (aspirin and pharyngitis medicines), carbolic soap (a component of industrial paint strippers in the aviation industry), and cosmetics (such as sunscreens, hair dyes, and skin lightening products) [1, 2, 3].
Phenol is considered one of the most hazardous organic contaminants in wastewater since it is highly poisonous even at low concentrations. Phenols, total phenols, and phenolics in remediation studies represent either phenol or its compounds in wastewater. Phenolics are swiftly ingested via skin and eye contact, and inhalation, and they cause burning sensations on the skin and in the eyes. Aside from their corrosive effects, they cause skin sensitivity. As stated by the Occupational Safety and Health Administration (USA), the limit of phenol contact with the skin should be less than 5 mg/l, and it is considered that the ingestion of 1 g of phenols is fatal to humans [4, 5, 6]. Phenol and its derivatives are well-known recalcitrant organic contaminants that are generated from numerous industrial processes. They normally exist in the effluents of numerous relevant industries [6, 7, 8, 9, 10] such as refineries (6–500 mg/l), coking operations (28–3900 mg/l), coal processing (9–6800 mg/l), petrochemical plants (2.8–1220 mg/l), and other sources such as pharmaceuticals, plastics, wood products, paint, pulp, and paper industries containing about 0.1–1600 mg/l phenols [4, 5, 6, 11, 12]. For safety and the prevention of environmental issues, it is imperative to eliminate them from the wastes of different production units of these industries before they are discharged into the biosphere.
Various techniques have been adopted for the elimination of organic pollutants in industrial wastewater. Some of the conventional techniques for the elimination of phenolics in industrial wastewater are membrane filtration, coagulation/flocculation, ion exchange, electrolysis, adsorption on activated carbon, chemical reduction, and advanced oxidation processes (AOPs) [13, 14, 15]. Among others, AOPs have gained more popularity due to their ability to extensively eliminate these pollutants [8, 10, 16]. The AOPs refer to the procedures that largely use non-selective hydroxyl radicals for eliminating organic pollutants in wastewater. They can work in synergy with other substances and techniques to provide a robust remediation of wastewater. When in synergy with other substances and techniques, AOPs are referred to as integrated advanced oxidation processes (I-AOPs) [17]. The I-AOPs have been established to provide efficient synergistic and holistic treatment of wastewater (in terms of better degradation efficiency, low energy consumption, less use of reagent and chemicals, lower cost of operation, etc.), which their non-integrated counterparts have not been able to achieve [13, 14, 16, 18]. The Fenton reaction is one of the widely used AOPs for the degradation of pollutants in wastewater. It refers to the catalyzed decomposition of hydrogen peroxide by ferrous ions to produce hydroxyl radicals. The primary Fenton reaction involves the reaction between ferrous iron (Fe2+) and hydrogen peroxide (H2O2) to produce hydroxyl radicals (•OH) and ferric iron (Fe3+) [13, 14].
Numerous factors are capable of interfering with and limiting the efficiency of I-AOPs [18, 19, 20, 21, 22]. One such factor is the non-selective nature of the hydroxyl radical generated from hydrogen peroxide [23] and the presence of organic and inorganic ions [20], which cumulatively reduce the efficiency of AOPs. Alternative oxidizing agents have been researched that can generate selective/target-oriented radicals that can improve the efficiency of wastewater treatment; among these are peroxyacids. These are peroxides produced by the reaction of carboxylic acids with hydrogen peroxide. They are strong oxidants and are more reactive than hydrogen peroxide [24, 25]. The oxidation capability of peroxides is connected to the electronegativity of the substituent of peroxyacids. Since the electronegativity of the substituent of peroxyacid is higher than that of hydrogen, it tends to be a more aggressive oxidizing agent. Aside from the fact that peroxyacids are strong oxidizing agents, they are an excellent source for the generation of OH radicals because the peroxy–oxygen atom bond can be easily dissociated. This in turn makes it easy to undergo disintegration by homolytic fission [26].
The most used peroxyacid in wastewater treatment technology is peracetic acid (PAA) [17]. Among organic peroxyacids, PAA solutions are the least stable. At room temperature, 40% of PAA solutions lose 1 to 2% of PAA monthly [27]. For organic peroxyacids, the shorter the alkyl chain, the less stable they are. This is because of the higher percentage share of active oxygen in their molar mass [28]. The longer the alkyl chains of peroxyacids, the more stable they are. Given the potential of replacing the conventional oxidant in AOP techniques for organic pollutant degradation with peroxyacids, this study sought to investigate the use of carboxylic acid based hydrophobic deep eutectic solvents (HDESs)/hydrogen peroxide based system to treat phenol-contaminated wastewater. The HDESs are water immiscible deep eutectic solvents (DESs) that are capable of distinct phase separation when mixed with water. These HDES/H2O2 systems were produced in situ from the interaction of HDESs with hydrogen peroxide in the presence of ultrasound, and they were then used for the enhanced degradation of phenolic micro-pollutants in wastewater. The HDESs were synthesized combining menthol with decanoic and menthol with dodecanoic acids. Their precursors are natural and widely used in human life. Menthol is extracted from pure natural peppermint or peppermint oil. Decanoic acid is often used to make esters for perfumes and fruit flavors and as an intermediate for food-grade additives. Dodecanoic (lauric) acid is naturally present in various animal and vegetable oils and is the main component of coconut oil and palm kernel oil, and it can also be used as a food additive.
2. Materials and methods
2.1. HDES synthesis
Menthol (99% assay) was purchased from Molychem while decanoic acid (98% assay) and dodecanoic acid (99% assay) were purchased from Loba Chemie. Binary mixtures of monoterpene (menthol) and carboxylic acids (decanoic acid and dodecanoic acid) were prepared by adding the components into glass vessels in the mole ratio 1:1. The synthesis was conducted by stirring on a hotplate magnetic stirrer at 80 °C until a homogeneous liquid mixture was obtained with no visible precipitate. The solvent was then cooled to room temperature and stored in airtight sample bottles for further studies [29]. Table 1 shows the mole ratio of menthol and organic acids combined for the synthesis of the HDESs and their physical appearance.
Composition of HDESs
| HBA | HBD | Abbreviation | Mole ratio | Physical appearance |
|---|---|---|---|---|
| Menthol | Decanoic acid | MC10 | 1:1 | Colorless liquid |
| Dodecanoic acid | MC12 | 1:1 | Colorless liquid |
2.2. Degradation process
Simulated wastewater was prepared by dissolving 30 mg of analytical-grade phenol and 4-NP crystals in 1 l of distilled water. In addition, refinery wastewater was obtained from a refinery in the south-south region of Nigeria. Ferrous sulfate anhydrous weighing 3 g (98% assay) was dissolved in the contaminated (refinery and simulated) wastewater to catalyze the homolysis of the HDES–HDES/H2O2 system. The pH of the wastewater was adjusted using 0.1 M NaOH or 0.1 M H2SO4 to 3–6. Sample bottles were filled with 20 ml of contaminated wastewater, and varying volumes of the stoichiometric mixture of HDES + H2O2 were added. These samples were placed inside an ultrasonicator at a sonication speed of 40 kHz. During the sonication process, the HDES/H2O2 systems were generated in situ. The time and temperature of the degradation process were varied. After appropriate sonication-enhanced reaction, the samples were removed and left for phase separation between the HDES phase and the treated water. The water phase was taken for analysis to determine the concentrations of phenol, 4-NP, and total organic compounds (TOC).
2.3. Analysis
2.3.1. Fourier transform infrared (FTIR) for HDES
The spectrum of each sample is determined by a Cary 630 FTIR Spectrometer (Agilent Technologies). A small quantity of each sample is scooped with a spatula and placed on the spectrometer sampling surface. With the aid of an in-built interferometer, the spectrometer measures the energy transmitted to the sample. Emitted infrared radiation from the black body (furnace) hits the interferometer, where spectral encoding occurs. The resultant signal is then transmitted through the sample surface where specific energy wavelengths are absorbed. The beam finally proceeds through the detector and is passed to the processing computer for the Fourier transform of energy signals.
2.3.2. Moisture content (hydrophobicity)
Six sample bottles were filled with 10 ml of the prepared HDES, and 10 ml of distilled water was added to each of them. There was proper agitation of the mixture at the speed of 120 rpm for 30 min, and the samples were left for 24 h for phase separation. The HDES phases were then removed from the sample mixture using a syringe and set aside for moisture content analysis using a Karl Fischer Moisture Analyzer, which was operated at room temperature. The moisture content of each sample was determined by a Metrohm 756 Karl Fischer Coulometer Analyzer.
2.3.3. Phenol and 4-NP concentration
An ultraviolet–visible spectrophotometer was used to determine the initial phenol and 4-NP concentrations (before treatment) and the final concentrations (after treatment) of both the refinery and simulated effluents at 270 nm and 320 nm respectively after scanning and plotting their calibration curves. The calibration curves for phenol and 4-NP are established in the concentration range of 0–60 ppm, with an R2 value of 0.9909 for the phenol curve and 0.9964 for the 4-NP curve. The efficiency of degradation was calculated using Equation (1):
| (1) |
2.3.4. Analysis of TOC
In the determination of the TOC for both untreated and treated wastewater, the titration method of analysis was used. A sample of 4 ml was transferred into a digestion tube, and 1 ml of 0.0667 M potassium dichromate (99% assay) was added; 5 ml of concentrated sulfuric acid was added while mixing constantly. Two blank tubes were prepared (i.e., with reagents but without sample). The sample tubes and one blank tube were placed in a pre-heated block at 150 °C for 30 min and later removed for cooling down. The other blank tube was left unheated. The contents of the tube were quantitatively transferred to labeled 100 ml conical flasks, and 0.3 ml (3–4 drops) indicator solution (1.485 g o-phenanthroline monohydrate + 0.695 g ferrous ammonium sulfate hexahydrate in 100 ml of distilled water) was added. While using a magnetic stirrer to ensure good mixing, all samples and blanks were titrated with acidified ferrous ammonium sulfate solution (99% assay). The endpoint was a color change from green/violet to red. The titer values were recorded for each sample, the heated blank, and the unheated blank. The TOC in the raw and the treated refinery effluent was monitored to determine the efficiency of the degradation process.
| (2) |
3. Results
3.1. HDES characterization
The FTIR spectra of monoterpene, decanoic acid, and dodecanoic acid as well as the HDESs synthesized from their combinations were obtained to investigate and confirm the interaction of the combining components. This can be found in an earlier publication by Adeoye et al. [29].
The resulting spectra when compared with related works reflected the same kind of shifts at the OH band of the menthol and the carbonyl bands of decanoic acid and dodecanoic acid. This represents the interaction of the two components for DES formation [30, 31, 32, 33]. The hydrogen bond has been identified to be the major intermolecular interaction between terpenes and organic acids in the formation of HDES [6, 30, 34].
It is strongly advised to determine the stability of DESs that are to be applied in aqueous environments to ensure that they will not leach into the water phase and contaminate it and that no change occurs in the DES structure due to water absorption.
Therefore, the HDESs were mixed with water and agitated. Figure 1(a,b) represents images of the HDESs immediately after agitation and after 24 h. An oil-in-water emulsion-like mixture was observed immediately after agitation. A distinct phase separation was observed between the HDESs and water. The water phase was at the bottom while the HDES phase was at the top.
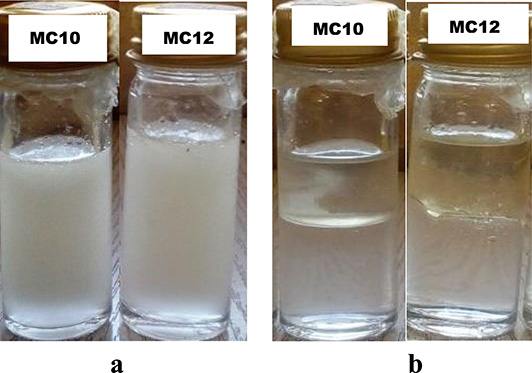
HDES in water (a) immediately after agitation and (b) 24 h after agitation.
The moisture content in each HDES was thereafter determined after its interaction with water for 24 h. The HDESs: MC10, and MC12, had moisture content of 3.54% and 2.64% respectively (Figure 2). The decrease in the moisture absorption capacity of MC10, and MC12 was a result of the increase in the alkyl chain of the organic acids from C10 to C12 which resulted in increased hydrophobicity [35].
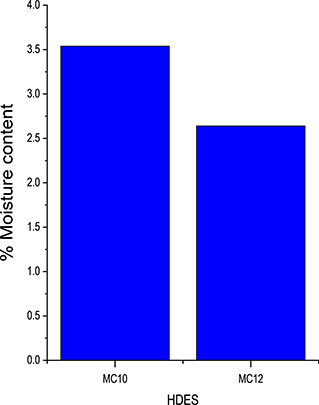
Test for hydrophobicity of HDESs.
After the synthesis and characterization of the HDESs, simulated wastewater contaminated with phenol and 4-NP was prepared and used to investigate the effects of pH, oxidant dose, temperature, and time on the ultrasonic degradation process while using the HDES/H2O2 systems.
3.2. Ultrasonic degradation of phenol and 4-NP
3.2.1. Effect of pH
The effect of pH on the ultrasonic degradation of phenol and 4-NP was investigated using MC10- and MC12-HDES/H2O2 systems as shown in Figures 3 and 4. The process was varied between pH values of 3 and 6 while keeping other conditions constant. It was observed that the best degradation efficiency for phenol was achieved at pH 4 while that for 4-NP was at pH 5. As the pH became less acidic, the efficiency of degradation kept decreasing. This is because as the pH becomes high, iron precipitates as Fe((OH)3), which in turn reduces the concentration of ferrous ions that can catalyze the homolysis of HDES/H2O2 systems to generate radicals. For Fenton processes, effective pH for the degradation of organic pollutants was found to be between 3 and 6 [36, 37, 38].
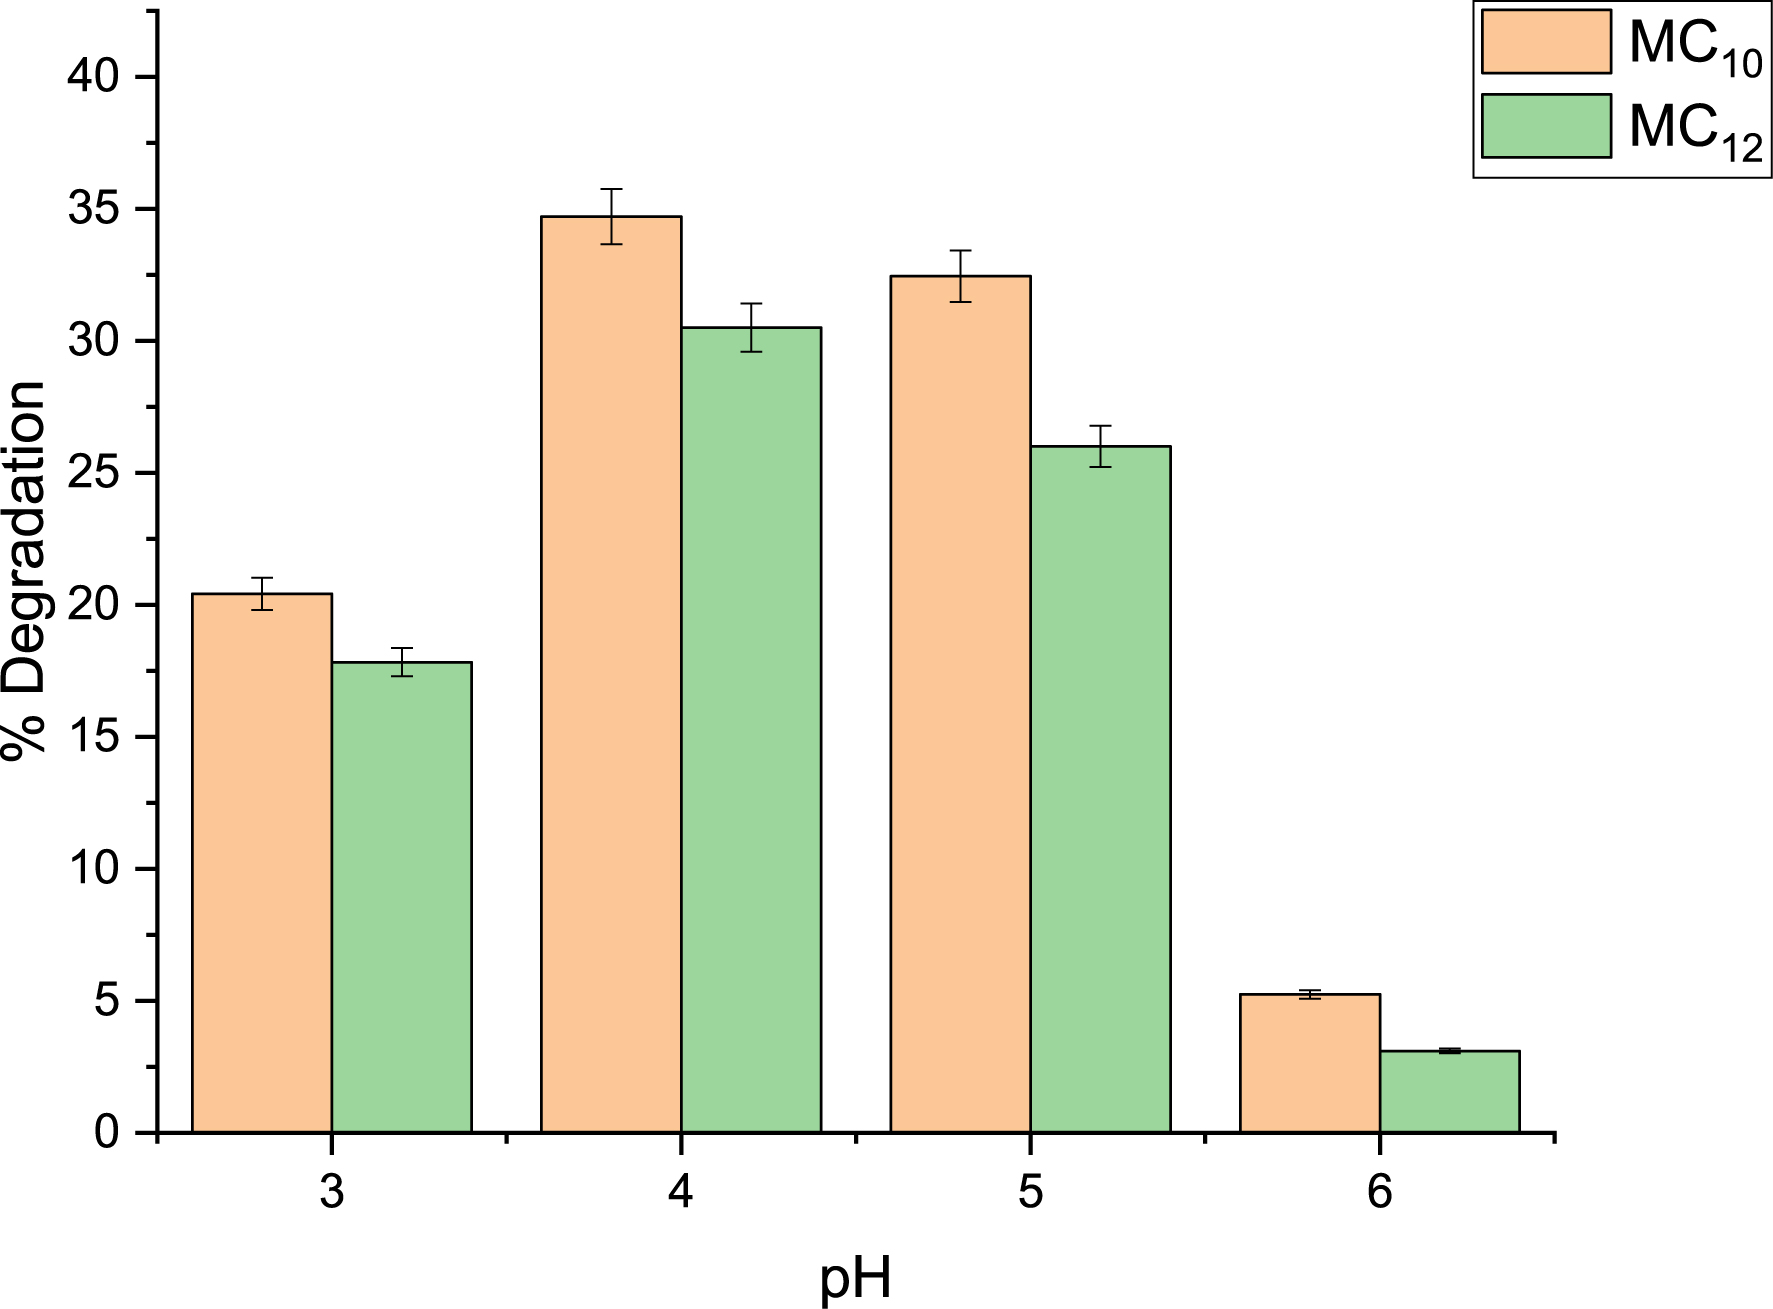
Effect of pH on phenol degradation using MC10 and MC12 HDES.
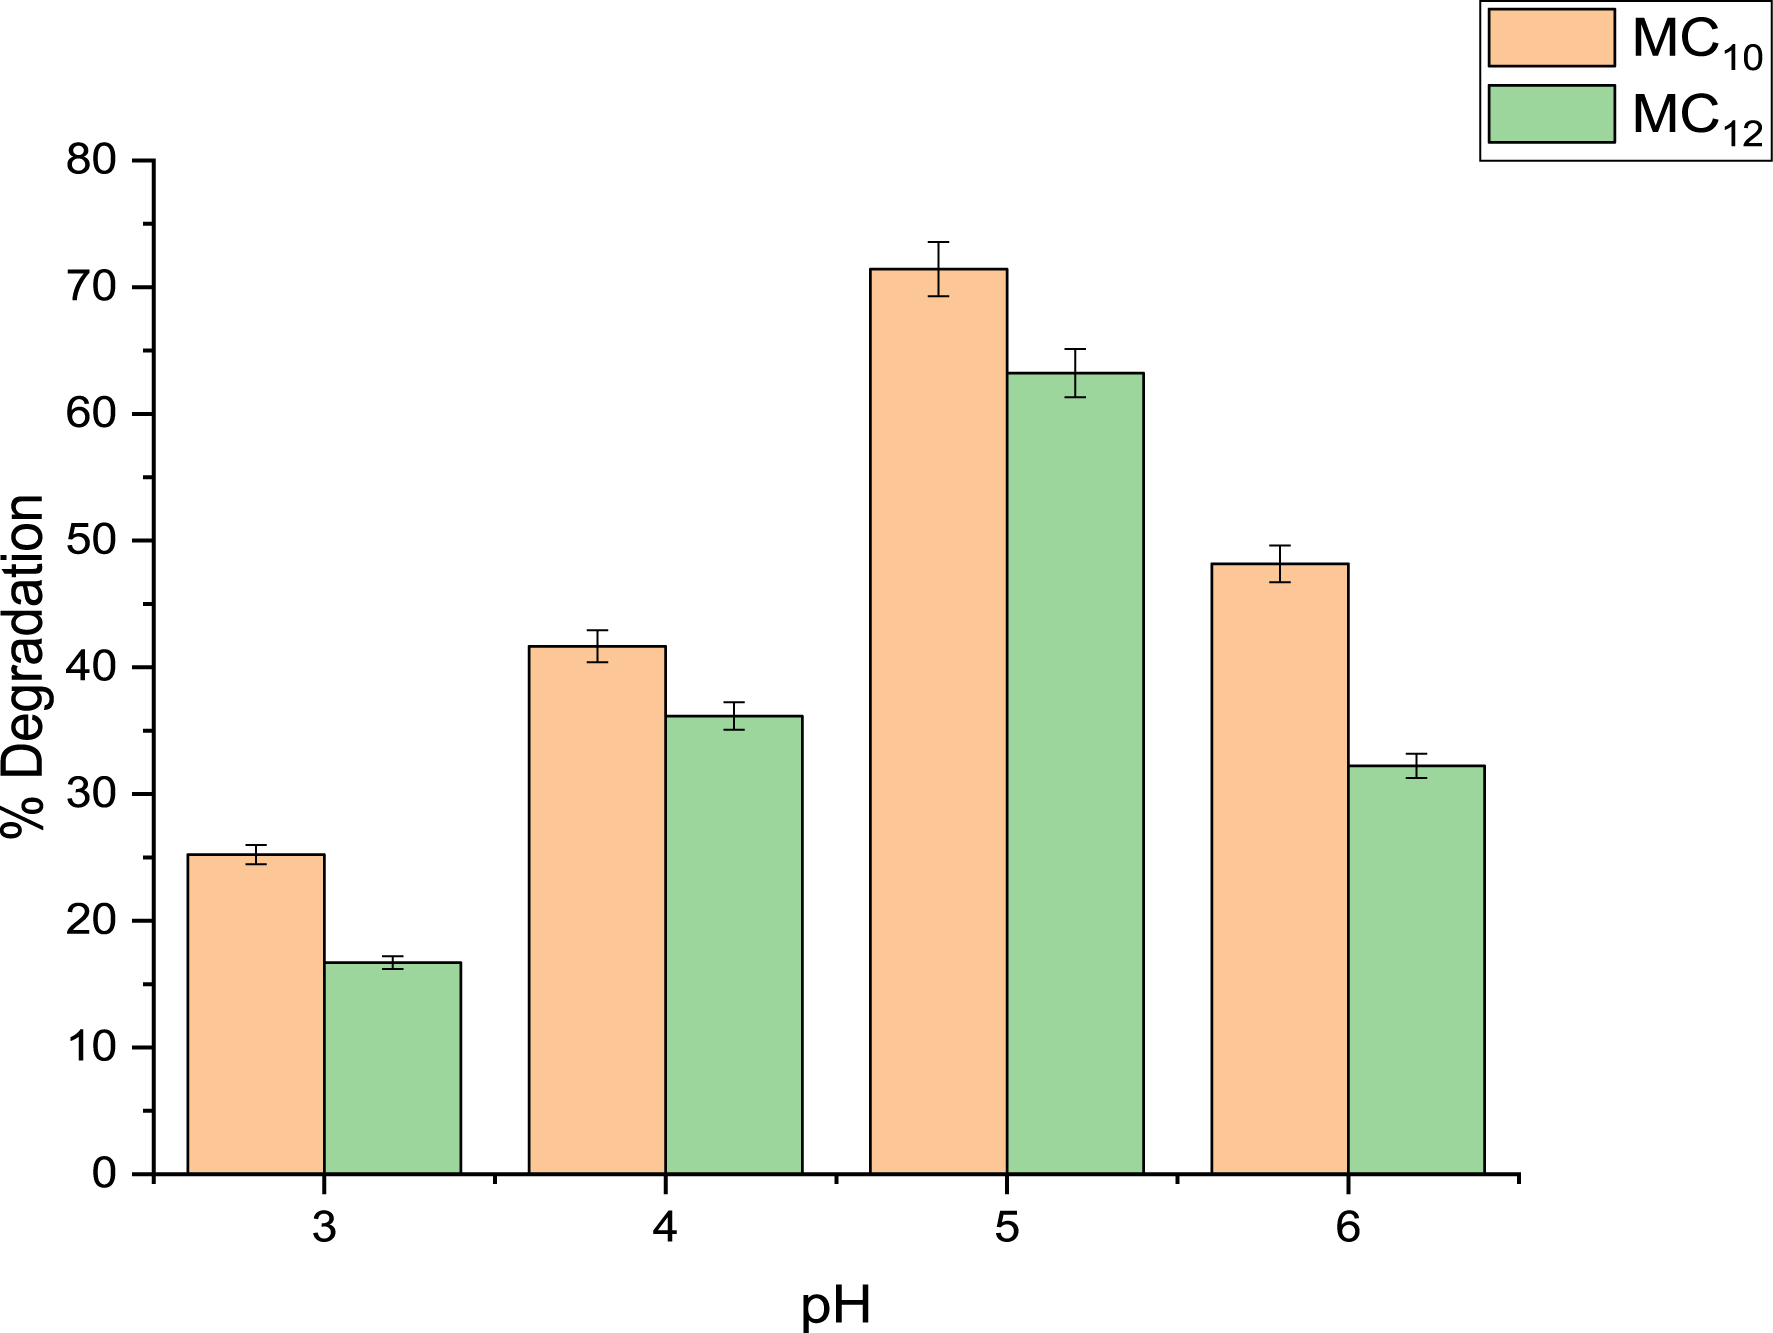
Effect of pH on 4-NP degradation using MC10 and MC12 HDES.
3.2.2. Effect of oxidant dose
The effect of oxidant dose on the degradation of phenol and 4NP was equally investigated using MC10- and MC12-HDES/H2O2 systems. The oxidant dose was varied between 5 and 20% v/v while keeping the aqueous solution at pH 4 for phenol degradation and pH 5 for 4-NP degradation. The reaction time was 75 min and the temperature was 60 °C. In Figure 5, the degradation efficiency increased with increasing oxidant dose until it peaked at 15% v/v for the MC10-HDES/H2O2 system and at 17% v/v for the MC12-HDES/H2O2 system for both phenol and 4-NP and started declining. According to Kim et al. [24], degradation increases with increase in oxidant dose. This is because an increased oxidant dose gives rise to an increase in the concentration of radicals generated for the degradation process, which results in better degradation efficiency. At a certain point, an increase in oxidant dose results in a decrease in degradation efficiency. This is attributed to the scavenging effect of the excess oxidant on the generated radicals [24].
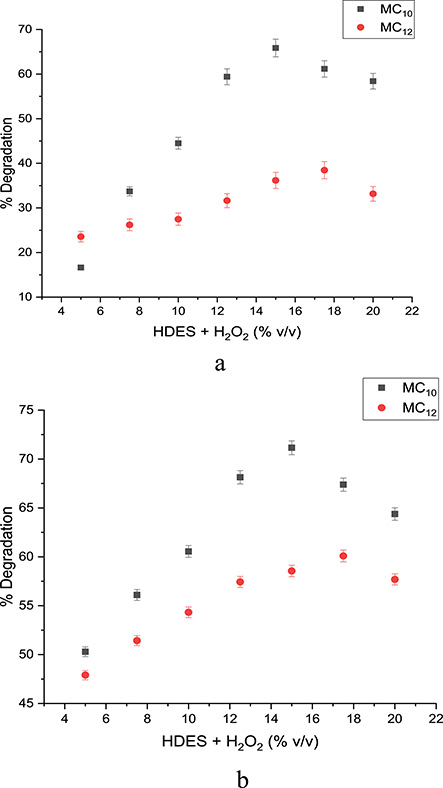
(a) Effect of oxidant on phenol degradation. (b) Effect of oxidant on 4-NP degradation.
3.2.3. Effect of temperature and time
An increase in temperature favors the decomposition of H2O2, leading to a very rapid generation of the hydroxyl radical; it also favors the decomposition of H2O2 into O2, a less reactive species. The effect of temperature was monitored between 30 and 60 °C while operating at the best pH and oxidant dose. This temperature range was chosen because the degradation of phenolic pollutants in the literature using integrated methods was operated within this range. This is to provide ample comparison of the efficacy of the process. An increase in temperature was observed to favor the increase in pollutant degradation for both HDES/H2O2 systems as shown in Figures 6 and 7 for phenol and 4-NP degradation. Ribeiro and Nunes in their review of Fenton processes for wastewater treatment stated that an increase in temperature enhances the kinetics of the process because the Fenton reaction is endothermic in nature [39]. Moreover, the effect of time was monitored between 30 and 120 min as seen in Figures 6 and 7 for both phenol and 4-NP degradation respectively. The efficiency of degradation was observed to increase throughout the duration.
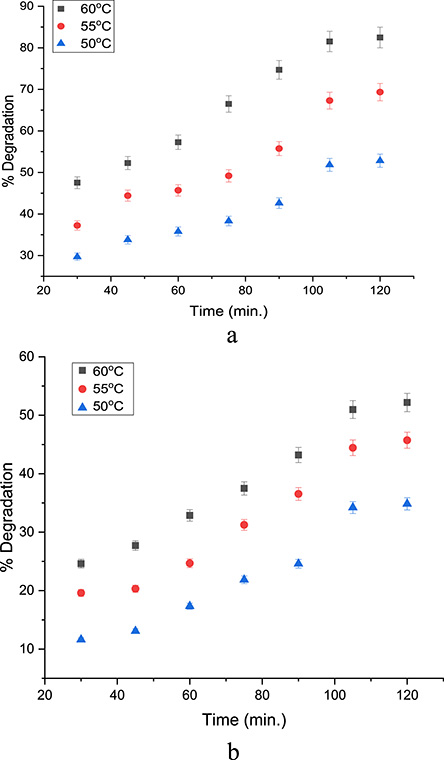
(a) Temperature–time profile for phenol degradation using MC10. (b) Temperature–time profile for phenol degradation using MC12.
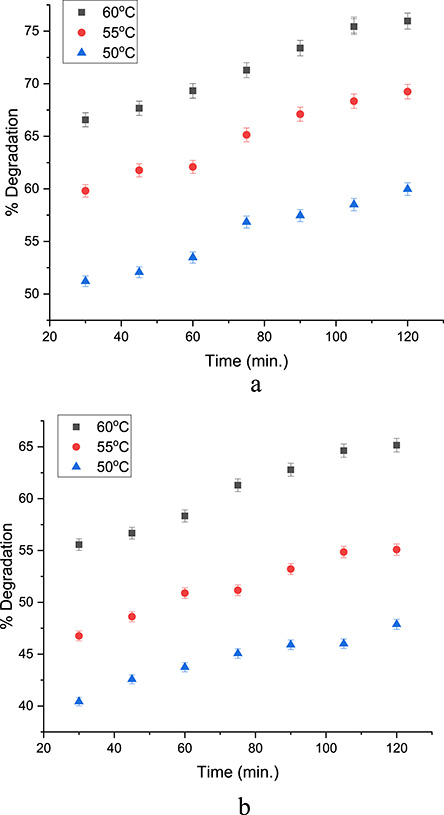
(a) Temperature–time profile for 4-NP degradation using MC10. (b) Temperature–time profile for 4-NP degradation using MC12.
3.2.4. Kinetics of degradation reaction
The kinetics of the degradation of phenol and 4-NP using HDES/H2O2 systems was modeled using first- and second-order kinetic equations while varying temperatures between 50 and 60 °C. All the reactions were conducted with the best experimentally obtained parameters. The rate constant and the regression coefficient were calculated (Table 2) by following the model equations (Equations (3) and (4)) [40]. Kinetic parameters were calculated individually for 50, 55, and 60 °C.
| (3) |
| (4) |
Kinetic parameters for first- and second-order models for the degradation reaction
| First-order kinetics | Temperature (°C) | k1 (min−1) | R2 |
|---|---|---|---|
| MC10-phenol | 50 | 0.00571 | 0.9324 |
| 55 | 0.00912 | 0.9493 | |
| 60 | 0.01443 | 0.9788 | |
| MC12-phenol | 50 | 0.00362 | 0.9679 |
| 55 | 0.00507 | 0.9771 | |
| 60 | 0.006 | 0.9791 | |
| MC10-4-NP | 50 | 0.00585 | 0.6197 |
| 55 | 0.0079 | 0.6829 | |
| 60 | 0.00964 | 0.6993 | |
| MC12-4-NP | 50 | 0.00422 | 0.6304 |
| 55 | 0.00533 | 0.6585 | |
| 60 | 0.00715 | 0.6961 |
| Second-order kinetics | Temperature (°C) | k2 (L/mg−1⋅min−1) | R2 |
|---|---|---|---|
| MC10-phenol | 50 | 3.37 × 10⁻⁴ | 0.9484 |
| 55 | 1.88 × 10⁻⁴ | 0.9192 | |
| 60 | 1.32 × 10⁻⁴ | 0.9219 | |
| MC12-phenol | 50 | 2.29 × 10⁻⁵ | 0.9488 |
| 55 | 4.56 × 10⁻⁵ | 0.9637 | |
| 60 | 5.97 × 10⁻⁵ | 0.9757 | |
| MC10-4-NP | 50 | 3.05 × 10⁻⁴ | 0.7020 |
| 55 | 4.81 × 10⁻⁴ | 0.8017 | |
| 60 | 6.96 × 10⁻⁴ | 0.8448 | |
| MC12-4-NP | 50 | 1.86 × 10⁻⁴ | 0.6860 |
| 55 | 2.56 × 10⁻⁴ | 0.7347 | |
| 60 | 4.06 × 10⁻⁴ | 0.8047 |
Two kinetic models were used to fit the experimental data for the degradation reactions at temperatures 50, 55, and 60 °C. It was observed that with every increase in temperature, the reaction rate constant also increased for the degradation of both phenol and 4-NP. This shows that an increase in temperature favors the degradation reaction, which is endothermic. For phenol degradation, the first-order model gave the best fit with the highest regression coefficient (R2) values of 0.9788 and 0.9791 for MC10- and MC12-HDES/H2O2 systems respectively, which is similar to that obtained in the literature for organic pollutant degradation [41, 42, 43]. While still considering the first-order kinetics, the rate constants for phenol degradation using the MC10-HDES/H2O2 system at higher temperatures (55 and 60 °C) were found to be about 1.5 times in magnitude when compared with reactions at lower temperatures (55 and 50 °C). Similarly, the rate constants at higher temperatures (55 and 60 °C) for phenol degradation using the MC12-HDES/H2O2 system were found to be a magnitude greater than what was obtained at lower temperatures (55 and 50 °C). For 4-NP degradation, the second-order model gave the best fit with the highest regression coefficient (R2) values of 0.8448 and 0.8047 for MC10- and MC12-HDES/H2O2 systems respectively. Sudha et al. in their work on Fenton degradation of 4-NP concluded that the second-order kinetic model gave the best fit for their experimental results [44]. For the second-order kinetics, the rate constants for 4-NP degradation using the MC10-HDES/H2O2 system at higher temperatures (55 and 60 °C) were found to be about 1.5 times higher in magnitude than at lower temperatures (55 and 50 °C). In a similar trend, the rate constants at higher temperatures (55 and 60 °C) for 4-NP degradation using the MC12-HDES/H2O2 system were found to be about 1.5 times higher in magnitude than at lower temperatures (55 and 50 °C). Moreover, the reaction rate constants for pollutant degradation using the MC10-HDES/H2O2 system were greater than when the MC12-HDES/H2O2 system was used. This could be attributed to the higher hydrophobicity of MC12. The order of a reaction reflects the sensitivity of the rate of that reaction to the change in concentration of the reactants per time. For zero-order reactions, the rate of reaction is constant; this means it is independent of the concentration of the reacting components. In first-order reactions, the rate is dependent on the concentration of only one reactant while for second-order reactions, the rate is dependent on the square of the concentration of only one reactant or the product of the concentrations of two reactants.
3.3. Refinery effluent degradation
The best process parameters obtained for the degradation of phenol and 4-NP in simulated wastewater were then used to treat refinery wastewater that was obtained from the south-south region of Nigeria. The TOC for raw refinery wastewater was analytically determined to be 0.024 g/l while that of the treated wastewater when the MC10-HDES/H2O2 system was used was 0.0027 g/l; when the MC12-HDES/H2O2 system was used, the TOC value was 0.0079 g/l. The efficiency of pollutant degradation was monitored using a percentage reduction in the TOC present in the raw and treated refinery effluent as calculated by Equation (1). The TOC reduction when the MC10-HDES/H2O2 system was used was 88.75% while when the MC12-HDES/H2O2 system was used, the TOC reduction was 67.08%. The MC10-HDES/H2O2 system was observed to be more efficient in pollutant degradation than the MC12-HDES/H2O2 system. As stated earlier, this could be a result of the higher hydrophobicity of MC12, which limited its interaction with pollutants in the water phase. The results for each HDES/H2O2 system are presented in Table 3.
TOC analysis for raw and treated refinery effluents
| Wastewater | TOC (g/l) | % TOC reduction |
|---|---|---|
| Raw refinery | 0.0240 | - |
| MC10 treated | 0.0027 | 88.75 |
| MC12 treated | 0.0079 | 67.08 |
3.4. Reusability
The recovery and reusability of materials in engineering processes are of the utmost importance because they impact the economics of such processes. The recovered HDESs were used for the generation of HDES/H2O2 systems and were recontacted with raw refinery wastewater for three runs. The percentage of TOC load was observed to reduce from 88.75 to 33.33% for the MC10-HDES/H2O2 system while for the MC12-HDES/H2O2 system, it reduced from 67.08 to 11.25% for the three runs. This decrease could be a result of the contamination of the HDES phase with pollutants during the repeated degradation process. Yet again, the MC10-HDES/H2O2 system was observed to be more efficient in pollutant degradation than the MC12-HDES/H2O2 system all through the recycle runs, and this could be attributed to the higher hydrophobicity of MC12. Figure 8 shows the graph for the reusability of the HDES/H2O2 systems, which reflected a consistent decline in TOC reduction when it was reused.
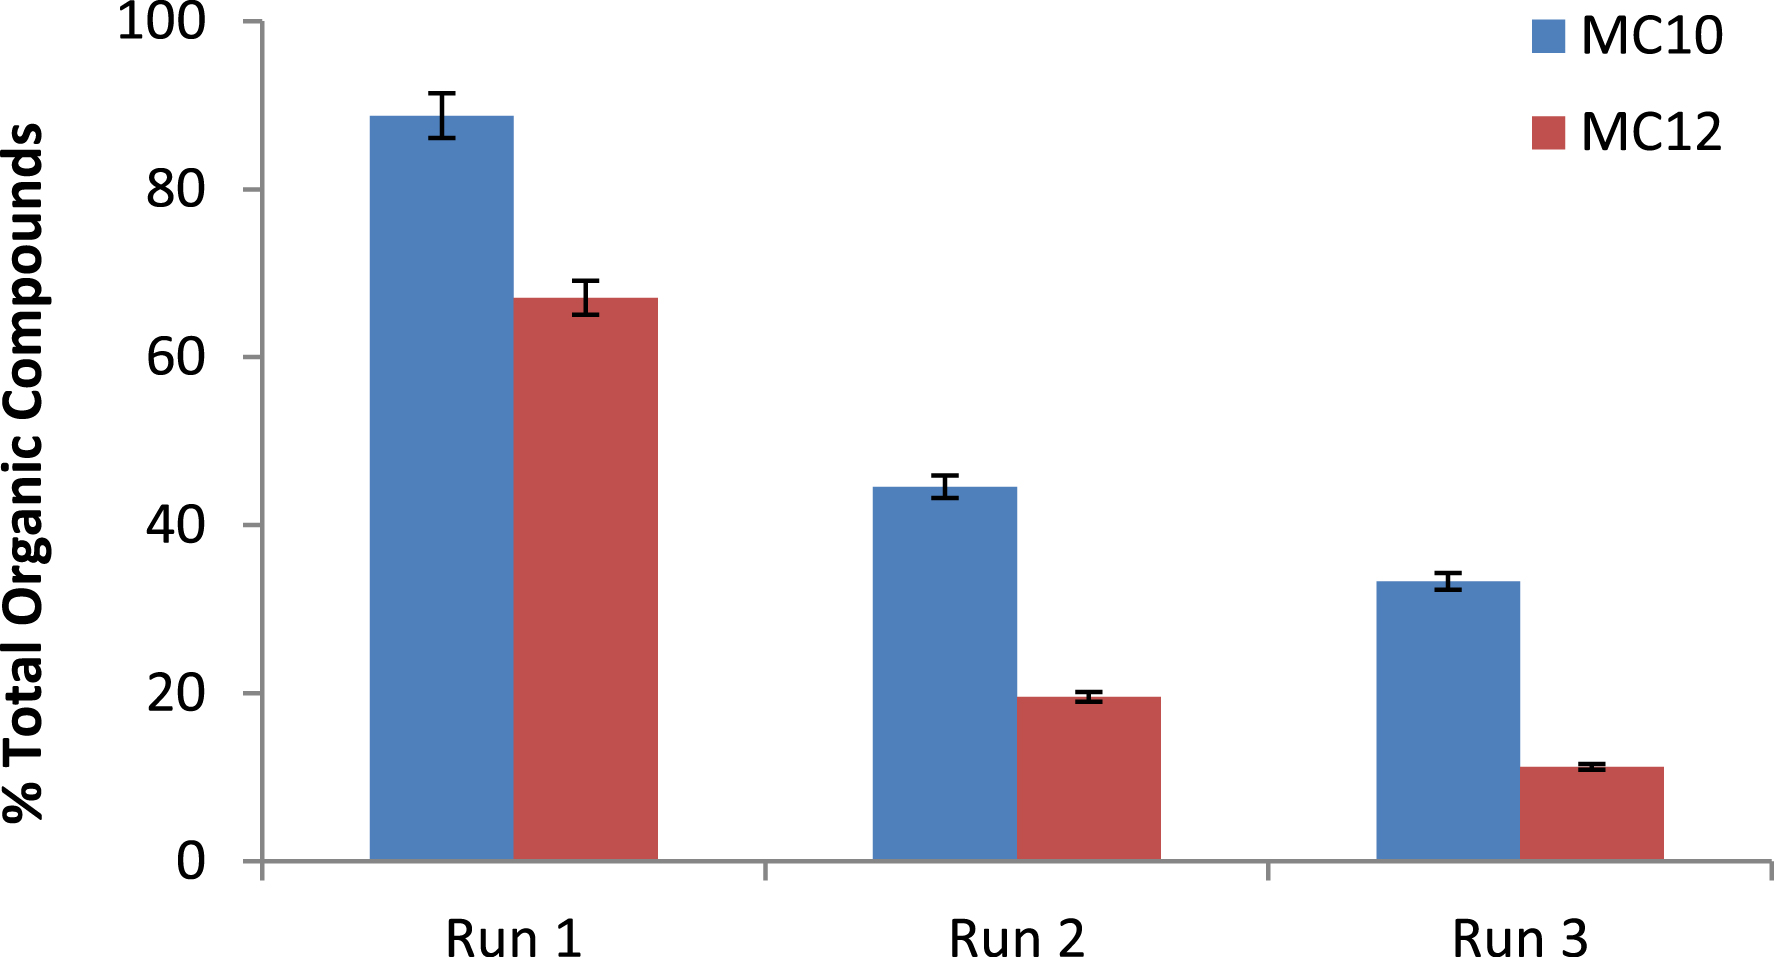
Reusability of HDES for the degradation of pollutants in refinery effluent.
4. Conclusion
In this study, two menthol-based HDESs from long-chain organic acids were successfully prepared at a molar ratio of 1:1, and both were liquids at room temperature. The FTIR spectra of the HDESs revealed remarkable shifts in the O–H stretching bands and C=O stretching bands of the HDESs when compared with their precursors. The changes in the O–H stretching bands and C=O stretching bands resulted from the intermolecular hydrogen bond formed between the starting materials to produce the HDESs.
Both HDESs were then used in synergy with H2O2 to generate HDES/H2O2 systems, which were used to degrade phenol and 4-NP from simulated wastewater. Process variables were monitored, and the best degradation efficiency for the simulated effluent was obtained. A pH value of 4 gave the best result for phenol degradation while pH 5 gave the best result for 4-NP. An oxidant dose of 15% v/v and temperature 60 °C yielded 76% and 94.46% for phenol and 4-NP respectively when the the MC10-HDES/H2O2 system was used. Furthermore, an oxidant dose of 17% v/v and temperature 60 °C gave the best degradation efficiency of 58.98% and 61.08% for phenol and 4-NP when the MC12-HDES/H2O2 system was used. The kinetics of the degradation reaction were studied, and the experimental data obtained were fitted into first- and second-order kinetic models. The first-order kinetic model gave the best fit for phenol degradation when using both MC10-HDES/H2O2 and MC12-HDES/H2O2 systems with regression coefficients of 0.9788 and 0.9791 respectively while the second-order kinetic model gave the best fit for 4-NP degradation when using both HDES/H2O2 systems with regression coefficients of 0.8448 and 0.8047 respectively, all at a temperature of 60 °C. These best process parameters were then used to treat refinery wastewater in which the efficiency of TOC removal was 88.75% for MC10 and 67.08% for MC12. The recyclability of the spent HDES/H2O2 systems was also investigated. For MC10, the percentage reduction of TOC from the wastewater was from 88.75 to 33.33% while for MC12, it reduced from 67.08 to 11.25% for three runs.
Nomenclature
| DES | deep eutectic solvent |
| HDES | hydrophobic deep eutectic solvent |
| MC10 | menthol–decanoic acid |
| MC12 | menthol–dodecanoic acid |
| 4-NP | para-nitrophenol |
| TOC | total organic compounds |
| FTIR | Fourier transform infrared |
| AOPs | advanced oxidation processes |
| I-AOPs | integrated advanced oxidation processes |
| PAA | peracetic acid |
| HBD | hydrogen bond donor |
| HBA | hydrogen bond acceptor |
Declaration of interests
The authors do not work for, advise, own shares in, or receive funds from any organization that could benefit from this article, and have declared no affiliations other than their research organizations.
Funding
This project was partly funded by the National Research Institute for Chemical Technology under the project number FGN/AB2021/ERGP30122610.
Acknowledgments
The authors express their gratitude to the Department of Chemical Engineering (Ahmadu Bello University), National Research Institute for Chemical Technology (NARICT), and Nigerian Institute of Leather and Science Technology (NILEST) for the support rendered in carrying out this research.