

 CC-BY 4.0
1. Introduction
Cationic or basic dyes are extensively used in textile industry processes [1, 2]. The presence of dyes in water, even at very low concentrations, makes them unfit for human consumption [1]. The presence of small amounts of dyes in industrial waters is highly visible, due to their high stability and solubility in aqueous solutions [3]. Moreover, dyes as well as their degradation products could be toxic and carcinogenic, leading to serious hazards to aquatic organisms [4, 5]. As for basic dyes, they are considered to be among the most toxic molecules due to the presence of metals in their structures [1, 6]. The wastewater containing dye molecules must, then, be treated before the discharge in the natural medium in order to overcome their negative environmental impacts [7]. Industrial wastewater treatment involves various methods: advanced oxidation processes, precipitation/coagulation, and biological treatment [8, 9]. Such processes have some drawbacks, including high-energy requirement, consumption of chemicals, high operational cost, and the possible generation of toxic materials [10].
Nowadays, adsorption is emerging as an efficient method for dye removal from wastewaters [7, 11, 12]. Furthermore, adsorbents derived from agricultural crop residues, industrial by-products, etc. have received a particular attention due to their low cost [12, 13, 14, 15, 16]. Different types of modified and raw biosorbents such as rice husk, peat, pinus Sylvestris, red mud, sugarcane bagasse, etc. have been used for the removal of cationic dyes from aqueous solutions [9, 17, 18, 19, 20, 21]. Date pits, which are agro-industrial solid wastes largely produced in MENA countries, are promising candidates as effective adsorbents [4, 22]. Indeed, date stones are mainly composed of cellulose, hemicellulose, and lignin. These components are rich in hydroxyl and carbonyl groups which are implied during the dye adsorption process [4].
It is important to study the adsorption of dyes in a multi-component solution since industrial effluents are loaded with a mixture of numerous and different dyes. Indeed, at laboratory scale, few studies had focused on multi-solute system adsorption due to the complexity of wastewater composition and the possible interferences and competition between molecules [9, 23]. In fact, Debnath et al. [23] studied the adsorption of safranine O (SO), brilliant green (BG), and methylene blue (MB) in a ternary dye system where the maximum adsorption capacities were estimated to be 67.9, 78.6, and 61.3 mg/g for SO, BG, and MB, respectively. Moreover, Mavinkattimath et al. [9] studied the adsorption of Remazol brilliant blue (RBB) and Disperse orange (DO) dyes by red mud on mixed dye system. The adsorption capacities were found to be 85 and 37 mg/g for DO and RBB, respectively. The presence of several dyes in a solution may mutually enhance or inhibit the adsorbent performance [9, 24]. In general, a mixture of different adsorbates exhibits three possible behaviors: synergism (the effect of the mixture is more important than the individual adsorbates in the blend), antagonism (the effect of the individual solutes is greater than in the mix), or non-interaction [9, 25].
During adsorption studies, kinetics, equilibrium, and thermodynamic data are necessary for the analysis and design of complex adsorption systems [9, 26]. Various competitive multi-component models have been reported to describe the interaction, ranging from relatively simple models related only to individual parameters (non-modified models) to more complex ones with correction factors (modified models) [9].
As for date pits, there is presumably a lack of study on adsorption of cationic dyes which may be present simultaneously in a mixture solution. Thus, this research paper aims to investigate the sorption capacity of date pits in a bi-component system upon the contact with a mixture solution containing BR2 and BV3. The simultaneous adsorption is considered to assess the performance of date pits in a complex medium and to be near the conditions of real colored wastewaters.
2. Materials and methods
2.1. Preparation of dye solution mixture
The cationic dyes studied in this work, basic red 2 (BR2) known as safranin O and basic violet 3 (BV3) named also crystal violet, were provided by Sigma–Aldrich, USA. Their main chemical characteristics are summarized in Table 1. The stock solutions were prepared by dissolving 1 g of each dye powder in a volume of 1 L of distilled water, and were then diluted to get the desired concentration. Hydrochloric acid (HCl) and sodium hydroxide (NaOH) were used to adjust the pH solutions to the optimum values of 7.28 and 7.7, respectively, for BV3 and BR2 allowing the highest removal efficiency [27]. These solutions were then mixed at one volumetric ratio 1:1 to obtain a bi-component dye solution.
BR2 and BV3 chemical properties
| Characteristics | Basic red 2 (BR2) | Basic violet 3 (BV3) |
|---|---|---|
| Structural formula | C20H19N4Cl | C25H30N3Cl |
| Dye category | Azine | Triarylmethane |
| Color Index (CI) | 50,240 | 42,555 |
| Wavelength (nm) | 518 | 584 |
| Molecular weight (g/mol) | 353 | 407 |
| Solubility in water at 25 °C (g⋅L−1) | 50 | 16 |
2.2. Preparation of date pit particles
Date pits were provided by a local industry of date transformation located in the city of Beni Khalled (North east of Tunisia). These wastes were washed, placed in an oven at 40 °C for 24 h, grounded and sieved to 125 −−250 μm size, and finally stored in a hermetically sealed container for later use in the adsorption experiments. The principal physicochemical properties of date stone particles were reported in our previous studies [4, 27]. In fact, the average particle diameter and the pH at zero charge point (pHpzc) were found to be equal to 187.5 μm and 6.8, respectively. Scanning electron microscopy (SEM) was used to study the surface morphology and structure of date pit particles. A rough surface with the presence of macropores was revealed. The amorphous nature of date stone powder was revealed by X-Ray Diffraction (XRD) analysis. Moreover, according to Fourier Transform Infrared (FTIR) spectroscopy analysis, many bands were found ranging from 4000 to 400 cm−1. In fact, a broad band of the O–H stretching vibration appears at 3396 cm−1 which corresponds to hydroxyl groups and two adjacent bands were found at 2922 and 2852 cm−1 and assigned to C–H stretching of aldehyde molecules. Moreover, a band of C=O stretching vibration located at 1745 cm−1 was attributed to carbonyl groups. Carbonyl and hydroxyl groups are the main functional groups involved in the adsorption of BR2 and BV3 dyes from aqueous solutions [4, 27].
2.3. Batch adsorption experiments
The adsorption measurements for binary systems were carried out by mixing 100 mg of date pit particles with 100 mL of BR2/BV3 mixture dye solution at a pH of 7.5. The samples of the reaction mixtures were put in a conical pyrex glass vessel and were agitated in batch experiments at a constant temperature of 35 °C using a horizontal thermostatic shaker at a speed of 125 rpm. After the stirring time, the liquid phase was separated from the adsorbent particles by a laboratory centrifuge type NÜVE® NF400 at a speed of 4000 rpm for 15 min. The residual concentrations were measured by using an ultraviolet-visible spectrometer at wavelengths (𝜆) of 518 and 584 nm for BR2 and BV3, respectively.
To investigate the kinetic, thermodynamic, and equilibrium uptake of BR2 and BV3 by date pits in the bi-component system, different experiments were carried out in which the contact time, the reaction temperature, and the initial concentration of the dye mixture were varied, respectively (Table 2).
Experimental conditions used for the kinetic, equilibrium, and thermodynamic studies in binary system solutions
| Kinetic | Equilibrium | Thermodynamic | |
|---|---|---|---|
| Initial dye concentration mixture (mg/L) | 60 | 10–400 | 60 |
| Contact time (min) | 5–240 | 120 | 120 |
| Temperature (°C) | 35 | 35 | 15–50 |
The quantity of each adsorbed dye (qt at time t and qe at equilibrium) as well as the percentage adsorption (%) were calculated according to (1) to (4):
| (1) |
| (2) |
| (3) |
| (4) |
The total adsorption capacity in the mixture solution was also calculated, using (5):
| (5) |
The extent of the competition between the two dyes was assessed by the competition factor , the expression of which is given by (6):
| (6) |
This is an important parameter allowing to reveal the most affected component in the simultaneous adsorption system [28, 29, 30]:
- CF > 1: Adsorption is enhanced by the presence of other molecules (positive competition)
- CF < 1: Adsorption is reduced in the presence of other molecules (negative competition)
- CF = 1: Adsorption is kept constant in the presence of other molecules (no competition).
2.4. Analytical procedure
Different concentrations of mixture solutions (BR2 + BV3) were prepared and the absorbance (optical density) of each dye in the mixture was measured at the same two wavelengths. The absorbance coefficients (also known by calibration constants) of each dye were obtained by plotting the absorbance against the dye concentration for each dye at each wavelength. The slope of the four linear regression lines gives the value of the absorbance coefficient for one dye at its wavelength of maximum absorption. These values are then used to calculate the dye concentrations in binary mixtures according to the following equations:
| (7) |
| (8) |
2.5. Theoretical approach
2.5.1. Kinetic modeling
The simultaneous adsorption kinetics of BR2 and BV3 was fitted to several models as pseudo-first-order [31], pseudo-second-order [32], Elovich [33], and Brouers–Sotolongo models [34, 35] (Table 3).
Kinetic model equations
| Model | Equation |
|---|---|
| Pseudo-first-order model | qt = qe[Exp(lnqe − k1 t)] |
| Pseudo-second-order model | |
| Elovich model | |
| Brouers–Sotolongo model | |
The kinetic parameters gotten from the different theoretical models for the biosorption of BR2 and BV3 in the two-dye-component system were determined by non-linear fitting procedures using Excel (Microsoft) as a data-solver software. The suitability of kinetic models for describing the binary adsorption process was assessed by different error functions (see Section 2.6).
To determine whether the diffusion occurs through the pores of the adsorbent (pore flow diffusion) or across a boundary layer formed on the adsorbent (film diffusion), two diffusion kinetic models were used: Boyd’s model, which determines if the main resistance to mass transfer is in the thin film (boundary layer) surrounding the adsorbent particle [36], while Webber’s model highlights the extent of the resistance to diffusion inside the pores [37].
Boyd’s equation allows to determine the film mass transfer constant (Kf) according to the following equation [36]:
| (9) |
The F value can be determined by the following equation
| (10) |
Based on the range of F value, Bt can be determined as follows:
| (11) |
| (12) |
The coefficients of film diffusion were estimated according to the following equation:
| (13) |
To identify the predominance of external intraparticle diffusion against surface film diffusion for both dyes in the binary adsorption system, the Biot numbers were calculated according to (14) [38].
| (14) |
Different intervals of Biot number can be distinguished:
- When, Bi≪1, film diffusion is the controlling step
- When Bi ≫ 100, intraparticle diffusion is the limiting phenomenon
- When 1 < Bi < 100, film and intraparticle diffusion are the limiting steps.
2.5.2. Equilibrium modeling
Equilibrium during BR2 and BV3 simultaneous adsorption was modeled using eight isotherms including non-modified and modified Langmuir [17], Jain and Snoeyink (J–S) modified Langmuir [24], P-factor Langmuir [17, 39], extended Freundlich [1, 40], SRS model [41, 42], and non-modified and modified Redlich–Peterson [43] (Table 4). The predictive multi-component adsorption isotherms were fed with mono-component parameters of the corresponding models due to the difficulty to predict multi-component equilibrium data and to the possible competitive effects [25]. The parameters of the investigated models were estimated following non-linear fitting procedures as indicated earlier. The optimum isotherm parameters were set, after calculating the error functions presented in Section 2.6.
Equilibrium models used for BR2 and BV3 adsorption in bi-component systems
| Model | Equation |
|---|---|
| Non-modified Langmuir | |
| Modified Langmuir | |
| J–S Modified Langmuir | |
| P-factor Langmuir | |
| Extended Freundlich | |
| Sheindorf–Rebuhn–Sheintuch (SRS) model | |
| Non-modified Redlich–Peterson | |
| Modified Redlich–Peterson | |
2.5.3. Thermodynamic study
In order to highlight the effect of medium complexity on the thermodynamic parameters and especially on 𝛥H° and 𝛥S°, the following equations were used [44]:
| (15) |
| (16) |
2.6. Error functions
Different error functions are usually used to test the goodness of equilibrium and kinetic model parameters [45]. Table 5 lists the ones applied in this paper: the sum of the squares of the errors (SSE) [46], the hybrid fractional error function (HYBRID) [47], Marquardt’s percent standard deviation (MPSD) [48], and the correlation coefficient (R2) [49]. Models can be considered in good agreement with experimental data when R2 is close to unity and when SSE, Hybrid, and MPSD values are as low as possible [50].
Applied error functions
| Error function | Equation |
|---|---|
| Sum of squares of the errors (SSE) | |
| Hybrid fractional error function (HYBRID) | |
| Marquardt’s percent standard deviation (MPSD) | |
| Correlation coefficient (R2) | |
3. Results and discussion
3.1. Kinetic study and modeling
The experimental adsorption capacities of BR2 and BV3 in the binary system as a function of time are illustrated in Figure 1. For comparison reasons, the adsorption kinetics of each single-dyed solution is also presented; the initial concentration of this latter is the same as that in the mixture solution.
Kinetic uptake of BR2 and BV3 in single-dye and two-dye solutions.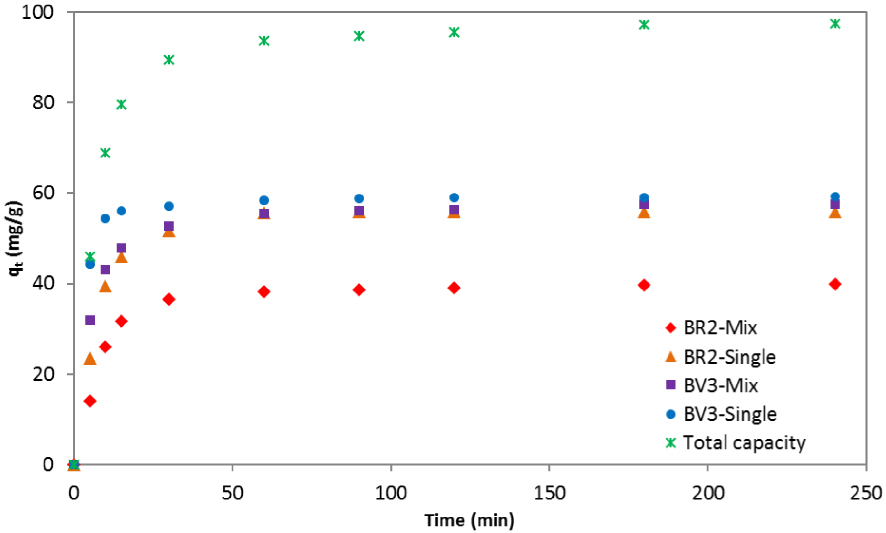
As it can be seen in Figure 1, the initial adsorption of BR2 and BV3 onto the date pits was faster in the one-dye component than in the two-dye component systems. Thus, the adsorption kinetics of the two dyes affect each other but at different degrees. Indeed, the reduction of adsorption capacity was more important for BR2 than for BV3. In fact, at the beginning (t < 30 min), the difference between the uptake capacity of both dyes in single and binary systems could not be considered as negligible. However, at the final stage (t > 60 min), when equilibrium was almost reached, the qt of BV3 was almost the same in the two cases (single and mixture solutions). These findings indicate that BV3 was not strongly affected by the presence of BR2, but the opposite was true.
The total adsorption capacity increased in contact with dye mixtures; its maximum was found to be equal to 97.49 mg/g, which is higher than in both the cases of BR2 and BV3 individual solutions. A possible explanation is that more than one dye in solution has increased the affinity of the date pits surface, either by a reorientation of the adsorbed molecules or through an alteration of the overall charge within the system [51].
The removal percentage was also determined (Figure 2). This was higher in one-dye solutions than in two-dyes’ one. Besides, the reduction in intensity depended on the dye: only 66.58% of BR2 was removed in binary system versus 93.3% in mono system while the reduction was less significant for BV3 (from 98.85 to 95.90%). At the same time, the average adsorption percent of both dyes in the mixture solutions was found to be 81.24%. As highlighted earlier, this result can be explained by the antagonist effect of BV3 on the uptake of BR2. However, the former dye was not highly influenced by the presence of BR2.
Removal percentage of BR2 and BV3 at equilibrium in mono-dye and bi-dye solutions.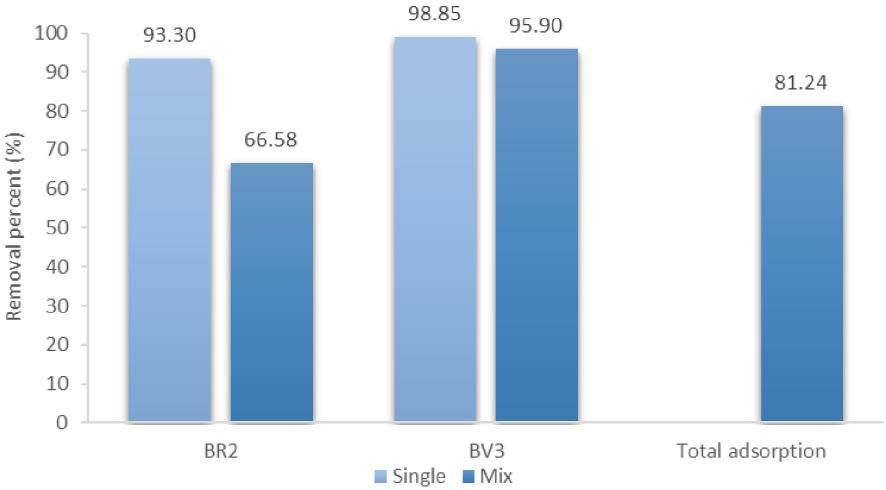
In order to assess the extent of competition between BR2 and BV3, competition factors were calculated for a different time t. According to Figure 3, the competition factor varies during the adsorption process: in the first 30 min, the competition factor for both dyes increased exponentially with time. This result may be explained by the availability of adsorption sites in the date pit particles at the beginning of the adsorption process. Then, sites became saturated and the CF became almost constant (0.97 for BV3 and 0.71 for BR2). These values indicate that BR2 was relatively highly affected (0.71 < 1) by the existence of the BV3 in the same solution while the BV3 dye was almost unaffected (0.97 ≈ 1) by the BR2. One can therefore conclude two different competition mechanisms: negative competition for BR2 and almost no competition for BV3.
Competition factor variation as a function of time for BR2 and BV3 in a binary system.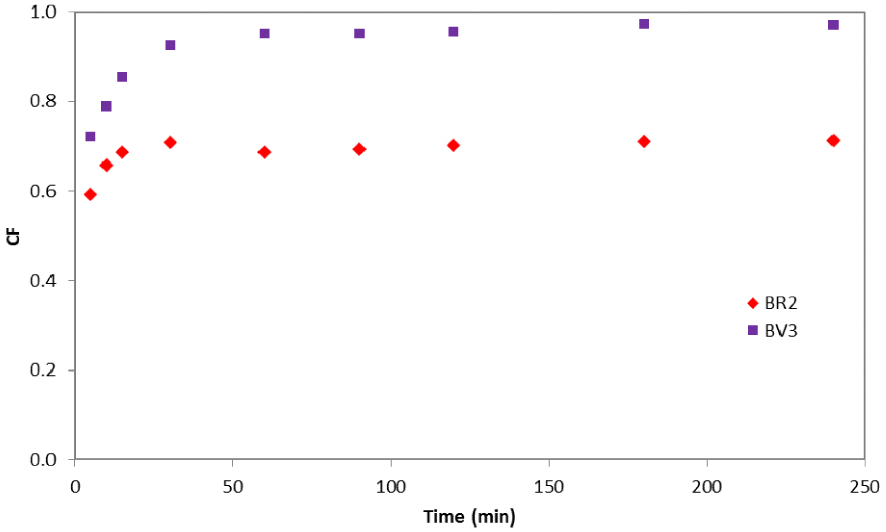
A similar trend was reported by Issa et al. [29] when they investigated the kinetic biosorption of Allura Red (AR) and Sunset Yellow (SY) by activated pine wood. Authors reported that SY (CF = 0.76) dye manifested stable performance while AR (CF = 0.69) negatively competed with the other dye molecules. A reasonable explanation was attributed to the differences in the dyes’ properties (solubility, molecular weight) as well as their affinity for adsorption sites.
Kinetics modeling
Table 6 gives the kinetic parameters extracted from different models applied to the biosorption of our two dyes on date stones in mixture solutions. Experimental adsorption data showed a poor fit for the Elovich model where R2 exhibited the lowest values, and SSE, Hybrid, and MPSD exhibited the highest values for both dyes. This finding indicates that the chemisorption is not the mechanism that may explain the dyes’ uptake and that the desorption reaction of dyes cannot be neglected in this system [4].
Parameters of kinetic models for the adsorption of BR2 and BV3 on date stones on mixture solution
| Model | Parameter | Value | SSE | HYBRID | MPSD | R2 | |
|---|---|---|---|---|---|---|---|
| BR2 | qe,exp (mg∕g) | 40.0 | |||||
| Pseudo-first order | K1 (min−1) | 0.103 | 7.029 | 0.328 | 0.018 | 0.988 | |
| qe (mg∕g) | 39.131 | ||||||
| Pseudo-second order | K2 (mg∕g⋅min) | 0.004 | 30.555 | 79.961 | 3.373 | 0.989 | |
| qe (mg∕g) | 41.994 | ||||||
| Elovich | 𝛼 (mg∕g⋅min) | 45.67 | 120.444 | 5.615 | 0.319 | 0.802 | |
| 𝛽 (g∕mg) | 0.17 | ||||||
| Brouers–Sotolongo | n | 2.665 | 0.558 | 0.015 | 0.0004 | 0.999 | |
| 𝜏 (min) | 6.136 | ||||||
| 𝛾 | 2.242 | ||||||
| qe (mg∕g) | 39.818 | ||||||
| BV3 | qe,exp (mg∕g) | 57.6 | |||||
| Pseudo-first order | K1 (min−1) | 0.151 | 22.136 | 0.488 | 0.011 | 0.967 | |
| qe (mg∕g) | 55.888 | ||||||
| Pseudo-second order | K2 (mg∕g⋅min) | 0.004 | 4.305 | 12.149 | 0.339 | 0.993 | |
| qe (mg∕g) | 58.810 | ||||||
| Elovich | 𝛼 (mg∕g⋅min) | 781.02 | 90.169 | 2.1711 | 0.0558 | 0.849 | |
| 𝛽 (g∕mg) | 0.17 | ||||||
| Brouers–Sotolongo | n | 9.392 | 0.6839 | 0.0139 | 0.0003 | 0.999 | |
| 𝜏 (min) | 2.622 | ||||||
| 𝛾 | 6.859 | ||||||
| qe (mg∕g) | 58.756 | ||||||
At the same time, the calculated values of R2, SSE, Hybrid, and MPSD indicated that the sorption of the two dyes from mixture solutions was better described by the pseudo-second order kinetics than by the pseudo-first order kinetics especially for BV3, for which R2 is equal to 0.993 with the former model while it is equal to 0.967 with the latter model.
But, among the four investigated models, the Brouers–Sotolongo model showed the best match, based on all calculated error functions, for both cationic dyes in simultaneous adsorption systems.
This finding is strengthened by the predicted values of adsorption capacity (39.8 mg/g for BR2 and 58.7 mg/g for BV3) according to Brouers–Sotolongo model which were very close to the experimental qt values (40.0 and 57.6 mg/g).
To visualize the different applied models during the whole process, the theoretical plots of kinetic data were displayed in Figure 4. As expected, Brouers–Sotolongo models follow perfectly the experimental uptake capacity upon all the studied range time, contrarily to Elovich and order-based-reaction models for both dyes.
Experimental and fitted kinetic curves describing the adsorption of BR2 (A) and BV3 (B) by date pits from binary solution.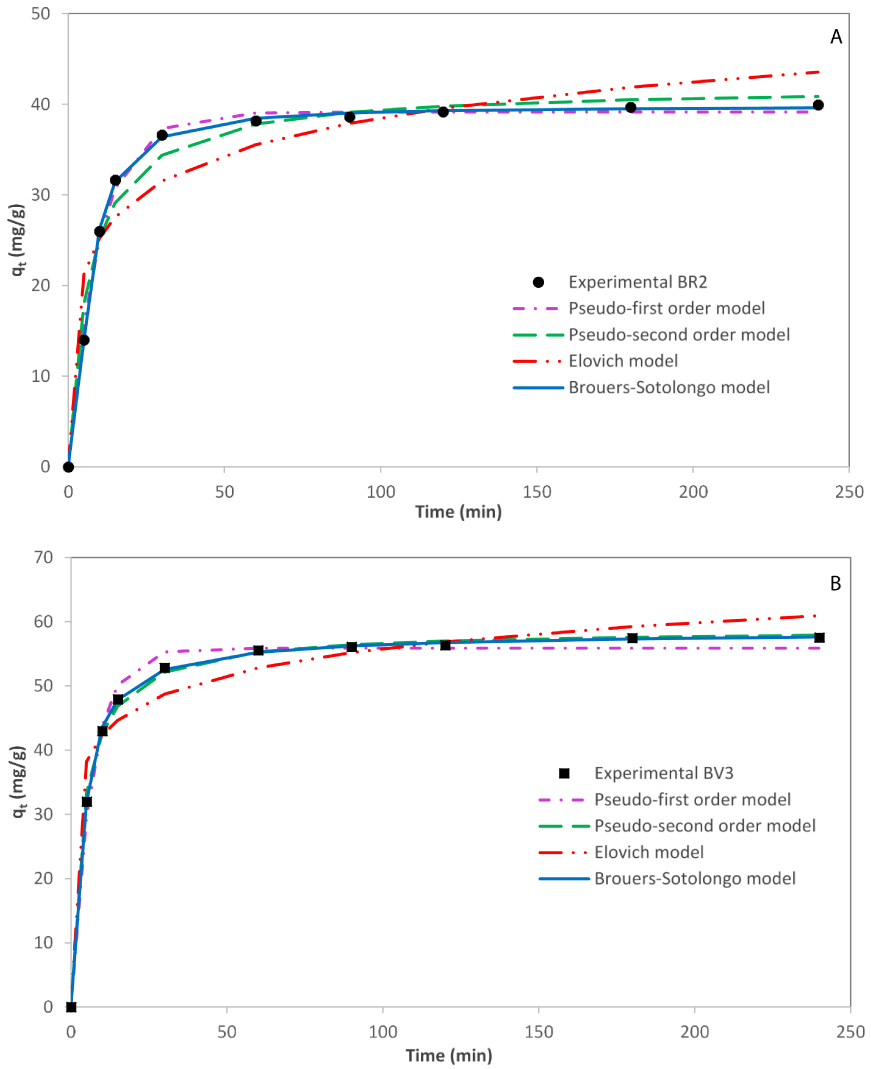
Mechanistic study (mass transfer)
Boyd’s and Webber’s kinetic models were applied to determine the main resistance to mass transfer. The values of Bt were calculated as indicated earlier and then plotted against t (Figure not shown). The obtained graph shows a linear trend-line not passing through the origin and the slope is the mass transfer parameter Kf [52].
Mass transfer parameter (Kf) and coefficient of film diffusion (Df) values obtained in mixture solutions were summarized in Table 7 and compared to those obtained in our previous study dealing with the adsorption of these dyes in mono-component dye solutions [4].
Internal and external mass transfer parameters in mono- and bi-component system for BR2 and BV3
| Kf | Df (cm2∕s) | ||
|---|---|---|---|
| BR2 | Single | 4.48 × 10⁻⁴ | 3.99 × 10⁻⁹ |
| Mix | 3.57 × 10⁻⁴ | 3.18 × 10⁻⁹ | |
| BV3 | Single | 3.06 × 10⁻⁴ | 2.73 × 10⁻⁹ |
| Mix | 3.88 × 10⁻⁴ | 3.46 × 10⁻⁹ | |
According to Table 7, the comparison of Df values of BR2 in single (3.99 × 10⁻⁹ cm2∕s) and binary (3.18 × 10⁻⁹ cm2∕s) solution showed that the adsorption of this pigment slowed down in the mixture solution by a factor of 1.25 contrarily to BV3 where the film diffusion coefficient was raised by almost the same factor (1.27). The opposite trend of BR2 and BV3 can be explained by the electrostatic coupling effect where the faster molecule (BR2) was slowed down by BV3 and vice-versa. This phenomenon was reported during the adsorption of charged molecules such as proteins.
On another note, since the diffusion film coefficients were not in the range of 10−6 and 10−8 cm2∕s, mass transfer mechanisms of BR2 and BV3 in mixture solutions cannot be controlled by the sole phenomenon of film diffusion [53]. These results are in accordance with the plot of Boyd’s model which did not pass through the origin. The BR2 and BV3 sorption in this case was not governed only by external mass transfer controlled film diffusion, but also by intraparticle transport, i.e., pore diffusion.
To identify the importance of the intraparticle diffusion step of BR2 and BV3 in the binary adsorption process, the mathematical expression in the Weber and Morris model was used:
| (17) |
The occurrence of intraparticle diffusion as the rate limiting step requires that the plot of qe versus t1∕2 should be linear with a nil intercept.
However, the BR2 and BV3 plots, shown in Figure 4, are not linear over the whole time range and, instead, can be divided into three sections. The first sharper portion is the slowly rising stage where the external surface adsorption was implied. The second portion is a straight line reflecting the gradual sorption stage where the intraparticle diffusion is rate controlling. The final equilibrium stage is a plateau, where the intraparticle diffusion slows down due to the low solute concentration in the solution [54].
These non-linear sections indicate that surface adsorption and intraparticle diffusion processes occur simultaneously. This finding is similar to that reached in previous works [55, 56].
The values of kin and C parameters were calculated by minimizing the SSE errors using Solver EXCEL and then compared to those obtained in single solutions (Table 8).
Intraparticle diffusion model parameters and Biot numbers in mono- and bi-component systems for BR2 and BV3
| Kin (mg∕g⋅min0.5) | C (mg∕g) | Dip (cm2∕s) | Dip Single∕Dip Mix | Bi | ||
|---|---|---|---|---|---|---|
| BR2 | Single | 1.74 | 35.68 | 1.24 × 10⁻¹⁰ | 10.99 | 31.92 |
| Mix | 0.38 | 34.92 | 1.13 × 10⁻¹¹ | 389.77 | ||
| BV3 | Single | 0.70 | 51.00 | 1.76 × 10⁻¹¹ | 1.59 | 145.21 |
| Mix | 0.54 | 50.62 | 1.11 × 10⁻¹¹ | 300.26 | ||
The nonzero intercepts in each case indicate that the rate controlling process was not only due to the intraparticle diffusion but also due to some other mechanisms involved [57].
Moreover, C values for both dyes were lower in mixture solution revealing that less surface was available for the adsorption of BR2 and BV3 in the binary system and, the extent of mass transfer resistance due to boundary layers was reduced.
The diffusion coefficients (Dip) in the binary mixture were obtained using the following equation [52, 58]:
| (18) |
BR2 and BV3 have almost the same diffusion coefficients (Dip) in binary mixtures which were 1.13 × 10⁻¹¹ and 1.11 × 10⁻¹¹ cm2∕s, respectively (Table 8). But, when compared to mono systems, this parameter dropped for both dyes, more significantly for BR2 by a factor of 11.0 than for BV3 (factor of 1.6). These results indicate that the presence of BV3 dye affects significantly the diffusion rate of BR2 dye inside date pit particles. The competition between BR2 and BV3 to diffuse inside adsorbent and the possible pore-blocking phenomena can be the cause of these observations.
Biot number was used to evaluate the predominance of film diffusion against intraparticle in binary adsorption system. Biot numbers were found to be greater than 100 for BR2 (389.77) and BV3 (300.26) indicating that the biosorption in binary systems was mainly controlled by internal diffusion mechanisms for both dyes. This behavior was different in the mono-component system for BR2 where the resistance to intraparticle diffusion was negligible in front of the resistance to film diffusion. This trend was reported in the recent study of Sharma et al. [1] dealing with the adsorption of Methylene blue (MB) and Safranin O (SO) in binary system. In fact, it was found that intraparticle diffusion was responsible for the transportation of MB and SO from aqueous solution to the adsorbent surface.
Thus, it can be concluded from this part that the medium complexity affects the rate of sorption of the diffusion coefficients and the controlling step on the kinetic adsorption reaction. In fact, it was found that BR2 was more affected by the presence of BV3 since it was hindered by this later dye. BV3 showed more affinity for adsorption sites compared to BR2. Intraparticle diffusion was the controlling step in the mass transfer of both dyes in a binary dye system. The intraparticle diffusion coefficients dropped significantly for BR2 in the mixture solution compared to single solution contrarily to BV3.
3.2. Equilibrium study
Adsorption isotherms would describe how BR2 and BV3 interact with the date pits and, therefore, help to approach the adsorption mechanism and to determine the equilibrium adsorption capacity. Figure 5 depicts then the experimental adsorption capacity (qe) of BR2 and BV3 in single and binary systems as a function of dye concentration (Ce) when equilibrium is reached.
Experimental isotherms of BR2 and BV3 in single and binary systems.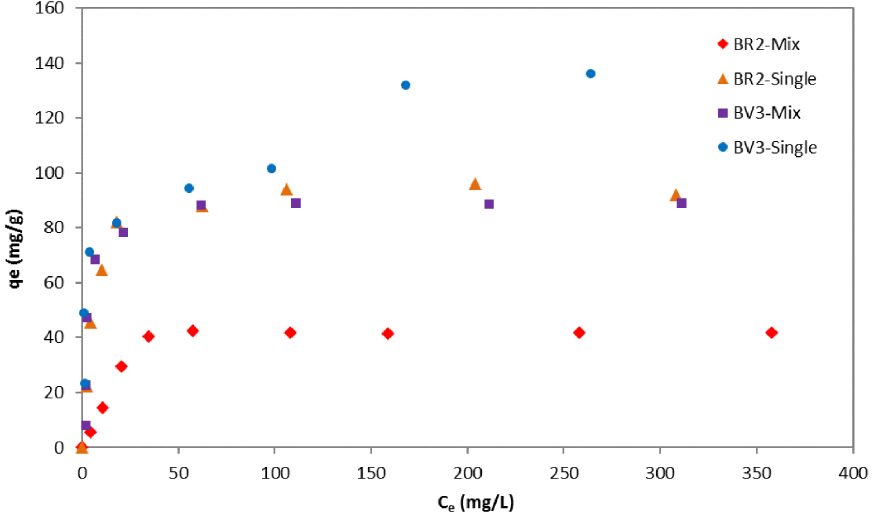
One can see that, for the low equilibrium dyes concentration, the concentrations of BV3 on the solid phase (qe) in the mixture were almost equal to those when this dye was present individually in the solution. This behavior was different for BR2 where the adsorption capacity was clearly lower in binary systems compared to the single ones even for low dye concentrations. The uptake capacity of BV3 was more disturbed at higher dye concentrations (Ce). However, in higher solute concentrations, lower adsorption capacities were recorded for both dyes compared to the individual sorption results.
A deeper examination of the BV3 isotherms brings out that this latter is L-curve in the binary system, which is a sign of high affinity. The BV3 adsorption mechanism was not highly affected by the conditions of competition contrarily to BR2 dye. For this latter, a less regular shape of isotherm is noticed in the mixture solution compared to the mono-dye solution. Similar results were found by Al-Degs et al. [43] who indicated that the concentration of the dye being adsorbed increased before it decreased again. In our case too, BV3 may have displaced and replaced the BR2 dye which has less affinity to the adsorption date pit sites.
Figure 6 gives a comparison of individual BR2 and BV3 experimental adsorption capacities both in single and binary component systems as well as the total adsorption capacity.
Experimental maximum adsorption capacities of BR2 and BV3 in mono- and bi-component solutions.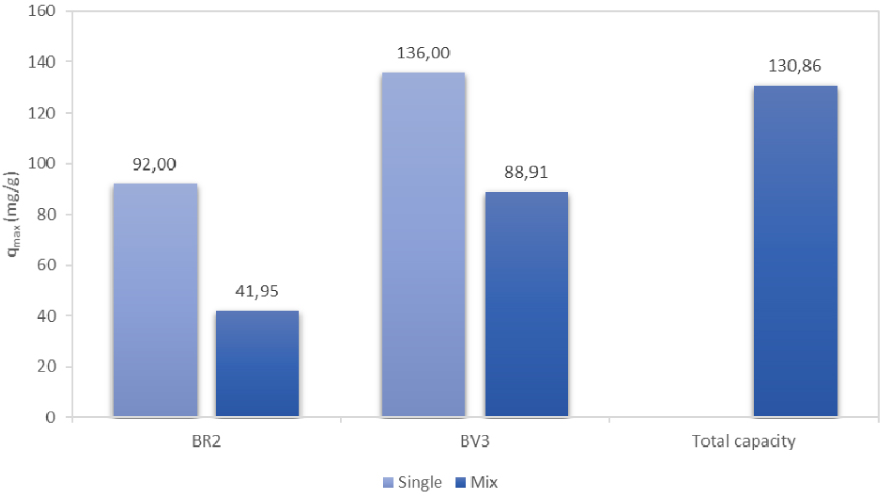
It is clear that the adsorption capacity was reduced for both dyes in the binary system, which suggests a high competition between the dyes to occupy the active sites.
It should also be indicated that BR2 was more affected than BV3 in The mixture solution where the reduction percentage was 54.4% and 34.6% for BR2 and BV3, respectively.
In both cases, the drop of the adsorption capacities in the binary solutions can be the consequence of several factors including (i) interaction between dyes in solution; (ii) change of the sorbent surface charge due to adsorption; (iii) displacement effects; and (iv) non-functional groups of an adsorbed dye blocking the active sites for the adsorption of other dyes [9].
The total adsorption capacity is apportioned as follows: 67.94% for BV3 and 32.06% for BR2. Thus, the available adsorption sites on date stones are preferentially occupied by BV3. This finding can be explained by the high molecular weight of BV3 (407 g/mol vs. 353 g/mol for BR2) and by its lower solubility (16 g/L vs. 50 g/L for BR2) [51, 59, 60]. Similar results were reported by Fernandez et al. [60] who studied the adsorption of Rhodamine B (RhB) and Methylene Blue (MB) by orange peels in binary system. In fact, it was showed that Rhodamine B exhibited higher adsorption capacity compared to Methylene Blue since the size of the former dye was higher (373.91 and 479.0 g/mol for MB and RhB, respectively).
Competition and separation factors
The extent of competition was assessed by the magnitudes of the competition factors (CF). Figure 7 displays the variation of the competition factor as a function of the initial dye concentration for both dyes.
Competition factor variation as a function of initial concentrations of BR2 and BV3.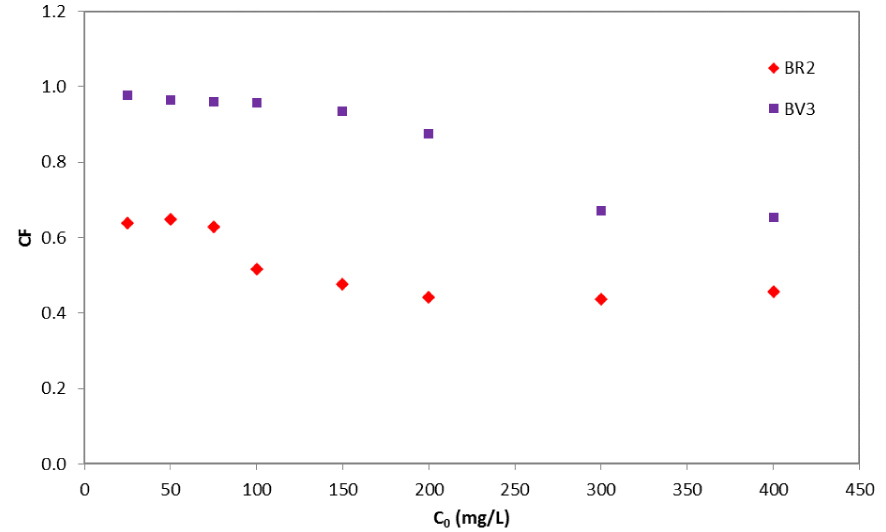
In all cases, the competition factors were inferior to 1, demonstrating a negative competition between the solutes. The least affected was BV3, due to its high affinity toward the date pit particles. In all tests too, the removal of each of BR2 and BV3 decreased when these two solutes are both present in the solution. The serious inhibition of the adsorption of both dyes when they coexisted implied an antagonistic effect.
Moreover, besides the competition factor, the separation factor is generally adopted to assess the preference for the adsorption sites by mono- and bi-component solutions [23]. The separation factor is expressed by (19) and is calculated from the equilibrium sorption data [23]:
| (19) |
If , then the ion A (BR2) is preferred and, if , then it is the ion B (BV3), which is preferred. The separation factor (0.42) was found lower than unity, which means that BR2 is not preferred and, BV3 had more affinity to the date pit particles, supporting the conclusions reached earlier.
Equilibrium modeling
The parameters obtained by the different applied models as well as the corresponding error functions are provided in Table 9.
Equilibrium parameters for BR2 and BV3 adsorption in mixture solution by date pits
| Model | Parameter | Value | SSE | HYBRID | MPSD | R2 | |
|---|---|---|---|---|---|---|---|
| BR2 | Non-modified Langmuir | qmax (mg∕g) | 97.893 | 4445.818 | 305.984 | 34.102 | 0.441 |
| KL (L/mg) | 0.1794 | ||||||
| Modified Langmuir | qmax (mg∕g) | 97.893 | 33.358 | 2.523 | 0.319 | 0.975 | |
| KL (L/mg) | 0.179 | ||||||
| 𝜂 | 8.190 | ||||||
| J–S Modified Langmuir | qmax (mg∕g) | 97.893 | 4004.346 | 268.070 | 29.358 | 0.377 | |
| KL (L/mg) | 0.179 | ||||||
| P-factor Langmuir | P | 2.240 | 165.638 | 10.691 | 1.302 | 0.872 | |
| (L/mg) | 7.358 | ||||||
| aL (L/mg) | 0.070 | ||||||
| Extended Freundlich | KF (L/mg) | 38.912 | 285.839 | 59.841 | 0.678 | 0.803 | |
| n | 5.791 | ||||||
| x | 1.315 | ||||||
| y | 20.212 | ||||||
| z | 0.854 | ||||||
| SRS model | KF (L/mg) | 38.912 | 1495.565 | 108.537 | 12.785 | 0.251 | |
| n | 5.791 | ||||||
| a | 3.740 | ||||||
| Non-modified Redlich–Peterson | KR (L/mg) | 14.353 | 7240.304 | 177.216 | 4.445 | 0.442 | |
| 𝛼R | 0.108 | ||||||
| 𝛽R | 1.060 | ||||||
| Modified Redlich–Peterson | KR (L/mg) | 14.353 | 35.077 | 2.513 | 0.303 | 0.973 | |
| 𝛼R (L/mg) | 0.108 | ||||||
| 𝛽R | 1.060 | ||||||
| 𝜂R | 6.151 | ||||||
| BV3 | Non-modified Langmuir | qmax (mg∕g) | 117.357 | 6641.909 | 91.990 | 1.344 | 0.569 |
| KL (L/mg) | 0.300 | ||||||
| Modified Langmuir | qmax (mg∕g) | 117.357 | 12,686.623 | 182.769 | 3.003 | 0.547 | |
| KL (L/mg) | 0.300 | ||||||
| 𝜂 | 9.438 | ||||||
| J–S Modified Langmuir | qmax (mg∕g) | 117.357 | 6641.909 | 91.990 | 1.344 | 0.569 | |
| KL (L/mg) | 0.300 | ||||||
| P-factor Langmuir | P | 1.552 | 281.863 | 9.534 | 0.371 | 0.928 | |
| (L/mg) | 42.795 | ||||||
| aL (L/mg) | 0.301 | ||||||
| Extended Freundlich | KF (L/mg) | 41.741 | 5304.276 | 59.841 | 0.676 | 0.727 | |
| n | 4.701 | ||||||
| x | 12.455 | ||||||
| y | 17,281.474 | ||||||
| z | 0.001 | ||||||
| SRS model | KF (L/mg) | 41.741 | 3575.884 | 50.150 | 0.787 | 0.736 | |
| n | 4.701 | ||||||
| a | 0.176 | ||||||
| Non-modified Redlich–Peterson | KR (L/mg) | 347.391 | 7603.937 | 112.813 | 1.820 | 0.66 | |
| 𝛼R | 7.695 | ||||||
| 𝛽R | 0.803 | ||||||
| Modified Redlich–Peterson | KR (L/mg) | 347.391 | 43,136.427 | 548.898 | 7.709 | 0.476 | |
| 𝛼R (L/mg) | 7.695 | ||||||
| 𝛽R | 0.803 | ||||||
| 𝜂R | 170.311 | ||||||
All of the non-modified Langmuir model, the J–S modified Langmuir, the SRS model, and the non-modified Redlich–Peterson model exhibited a poor fit to the BR2 experimental data as indicated by the low R2 values (0.441, 0.377, 0.251, and 0.442, respectively). Therefore, the assumption of non-competitive biosorption of BR2 was invalid. The P-factor Langmuir and extended Freundlich models could not fit the BR2 experimental data (R2 equal to 0.872 and 0.803, respectively). Some previous researches also reported that the P-factor model did not account for competition nor for interactions between the metal ions [61]. The best match for BR2 was provided by the modified Langmuir and the modified Redlich–Peterson models which exhibited the highest correlation coefficient R2 (0.975 and 0.973, respectively). Following SSE, Hybrid, and MPSD values, we can conclude that the modified Langmuir model described most accurately the adsorption behavior of BR2 in the binary dyes system. This finding may be due to the fact that this model considers the surface heterogeneity of the adsorbent and the mutual interaction effect of the different dye molecules [52]. As a matter of fact, the modified Langmuir model accounts for the influence of other competing solutes by means of the interaction factor (𝜂). Similar previous results were explained by the fact that one adsorption site cannot be simultaneously occupied by two solutes, and competitive sorption between pollutants occur when they coexisted in wastewaters [29, 51, 62].
As for BV3, the P-factor model could match best the equilibrium adsorption data. Previous works have also successfully described binary adsorption by the P-factor model. This model is, in fact, a major enhancement over the modified Langmuir model [17, 61], thanks to the lumped factor Pi, defined as the ratio between qmax on mono- and multi-component systems. The calculus of this factor for BV 3 gives a P-value equal to 1.53 which is so close to the P-factor (1.55) provided upon the fitting using the P-factor model.
Among the eight tested models, the three equilibrium models fitting the best experimental data are (Figure 8):
- For BR2: Modified Langmuir > Modified Redlich–Peterson > P-factor Langmuir
- For BV3: P-factor Langmuir > SRS model > Extended Freundlich.
According to this summary, it is clear that the mechanisms of adsorption are different for each dye since they were represented by equilibrium models where the assumptions are different.
Equilibrium models of BR2 (A) and BV3 (B) in the binary adsorption system.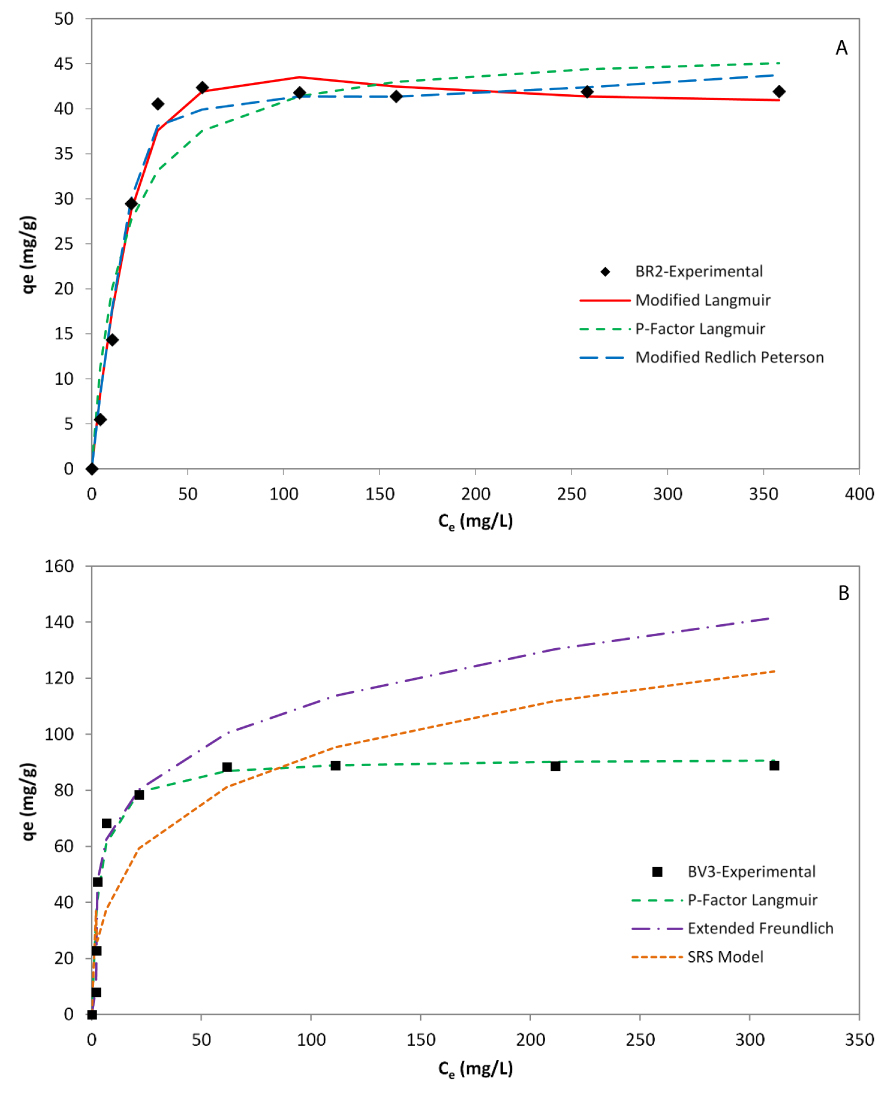
3.3. Thermodynamic study
A series of experiments were conducted at 15, 25, 35, 45, and 50 °C to approach the temperature effect on the equilibrium capacity of the date pits for the BR2 and BV3 cationic dyes in the binary system.
The quantities of BR2 and BV3 adsorbed on the date pit particles in single and mixture solutions as a function of solution temperature are depicted in Figure 9.
Variation of qe as a function of temperature for BR2 and BV3 in mono- and bi-component systems.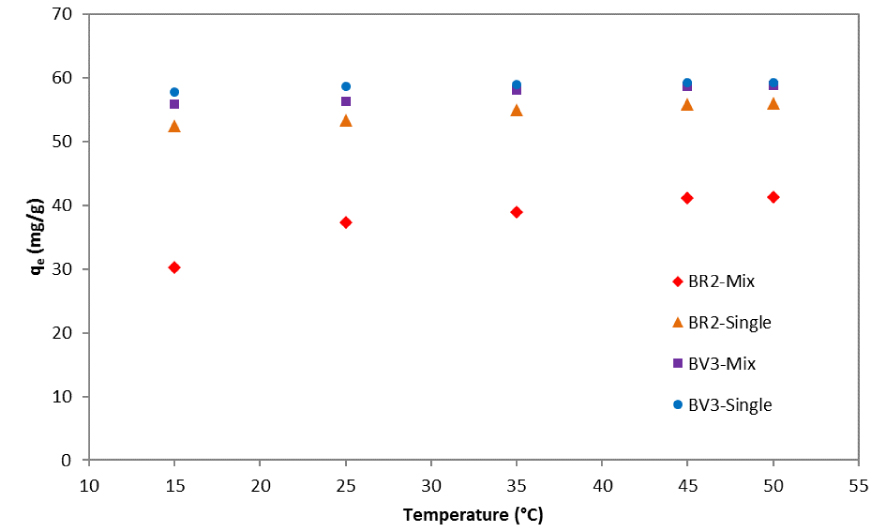
The rise in solution temperature increases the adsorbed quantities of BR2 and BV3 in bi-component systems. This trend was also observed in the one-component solutions and might be due to an increase in dye mobility that may occur at higher temperatures. Moreover, the effect of temperature was more significant in the mono-component than in the bi-component systems, especially for BR2 (Figure 9).
Thermodynamic parameters, enthalpy (𝛥H°), and entropy (𝛥S°) values are given in Figure 10, together with those calculated in mono-dye solutions.
Comparison of enthalpy (A) and entropy (B) values for BR2 and BV3 in mono- and bi-component systems.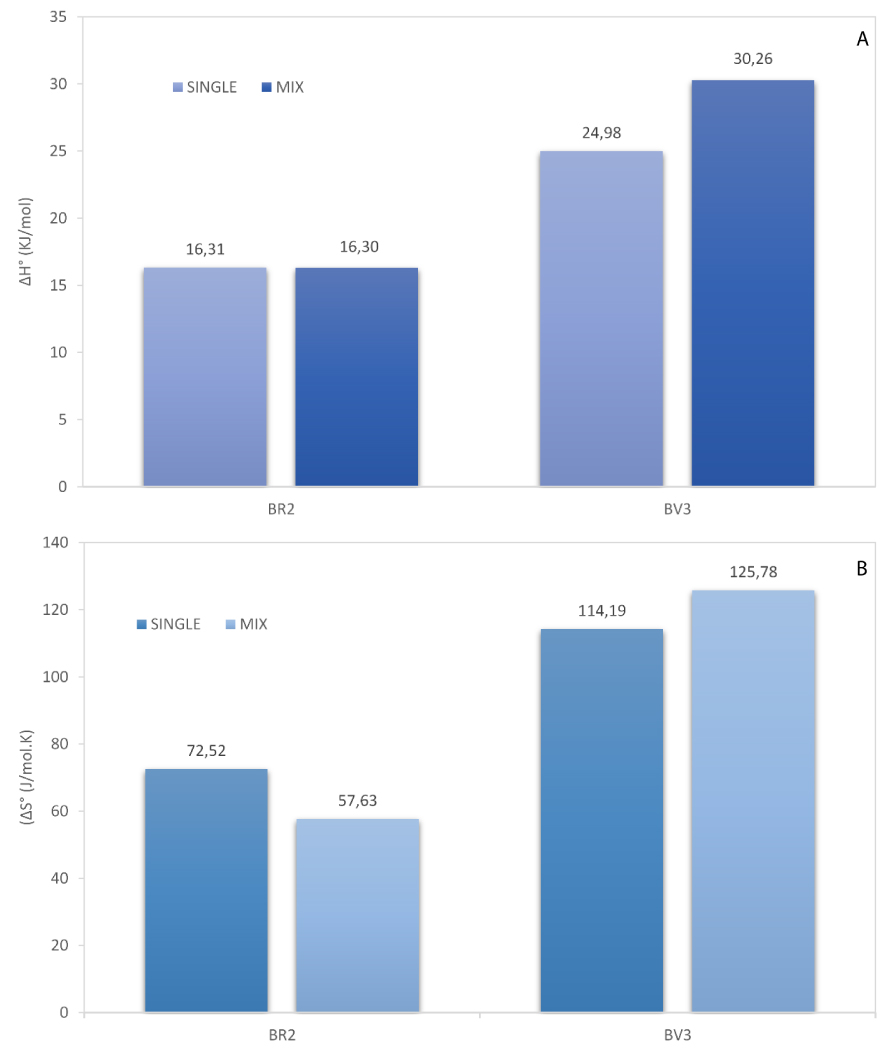
Several conclusions can be outlined. The adsorption in the mixture solution is endothermic since the value of enthalpy 𝛥H° is positive for BR2 (16.30 kJ/mol) and BV3 (30.26 kJ/mol) dyes (Figure 10-A). This is the result of two simple mechanisms [63]: (i) desorption of the solvent molecules previously adsorbed, and (ii) adsorption of the dye molecules. Each molecule of the colorant displaces more than one molecule of the solvent. The net result brings out an endothermic process. Comparison with the mono-component system showed that 𝛥H° was almost the same for BR2, contrarily to BV3, where the enthalpy was greater in mixture solution (30.26 against 24.98 kJ/mol). Similar results were reported by Sharma et al. [1] indicating the endothermic nature of simultaneous adsorption of methylene blue and Safranin O where the enthalpy values were 26.11 and 30.84 kJ/mol, respectively.
The positive values of 𝛥S° reflect the affinity of date pits for BR2 (57.63 J∕mol⋅K) and BV3 (125.78 J∕mol⋅K) and show the increasing of randomness at the solid/liquid interface during the adsorption of dyes in the binary system (Figure 10-B). By comparison with the mono-dye solution, the entropy value relative to BR2 was dropped, suggesting that the randomness and the affinity also decreased. Contrary to BR2, the adsorption of BV3 is associated with a rise in entropy from 114.19 J∕mol⋅K in mono to 125.78 J∕mol⋅K in bi-component systems, which means that the adsorbed dye molecules are organized more randomly in this last case.
Debnath et al. [23] determined the entropy variation upon the simultaneous adsorption of dyes in ternary system which was found to be 54.51, 57.01, and 65.02 J∕mol⋅K for Safranin O, brilliant green, and methylene blue. The positive entropy change indicate the increase in the number of species at the solid–liquid interface.
The free enthalpy 𝛥G°, the value of which is expressed by (20), is another calculated thermodynamic parameter (Figure 11) that gives information about the spontaneity of the adsorption reaction [44, 64]:
| (20) |
Similar to single-component systems, was negative which indicate that the overall adsorption processes in the mixture solution are also spontaneous. This spontaneity decreases with the increase of temperature in one hand and when adding a second dye in the solution on the other hand. This is truer for BR2 than for BV3.
Free enthalpy variation as function of temperature for BR2 and BV3 in mono- and bi-component systems.
Similar results were reported by Debnath et al. [23] where the free enthalpy variation was negative for the three studied dye in mixture solutions (Safranin O, brilliant green, and methylene blue).
4. Conclusions
This study investigated the kinetics, equilibrium, and thermodynamics of the biosorption of two cationic dyes (basic red 2 and basic violet 3) on date pit particles in a two-dye-component solution. The overall uptake capacity of the dyes in the binary system decreased due to the antagonistic interaction between dyes. Indeed, BV3 inhibited the adsorption of BR2. The comparison of different parameters between the mono- and the bi-component system revealed that the behavior of both dyes has changed.
Finally, based on the biosorption capacities of BR2 (41.95 mg/g) and BV3 (88.11 mg/g), the Tunisian annual amounts of date pits could eliminate simultaneously about 34 T of BR2 and 72 T of BV3 from textile industrial effluents.