

 CC-BY 4.0
1. Introduction
Our dependence on fossil fuels as energy sources has caused global-energy crisis and serious environmental problems. These energy sources take millions of years to form naturally and are depleted much faster than the rate at which they are being produced. Moreover, the rapid growth in the world’s population has increased further the demand for energy. It is expected that this demand will keep on increasing in the future. This is why this limited resource is going to run out eventually [1, 2]. More importantly, the dependence on fossil fuels as energy vector has created environmental issues since their burning releases anthropogenic greenhouse gases to the atmosphere. Indeed, climate problems and the need to reduce greenhouse gas emissions has forced the politicians and industries to rethink of future energy and to favor the research on clean and energy-rich fuel for the future [1]. In this context, researches are being carried out in the aim of developing alternative solutions oriented toward minimizing the formation of polluting compounds and greenhouse gases. Hydrogen has been suggested as a clean and energy-rich fuel for the future. It can be produced from different methods, but lately studies are being conducted to derive hydrogen from natural gas due to its availability and low price. A good choice is dry reforming of methane (DRM) [3], which involves the reaction of the major component of natural gas, methane (CH4), with carbon dioxide (CO2) to produce hydrogen (H2) and carbon monoxide (CO) as given by the following reaction [4]:
For these reasons, in our work, nickel-based catalysts will be synthesized where nickel is dispersed on well-defined structures. These structures are composed of four supports, magnesium–aluminum oxides, prepared by a hydrotalcite route, where a surfactant (CTAB glucose, P123) or a mesoporous silica SBA-15 is introduced to enhance the hydrotalcite textural properties (porosity, specific surface area, etc …). Indeed, the use of surfactants will affect the morphology, particle size, and some properties of hydrotalcites. This may help in improving its catalytic properties. Some previous works were performed on such structures [15, 16, 17, 18, 19, 20, 21] but did not concern applications in reforming reactions and did not use nickel as active phase. Some other works were carried out in DRM where surfactants were used with Ni–Mg–Al hydrotalcites. Tan et al. [22] prepared oxides derived from Ni–Mg–Al hydrotalcite with the use of the surfactants tetrapropylammonium hydroxide (TPAOH), pluronic P123, poly(vinylpyrrolidone) (PVP), and hexadecyltrimethylammonium bromide (CTAB). They evaluated their catalysts in DRM. They found that the different surfactants influence the metal particle size and promote or inhibit specific crystal planes of Ni, therefore affecting the catalytic performance. Xu et al. [23] also prepared similar catalysts with P123 as surfactant and obtained promising results in DRM. In our work and in order to get more active phase (Ni) on the surface, we chose to introduce Ni by impregnation on different Mg–Al oxides supports. Hydrotalcite Mg–Al was prepared conventionally (no modifier) and with a modifier agent. After calcination, the oxide obtained will be impregnated by the active phase Ni. Ni is expected to be more dispersed on the supports prepared with a modifier than on the support without a modifier. So our target is to get more Ni on the surface with higher dispersion, taking benefit from the properties of the well-defined structure of Mg–Al oxides.
2. Experimental part
2.1. Preparation of catalysts
Three hydrotalcites were prepared using surfactants (CTAB, glucose, P123), and composite hydrotalcite was prepared by combining hydrotalcite (HT) with SBA-15. For the sake of comparison, a conventional hydrotalcite was synthesized as well. All these hydrotalcites prepared were calcined to give oxides that will be used as support for the active phase nickel.
2.1.1. Synthesis of conventional hydrotalcite by coprecipitation method
In order to combine several metals within the same homogeneous phase, the coprecipitation method at constant pH has been utilized [15, 24, 25]. A hydrotalcite with a molar ratio
2.1.2. Synthesis of hydrotalcites with surfactants
Three hydrotalcites were prepared with three carbon-based surfactants: glucose, hexadecyltrimethylammonium bromide (CTAB), and the copolymer triblock block-poly(ethylene glycol)-block-poly(propylene glycol)-block-poly(ethylene glycol) pluronic P123. In each case, the surfactant was added to the basic precipitating solution as described hereafter.
Hydrotalcite with glucose
2 g of glucose (D(+) glucose Sigma-Aldrich C6H12O6, MW = 180.6 g⋅mol−1, purity > 99.5%) were dissolved in 10 mL deionized water. The metal nitrate solution was added dropwise into a beaker containing the dissolved surfactant, while heating at 60 °C and adjusting the pH between 9.5 and 10 using the basic solution of Na2CO3 and NaOH. The suspension obtained was stirred for 1 h at 60 °C. The slurry was then poured into a teflon bottle and placed in an oven for hydrothermal treatment of 24 h at 100 °C. The mixture obtained was then filtered and washed with deionized water until a neutral pH of the filtrate was obtained. The solid obtained was brown in color after washing with deionized water, suggesting that glucose underwent aromatization and carbonization under the employed hydrothermal conditions [15]. The solid was then placed in an oven at 60 °C for 48 h to dry and after that it was ground to a fine powder form. The sample obtained is noted HT-glucose.
Hydrotalcite with CTAB
The same procedure detailed above was followed for this sample, with the following change: previous to the synthesis, 2 g of CTAB (C19H42BrN, SIGMA-ALDRICH purity ⩾ 96%, MW = 364.45 g⋅mol−1) were dissolved in 60 mL deionized water at 40 °C and stirred for 3 h. The solid obtained after filtration was of white color. The powder obtained after drying and grinding is labeled HT-CTAB.
Hydrotalcite with Pluronic P123
For this sample, 2 g of Pluronic P123 (PEG-PPG-PEG, SIGMA-ALDRICH, MW ≅ 5800 g⋅mol−1) were dissolved in 60 mL deionized water while stirring at 60 °C overnight. The solution obtained after precipitating the metal nitrate solution was stirred for 20 h at 60 °C and then placed in a teflon bottle at 100 °C for 24 h. The obtained mixture was filtered, washed, then dried and ground as mentioned above. The obtained white powder was labeled HT-P123.
2.1.3. Synthesis of composite hydrotalcite-SBA-15
We followed the same procedure done by Baskaran et al. [16] to have the intercalation of SBA-15 molecular sieve in the interlayer of HT. The molar gel composition they used was respected (HT molar composition of Mg2+:Al3+:
All the above as-synthesized samples (also called uncalcined or dried samples) were calcined at 550 °C (5 °C⋅min−1, 5 h) under air flow. The choice of calcination temperature was based on the thermal analysis results (presented later). After calcination, the samples will be marked by a (C) next to their names given above.
2.1.4. Nickel impregnation
The calcined samples were passed by porosimetry in order to determine their pore volume (cm3⋅g−1). Based on the value obtained, a corresponding solution to lead to a final content of 5 wt% Ni was prepared. A mass of calcined powder support was weighed, and a volume of the prepared Ni solution corresponding to this mass was added, then stirred gently and introduced in a round flask. In order to wash and wet the powder, 20–25 mL of deionized water were added. The flask containing the solution was then placed in a rotary evaporator (60 °C, 120 rpm) in order to homogenize well the catalyst and to evaporate the water. After that, the solid was placed in an oven to dry at 60 °C overnight. The obtained powder was then ground and calcined at 550 °C. The as-obtained samples will be denoted by “Ni-HT-X” where X represents the surfactant used (CTAB, glucose, or P123) or the SBA-15.
2.2. Physicochemical characterizations
Several physicochemical characterizations were performed on the prepared catalysts.
2.2.1. X-ray diffraction (XRD)
XRD analysis was conducted for the uncalcined samples as well as for the samples calcined after Ni impregnation in order to be able to characterize the different phases present in the structure. XRD analysis was performed, at room temperature, on a BRÜKER D8 advance diffractometer equipped with a copper anticathode emitting K𝛼 radiation (𝜆 = 1.5406 Å), a goniometer 𝜃∕2𝜃, and a rotating sample holder to avoid preferential orientations. The general conditions of acquisition correspond to an angular range in 2𝜃 from 5 to 70° with a measurement step of 0.02° for an integration time of 1 s. The crystalline phases are identified by comparing the diffractograms with those of reference compounds in the Joint Committee on Powder Diffraction Database Standards (JCPDS) established by the International Center for Diffraction Data (ICCD). This comparison is made by the EVA software.
2.2.2. Differential thermal and gravimetric analyses (DTA/TGA)
DTA/TGA were performed on the uncalcined samples as well as on samples after DRM. The measurements were carried out on a device SDT Q600 (TA instrument society) starting from ambient temperature up to 800 °C (temperature rise of 5 °C⋅min−1) under an air flow of 100 mL⋅min−1. For each analysis, the mass of test sample was about 10 mg. The software “Universal analysis” is used to process the results obtained.
2.2.3. Brunauer, Emmett, Teller (BET)
The specific surface areas of the samples before and after calcination were measured using a Q Surf M1 (Thermo Electron) instrument (surface area analyser apparatus). The measurement was performed by the BET method by nitrogen adsorption, at its liquefaction temperature ( − 196 °C), on the solid. The BET method is based on the evaluation of the quantity of inert gas physisorbed. A mass of sample of 20–75 mg (depending on the specific area expected) is introduced into the BET cell. The sample, before measurement, is degassed for 30 min at 100 °C under nitrogen flow. The sample is weighed again after degassing in order to determine the mass lost during degasification. After this step, the measurement is performed. It is automated and takes place in two stages: adsorption and desorption, during which the variation of the thermal conductivity of a gaseous mixture consisting of 30% nitrogen (adsorbed gas) and 70% helium (carrier gas) is measured. The desorbed nitrogen is quantified by a thermal conductivity detector (TCD). We used a single-point analysis. This apparatus was used for the uncalcined samples.
2.2.4. Porosimetry
In order to examine the textural characteristic of the mixed oxides, N2 adsorption/desorption and BET calculation methods as well as Barrer, Joyner, and Halenda (BJH) model were used to determine the surface area as well as the pore volume and pore size distributions. Porosimetry was carried out on the calcined samples before and after Ni impregnation. The apparatus used is a Sorptomatic 1990 instrument. The adsorption step was carried out at −196 °C. Before measurement, the sample is heated in vacuum at 300 °C with an increase in temperature of 5 °C⋅min−1, then kept for 5 h at 300 °C. After treatment, the sample is weighed again in order to determine the mass lost during degassing. After this step, the measurement is performed. It is automated and takes place in two stages: adsorption and desorption. When the analysis is done, the system in the apparatus gives the specific surface area (m2⋅g−1), pore volume (cm3⋅g−1), and pore distribution (nm) of the sample. By plotting the curve of pore distribution, one can conclude the homogeneity of formed pores in the sample: the more the pore distribution peak gets narrow, the more homogeneous is the size of pores formed. This is a multi-point analysis and therefore gives more accurate results than BET single-point analysis.
2.2.5. Temperature programmed reduction (TPR)
The reducibility of the calcined solids before and after Ni impregnation was studied by the TPR. The apparatus used is ZETON Altamira AMI 200 system. About 20 mg of sample were deposited in a quartz tube and pretreated under an argon flow of high purity. This argon (Ar) flow of 30 mL⋅min−1 circulates under a temperature ranging from ambient to 150 °C with a rise of 5 °C⋅min−1. The sample is then kept at 150 °C for 1 h to remove adsorbed moisture and air. After that, it is heated to 900 °C at 5 °C⋅min−1 under a H2 flow (5% H2 in Ar, 50 mL⋅min−1) followed by naturally cooling down under an Ar flow. The hydrogen consumed during the reduction was detected by a TCD.
2.3. Dry reforming of Methane (DRM)
2.3.1. Experimental conditions of test
Dynamic catalytic tests were carried out from 400 °C to 800 °C with an interval of 50 °C. For each test, a mass of 100 mg catalyst is introduced into a U-shaped quartz reactor (fixed bed). The reactor is fed by a gaseous mixture of CH4/CO2/Ar having 20%/20%/60% proportions under an atmospheric pressure with a CH4/CO2 molar ratio equal to 1. The total flow is 100 mL⋅min−1 and the gas hourly space velocity (GHSV) is 32,000 h−1. The effluent gas was analyzed using a micro gas chromatography Varian CP-4900 equipped with a Poraplot Q (PPQ) column, a molecular sieve, and a TCD. Before starting the test, the catalyst must undergo an activation step which consists of treating the catalyst by a reducing mixture 5% H2 in Ar after an increase of the temperature from ambient till 800 °C (10 °C⋅min−1). The latter temperature is maintained for 2 h in order to activate the catalyst. The reactor is then cooled at 400 °C under Ar flow to start the test. Many injections were done at each temperature studied. The analyses of the reactor effluents are done by gas chromatography every five minutes.
2.3.2. Calculation formulas
The general formulas given below are used to calculate the conversions of the reactants, the carbon balance, and H2/CO ratio.
Conversion of reactantsR(XR)
| (1) |
Carbon balance (CB)
| (2) |
H2/CO ratio
| (3) |
3. Results and discussions
3.1. Physicochemical characterization of uncalcined samples
3.1.1. X-ray diffraction
Figure 1 shows X-ray diffractograms of the dried solids. The patterns of all the prepared solids show the diffraction lines of the hydrotalcite structure (JCPDS 22-0700).
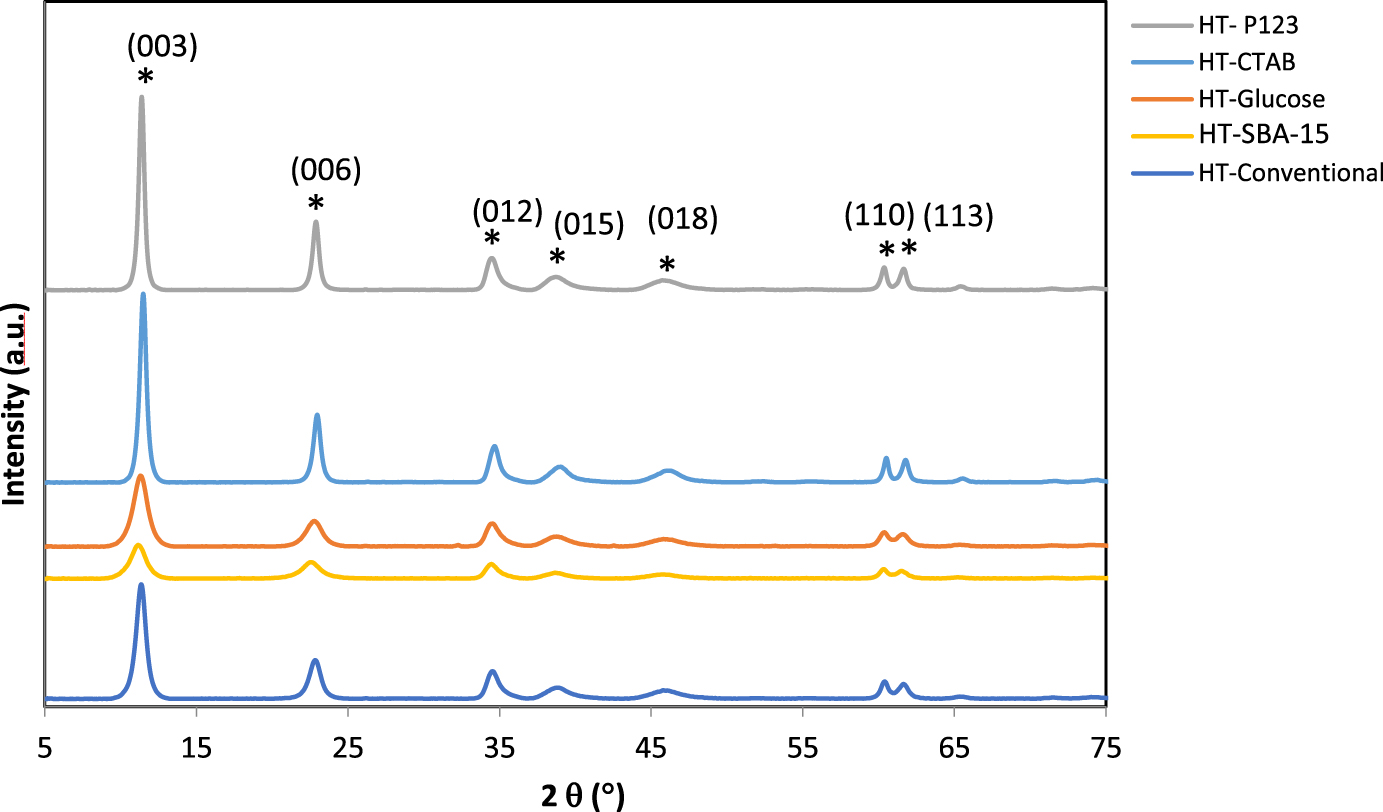
X-ray diffractograms of the uncalcined samples.
Crystallographic parameters and free interlayer space of uncalcined samples
| Samples | 2𝜃 (°) | d(003) | c (Å) | 2𝜃 (°) | d(110) | a (Å) | Free interlayer space (Å) |
|---|---|---|---|---|---|---|---|
| HT-conventional | 11.78 | 7.50 | 22.50 | 60.35 | 1.53 | 3.06 | 2.70 |
| HT-CTAB | 11.86 | 7.45 | 22.35 | 60.71 | 1.52 | 3.04 | 2.65 |
| HT-glucose | 11.78 | 7.50 | 22.50 | 60.35 | 1.53 | 3.06 | 2.70 |
| HT-P123 | 11.92 | 7.42 | 22.26 | 60.71 | 1.52 | 3.04 | 2.62 |
| HT-SBA-15 | 11.43 | 7.73 | 23.19 | 60.71 | 1.52 | 3.04 | 2.93 |
The diffraction peaks are observed at 2𝜃 of 11.5°, 23.5°, 35.0°, 38.0°, 46.2°, 60.5°, and 61.8° and are respectively indexed to the lattice planes (003), (006), (012), (015), (018), (110), and (113) [24, 26, 27]. The inter-planar spacing (d) corresponding to these peaks is deduced from Bragg’s law given by the relation:
| (4) |
The different cell parameters are given in Table 1. Two parameters “
Knowing the lattice planes (hkl) and the inter-planar spacing d(hkl), the following relation is used to determine the cell parameters [28]:
| (5) |
The crystallographic parameter “
The values obtained for the parameter “
BET values for the samples before and after calcination at 550 °C.
Moreover, the composite sample HT-SBA-15 shows, in Figure 1, a slight deviation in the first peak at 2𝜃 = 11.7° (in accordance with the literature) [16], resulting in a higher d(003) value due to the fact that the free interlayer distance obtained for this sample is slightly higher than that of the other samples. This might be attributed to the intercalation of SBA-15 in the interlayer space between two hydrotalcite brucite sheets to replace the
From XRD, based on the results obtained, we were able to detect the crystalline structure and determine the lattice cell parameters; therefore, we were capable of proving the formation of hydrotalcite layered structure even in the presence of surfactants or SBA-15.
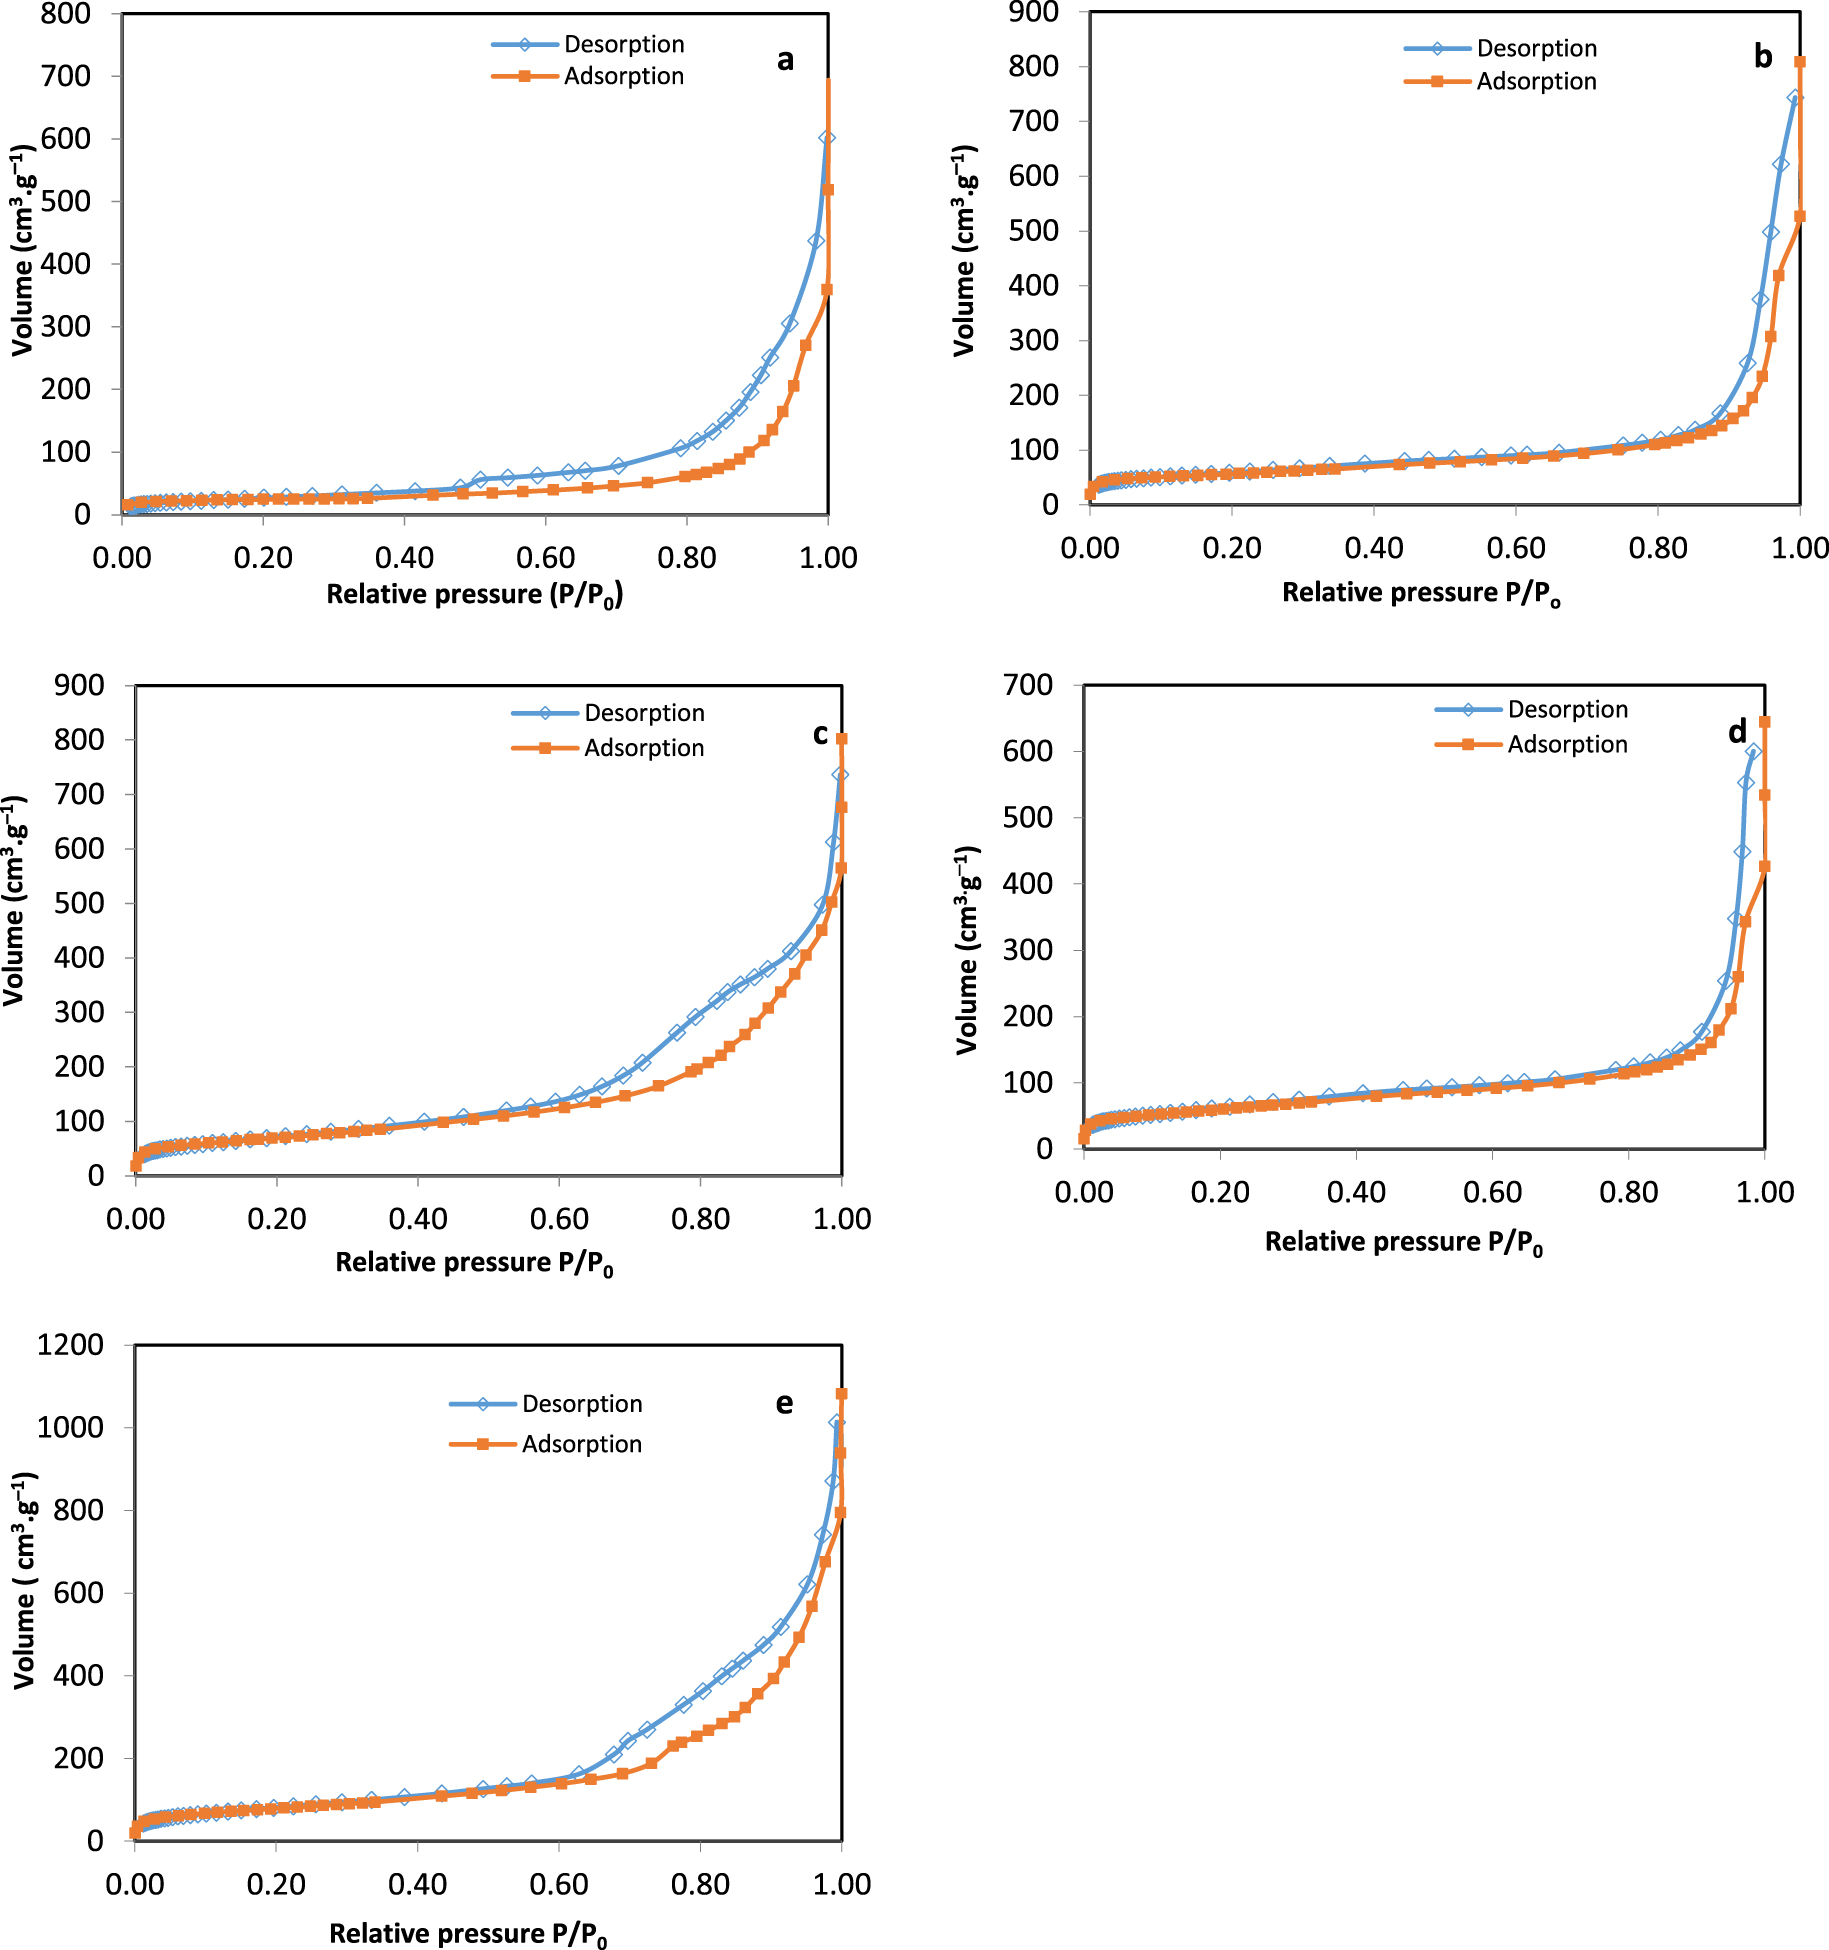
N2 adsorption/desorption curves for samples calcined at 550 °C: (a) HT-conventional (C), (b) HT-CTAB (C), (c) HT-glucose (C), (d) HT-P123 (C), (e) HT-SBA-15 (C).
3.1.2. Thermal analysis (DTA/TGA)
DTA/TGA curves (Figure S1) resulting from the calcination under air flow of dried samples exhibit three endothermic peaks accompanied with mass losses. According to the literature, these three peaks appear in the thermal profile of hydrotalcite and are ascribed to the loss of physisorbed and interlayer water (around 150–200 °C), to the loss of hydroxyl groups (HO−) in the brucite sheets (dehydroxylation of brucite-like sheets) (about 310 °C), and to the departure of interlayer
Different textural properties of the supports, given by the porosimetry
| Samples | ssa (m2⋅g−1) | Pore volume (cm3⋅g−1) | Pore size distribution (nm) |
|---|---|---|---|
| HT-conventional (C) | 76 | 0.40 | — |
| HT-CTAB (C) | 191 | 0.65 | 33 |
| HT-glucose (C) | 248 | 0.78 | 8 |
| HT-P123 (C) | 210 | 0.54 | 61 |
| HT-SBA-15 (C) | 281 | 1.05 | 7 |
FTIR confirmed XRD and thermal analysis results since all the IR spectra (Figure S2) showed bands due to O–H,
3.2. Physicochemical characterization of the samples calcined at 550 °C
3.2.1. BET analyses for uncalcined and calcined samples
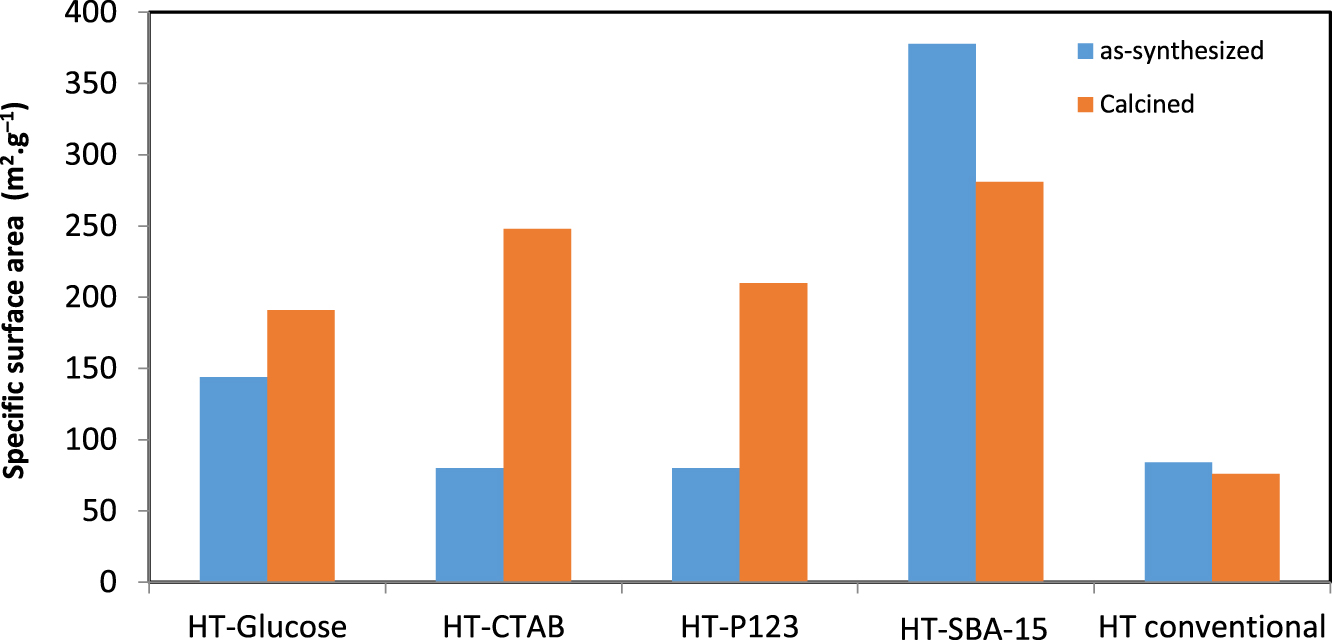
The different specific surface areas (ssa) obtained for the samples before and after calcination are given in Figure 2. Before calcination, the value of ssa obtained for the conventional HT did not change significantly with the introduction of the surfactants CTAB and P123. Conversely, it increased from 84 m2⋅g−1 to 144 m2⋅g−1 when glucose was used. As for the HT-SBA-15, it showed a surface area (378 m2⋅g−1) significantly higher than that of conventional HT.
It is also noted that after calcination, a significant increase in the specific surface area is observed for all samples except for an SBA-15 based one. This increase is due to passing from a crystallized structure of hydrotalcite type to a mixed oxide type structure, in agreement with X-ray diffractograms (not shown for the calcined samples before Ni impregnation). It seems that despite the heat treatment at 550 °C, the mixed oxides retain an ssa greater than the hydrotalcite form. On the other hand, for the samples that contained surfactants, an ssa higher than that of the oxide derived from conventional HT is obtained. This was expected due to the presence of surfactants whose role is to create more porous supports. As for the sample HT-SBA-15 in which the SBA-15 should be intercalated between the HT layers, a significant higher value for ssa is obtained, both before and after calcination. Indeed, SBA-15 alone has a surface area of 750–800 m2⋅g−1 [39]; therefore, its intercalation within the HT interlayers will definitely lead to a much higher value of ssa than HT alone.
3.2.2. Porosimetry for calcined samples
The N2 adsorption/desorption curves for calcined samples are shown in Figure 3. The appearance of a hysteresis loop in the samples is a sign of the presence of some mesoporosity in the structure. HT-conventional (C) (graph a) followed a class IV(a) isotherm, with a H3 hysteresis loop. Isotherms with a H3 hysteresis do not generally have a limiting adsorption at high P∕P0 values which would imply that the pores are non-rigid aggregates of plate-like particles giving rise to slit-shaped pores [40]. Both HT-CTAB (C) and HT-P123 (C) (graphs b and d) showed a type IV(a) isotherm having H1 hysteresis loop. This type of hysteresis loop has steep parallel adsorption and desorption isotherms. At these steps all pores are filled (adsorption) and emptied (desorption). It is typical for mesoporous materials with uniform pores [40]. The curves obtained with P123 and CTAB are similar to those obtained in literature [19, 21]. As for the sample HT-glucose (C) (graph c), the results obtained are compatible with the literature [15], where the isotherm is of type IV(a) and the hysteresis of type H2 (H2(b) in our case). However, in our case, the curve is always increasing after the loop, and does not show a saturation. The H2 hysteresis loop has a smooth adsorption step and a sharp desorption step. It is typical for materials with non-uniform pore shapes and/or sizes, such as metal oxides [40]. For HT-SBA-15 (C) sample (graph e), the isotherm is of type IV(a) and the hysteresis is rather of type H3. Such type of hysteresis loop is associated with slit-shaped pores as mentioned above, and might be due to the presence of agglomerates of plate-like particles [40]. However, in the literature, Baskaran et al. [16] obtained for HT-SBA-15 a type IV isotherm with a hysteresis loop that is a combination of H1 and H4 types, indicating the presence of uniform mesoporous channels in the interlayer.
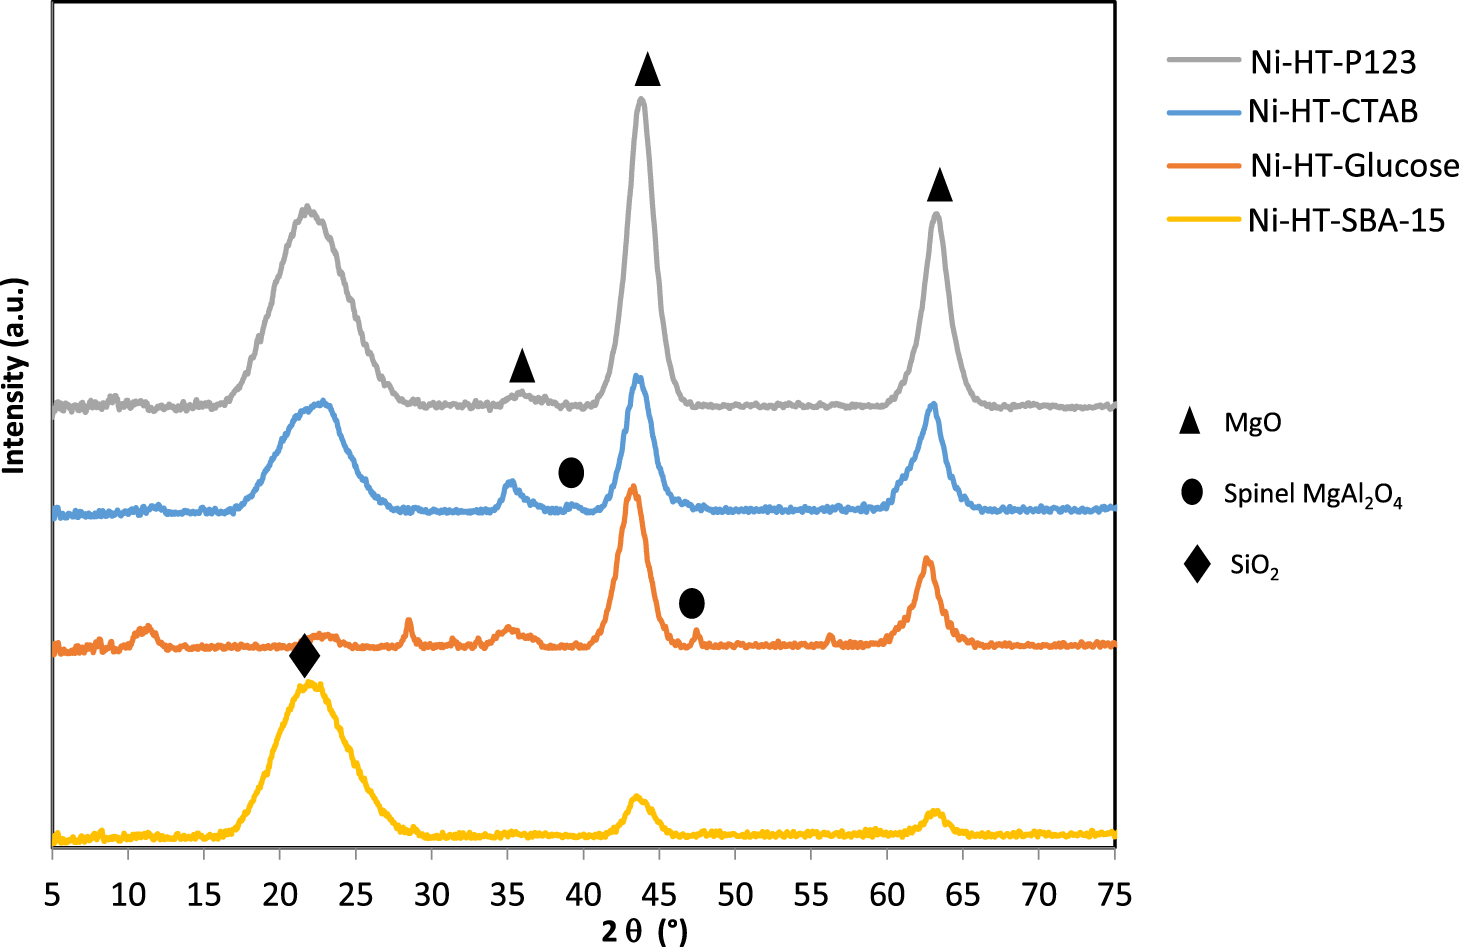
X-ray diffractograms of Ni-impregnated samples calcined at 550 °C (▴: MgO-like phase (JCPDS N° 43-1022), ∙: MgAl2O4 spinel phase (JCPDS N° 75-1796), ⧫: SiO2).
In Table 2, the results obtained by porosimetry for all samples are presented. All supports, except for HT-P123 (C), are mesoporous since the pore diameters of the samples are all distributed in the range of 2–50 nm. Indeed, HT-P123 (C) contains mesopores and macropores (Figure S3), in accordance with the work of Petrolini et al. [21]. The HT-conventional (C) shows a non-uniform pore size distribution (Figure S3) indicating that the size of the pores of this HT structure is not uniform. As for the samples in which a surfactant was introduced, the pore distribution indicates that the distribution of pores is more uniform. For HT-glucose (C), in the literature [15] a pore size distribution around 7 nm was obtained. It is also to be noted that the peak obtained was narrow [15]. Our result was similar to that of the literature. HT-CTAB (C) has a porosity around 33 nm and HT-P123 (C) mainly around 61 nm (Table 2). HT-CTAB (C) was also found to be mesoporous by other authors [19]. For HT-SBA-15 (C), a pore distribution around 7 nm is obtained, which is in accordance with the literature [16]. It is concluded therefore that the use of a surfactant in the synthesis of a hydrotalcite will lead to the formation of more regular pore structure in the sample. It is also deduced from Table 2 that when a surfactant is added, the ssa of a sample increases considerably from 76 m2⋅g−1 to values around 200–250 m2⋅g−1 for all samples with a surfactant. Also, the pore volume increases from conventional HT to surfactant-containing HT. HT-SBA-15 (C) shows a relatively high ssa (281 m2⋅g−1) compared to HT-conventional (C). This is expected, since as mentioned above, SBA-15 alone has a high ssa [39]. This sample also shows the highest pore volume, which is also attributed to the presence of SBA-15 in the interlayer of HT. Thus, due to the higher ssa obtained for the calcined samples modified by a surfactant or by SBA-15, it is expected that after Ni impregnation, stronger interactions between Ni and Mg–Al oxides will take place improving the dispersion of Ni and retarding the sintering of Ni particles during reforming process [41].
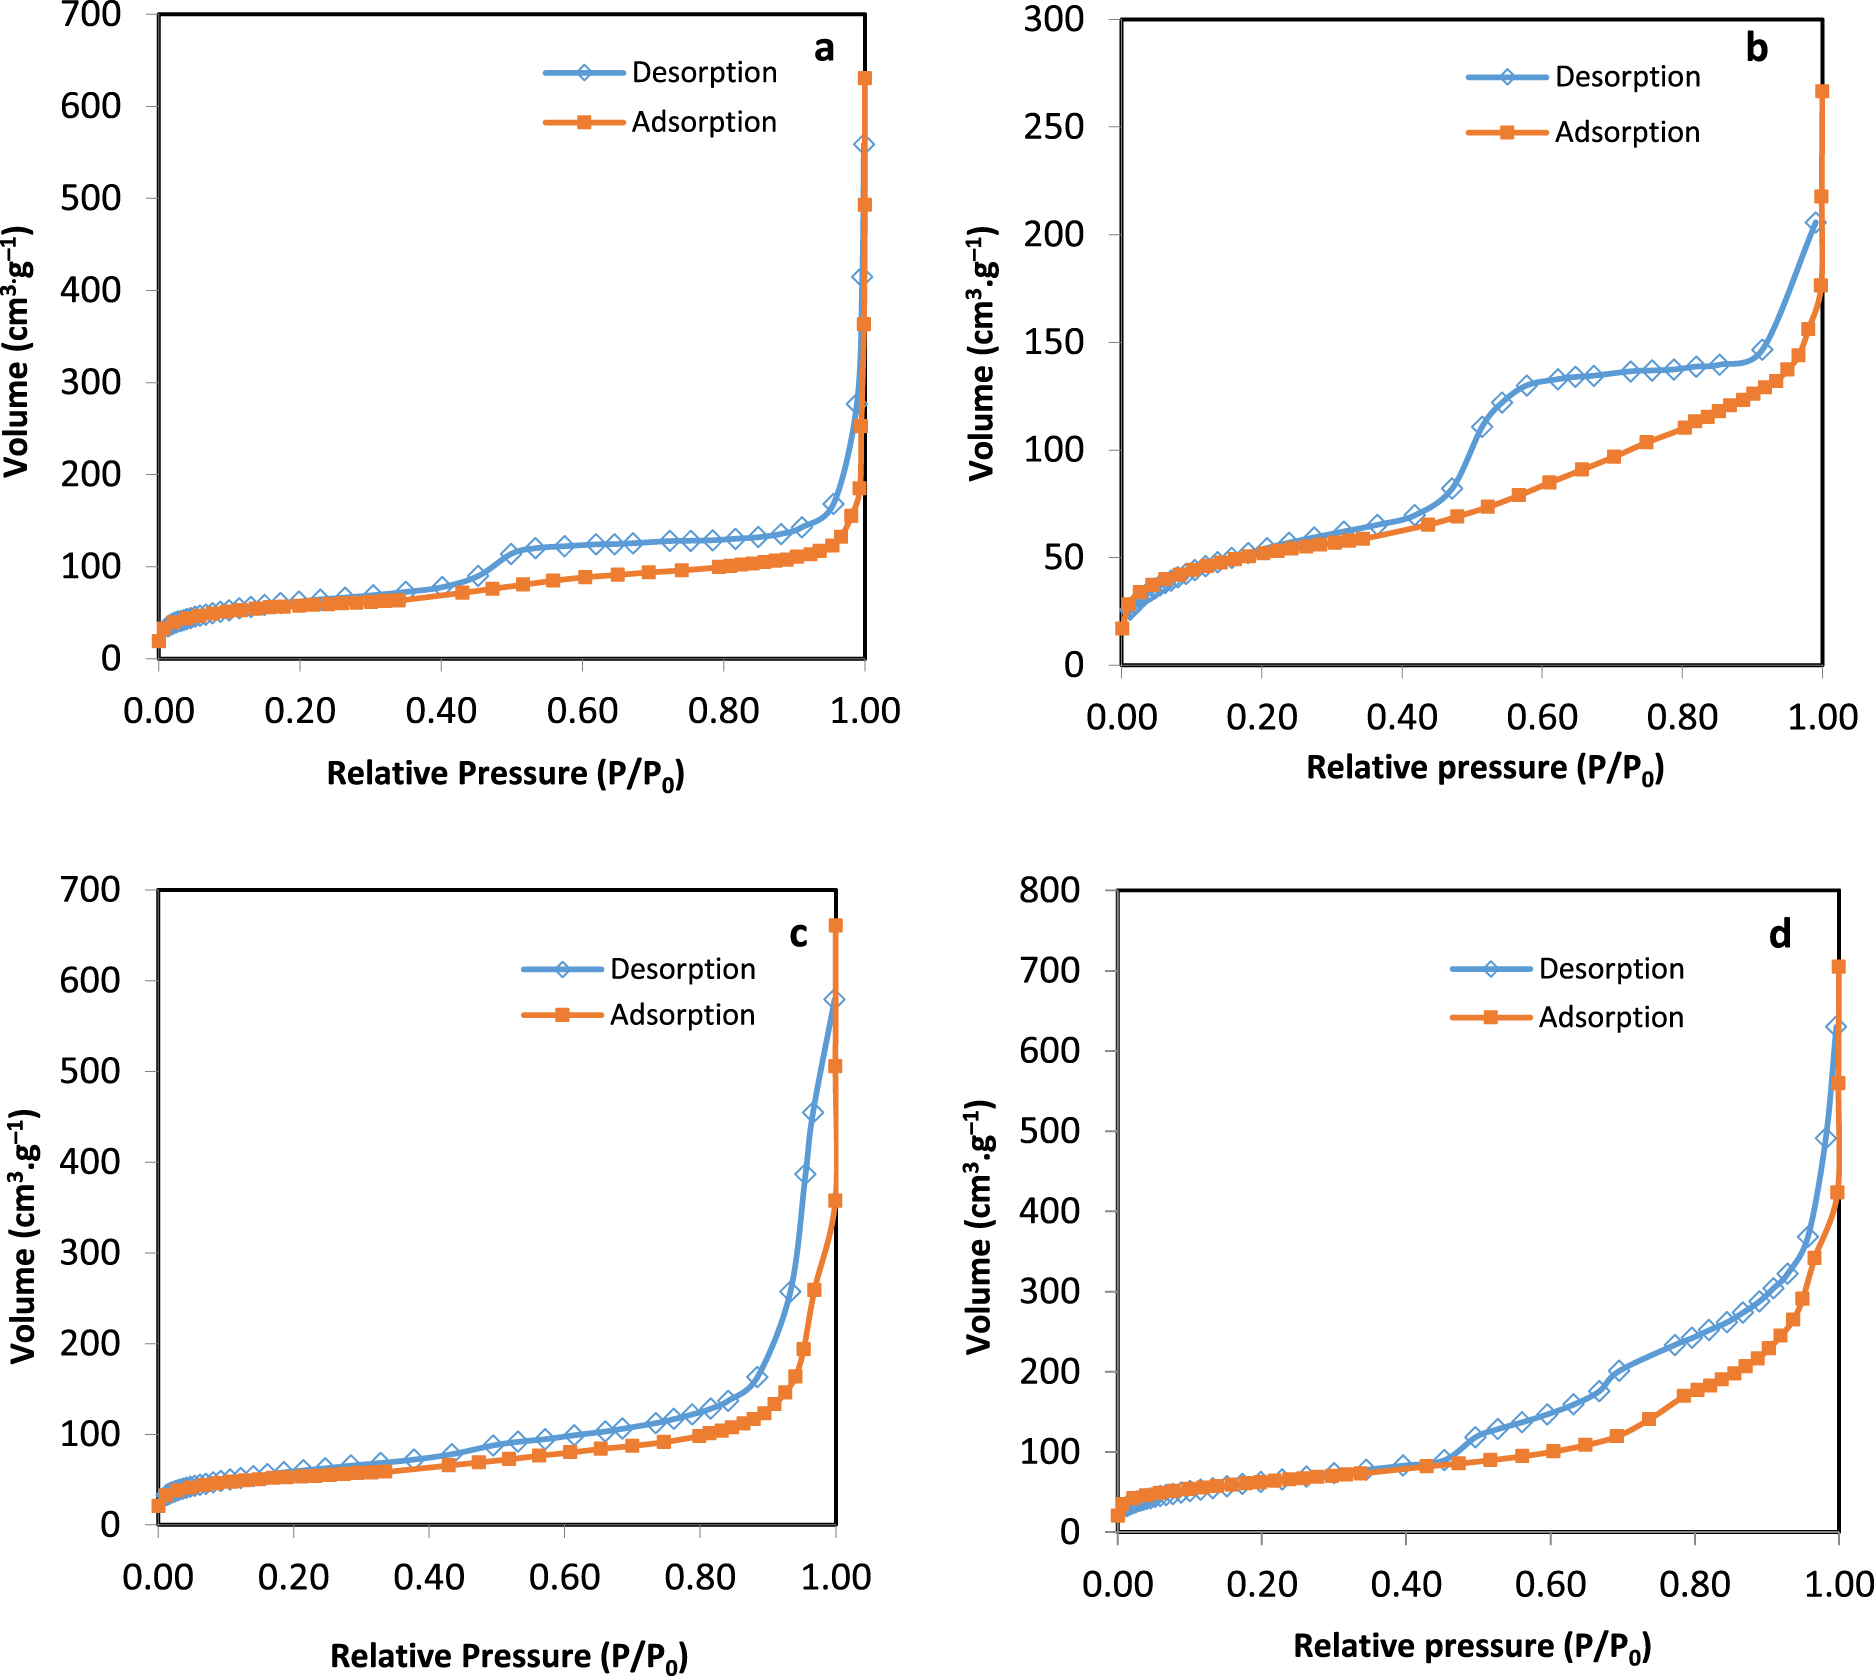
N2 adsorption/desorption for Ni-impregnated samples: (a) Ni-HT-CTAB, (b) Ni-HT-glucose, (c) Ni-HT-P123, (d) Ni-HT-SBA-15.
Different textural properties, given by the porosimetry, for the samples nickel impregnated on the supports
| Samples | ssa (m2⋅g−1) | Pore volume (cm3⋅g−1) | Pore size distribution (nm) |
|---|---|---|---|
| Ni-HT-CTAB | 192 | 0.40 | 5.4 |
| Ni-HT-glucose | 179 | 0.25 | 3.9 |
| Ni-HT-P123 | 174 | 0.41 | 3.6 |
| Ni-HT-SBA-15 | 218 | 0.66 | 3.6 |
3.3. Physicochemical characterization of Ni-impregnated samples calcined at 550 °C
3.3.1. X-ray diffraction (XRD)
XRD study was carried out on the calcined samples before Ni impregnation (curves not shown). After calcination at 550 °C, the hydrotalcite structure was transformed into mixed metal oxides MgAlO-spinel phase and MgO-like phase [15, 21, 42, 43].
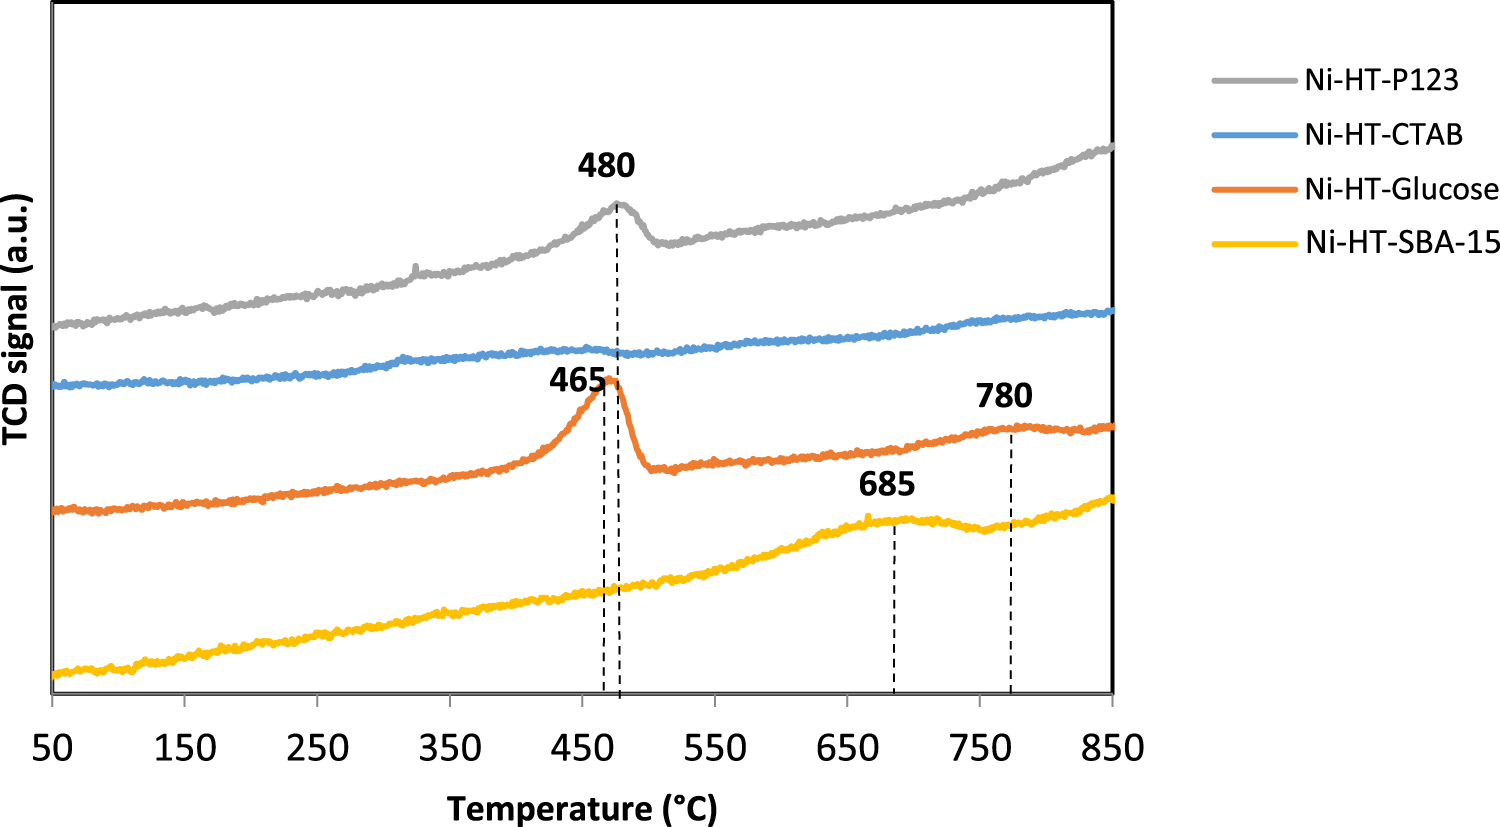
Temperature Programmed Reduction profiles of Ni-impregnated samples calcined at 550 °C.
The X-ray diffractograms of the Ni-supported catalysts are shown in Figure 4. After the impregnation of Ni, the XRD patterns remained the same. No line due to NiO diffraction was detected probably because of the overlapping between diffraction lines of periclase MgO and those of NiO. The oxide phase MgO periclase (JCPDS N° 43-1022) is present in all samples at 2𝜃 = 35, 44, and 64°. The spinel MgAl2O4 (JCPDS N° 075-1796) phase was present in Ni-HT-glucose at 2𝜃 = 46.5° and in Ni-HT-CTAB at 2𝜃 = 40° [26, 31]. As for Ni-HT-SBA-15 sample, the large intense peak present at 2𝜃 = 22.5° is due to the presence of SiO2 phase in the structure which comes from the intercalation of SBA-15 in the hydrotalcite structure [31, 44]. The presence of a slight peak at 2𝜃 = 11.5° for Ni-HT-glucose, as well as a peak at 2𝜃 = 22° for Ni-HT-glucose (very slight), Ni-HT-P123, and Ni-HT-CTAB should also be noted. Till now we were not able to ascribe these peaks.
3.3.2. Porosimetry
Porosimetry for samples after Ni impregnation is done in order to be able to know whether the presence of nickel will modify the textural properties of the samples (will block some pores or decrease the ssa of the sample). While comparing the N2-sorption curves of the samples as given in Figures 3 and 5, one observes a variation in the loop for some samples but always keeping type IV(a) isotherm. The samples containing glucose as surfactant and SBA-15 showed the same hysteresis type before and after nickel impregnation. After Ni impregnation, the hysteresis loop for the samples containing CTAB and P123 became type H3. This modification shows that the cylindrical pores present before impregnation became disordered lamellar with non-uniform (H3) slits’ size. Table 3 shows the ssa, pore volumes, and pore diameter values for the samples after Ni impregnation. The latter values decreased after nickel impregnation, except for Ni-HT-CTAB where the ssa remained the same. The decrease in the values of the textural parameters in the presence of nickel indicates some plugging of the pores by nickel species.
3.3.3. Temperature programmed reduction (TPR)
A TPR analysis was carried out to investigate the reducibility of the catalysts and in order to estimate the interaction between nickel species and the supports. TPR profiles of nickel impregnated on magnesium- and aluminum-based solids calcined at 550 °C are shown in Figure 6. It is worthy to note that no reduction peak is observed in the TPR profiles of the supports without nickel. Indeed, magnesium and aluminum oxides were not reduced in our experimental conditions. Conversely, nickel impregnated samples showed one or two reduction peaks, ascribed to the reduction of different nickel species. These peaks present low intensity probably due to the low amount of nickel impregnated (5 wt%).
The TPR profile of Ni-HT-glucose presents two peaks, indicating the presence of two different species of nickel oxide. The first peak is located at around 465 °C, and the second around 780 °C. The second peak is broad and has a very low intensity. The first peak is attributed to the reduction of nickel oxide in weak interaction with the support and the second one to the reduction of nickel species in strong interaction with the support [45, 46].
As for the sample Ni-HT-P123, it showed a peak of higher intensity at temperatures within 450–550 °C. This peak, as mentioned above, is related to the reduction of NiO in weak interaction with the support [4, 46].
The absence of a reduction peak in the profile of Ni-HT-CTAB could be attributed to two reasons:
- Very strong interaction between nickel species and the support, and as a result the reduction of nickel will take place at temperatures above 900 °C.
- The low amount of nickel particles present are highly dispersed and thus their reduction, not easily detectable, does not lead to the appearance of a reduction peak.
In the profile of the sample Ni-HT-SBA-15, the graph shows one asymmetric reduction peak centered around 685 °C. This reduction peak is attributed to the reduction of nickel oxide strongly bonded and inserted in the structure [46, 47].
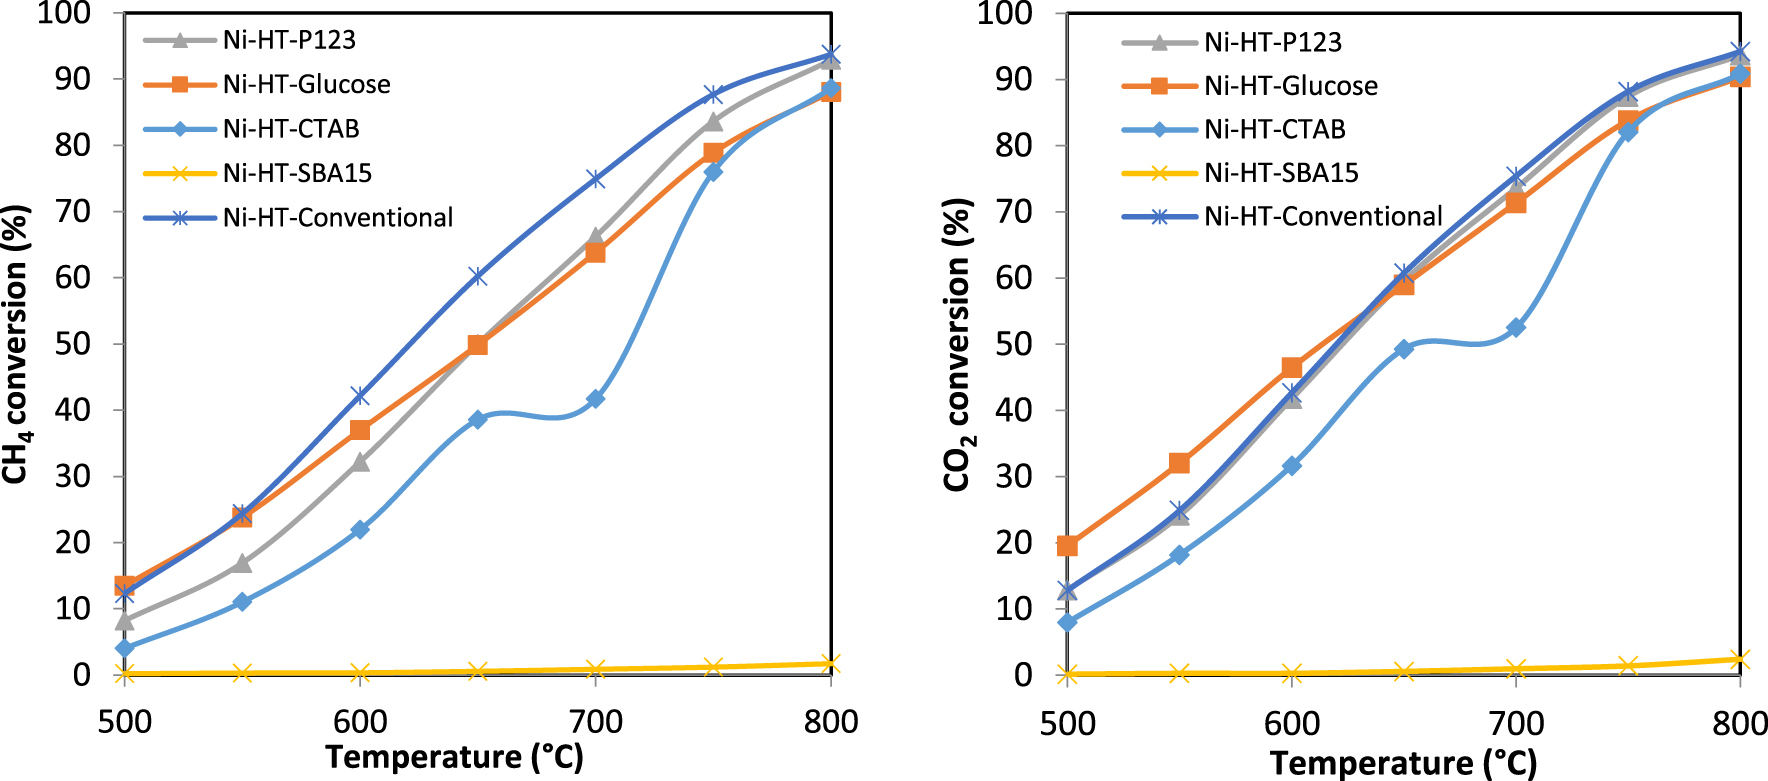
Conversion percentage of CH4 and CO2 versus reaction temperature in dry reforming of methane on the Ni-based catalysts.
3.4. Catalytic tests
The percentages of conversion of methane and carbon dioxide as a function of temperature, during the dry reforming of methane process, are presented in Figure 7. The increase of temperature will favor DRM thermodynamically and kinetically due to the DRM endothermic nature. As a result, an increase in the conversions of the reactants CH4 and CO2 is observed with the increase of the reaction temperature. It could be seen from Figure 7 that the catalysts show similar behaviors in both conversions of CH4 and CO2, except Ni-HT-SBA-15 which shows null conversion of both methane and carbon dioxide. Based on the conversion of CH4 and CO2, it appears that the order of catalytic activity varies with the reaction temperature. For the temperatures range 650–800 °C, according to CH4 conversion, the order of catalytic activity is:
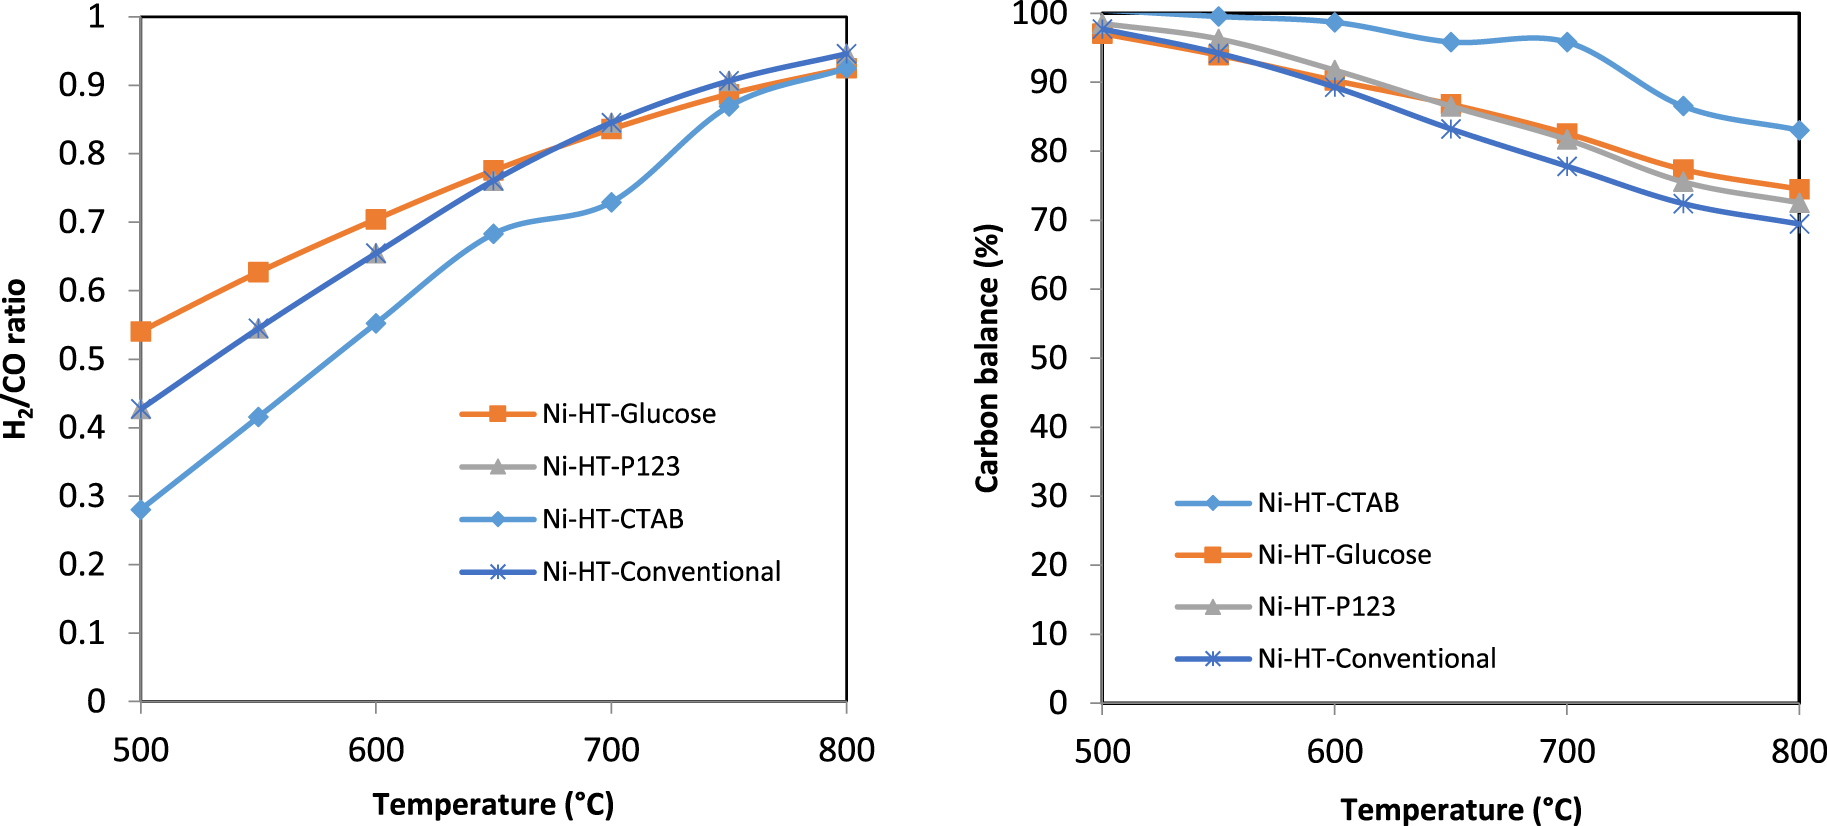
H2/CO ratio and carbon balance for the Ni-based catalysts in dry reforming of methane.
Figure 8 shows the H2/CO ratio and the carbon balance of the studied samples. H2/CO ratio increases with the temperature increase and becomes close to 1 at T = 800 °C. In fact, in our case, equimolar amounts of the reactants CH4 and CO2 were used. Therefore, according to the stoichiometry of DRM reaction, the ratio H2/CO should be equal to 1. A ratio lower than 1, as for our catalysts, suggests that side reactions are taking place along with the DRM such as reverse water gas shift reaction (CO2 + H2 → CO + H2O) which consumes H2 and forms CO. H2/CO ratio close to 1 reveals that almost only DRM reaction is taking place (at about 800 °C). However, in parallel, a carbon balance lower than 100% (at 800 °C) reveals that side reactions also take place, some of them produce H2, some other CO, so that the overall ratio H2/CO is slightly affected. Indeed, at 800 °C, the carbon balance is not 100% on our catalysts. This reveals that side reactions such as reverse water gas shift reaction and methane decomposition (CH4 → C + 2 H2) could take place with different extents. The latter reaction leads to carbon deposition and therefore to a deficit in carbon balance. Figure 8 also shows that the carbon balance is lower for Ni-HT-conventional than for Ni-HT-glucose and Ni-HT-P123. The higher carbon balance obtained for Ni-HT-CTAB is explained by its significant lower activity. The higher carbon balance for Ni-HT-glucose and Ni-HT-P123 indicates that the catalysts prepared with these surfactants have lower carbon deposition even if they show similar (for CO2 conversion) or slightly lower (for CH4 conversions) activities to those of Ni-HT-conventional. The higher carbon balance obtained in all catalysts that contained a surfactant reveals that the tendency to form carbon is less important on these catalysts than on Ni-HT-conventional. It is known that during DRM, the phenomenon of carbon deposition takes place and leads to the deactivation of the catalyst. It should be recalled that this carbon, in case present, comes from the decomposition of methane (CH4 → C + 2 H2), Boudouard reaction, and reverse carbon gasification reaction (CO + H2 → C + H2O), each of these reactions is favored at a given range of temperature. In fact, the high carbon balance, along with relatively high CH4 and CO2 conversions could be attributed to the presence of surfactants throughout synthesis, whose role is to increase the specific surface area of the support [48], therefore favoring the dispersion of the active phase nickel (active phase), improving the catalyst activity, and reducing carbon deposition as well as the catalyst deactivation [41].
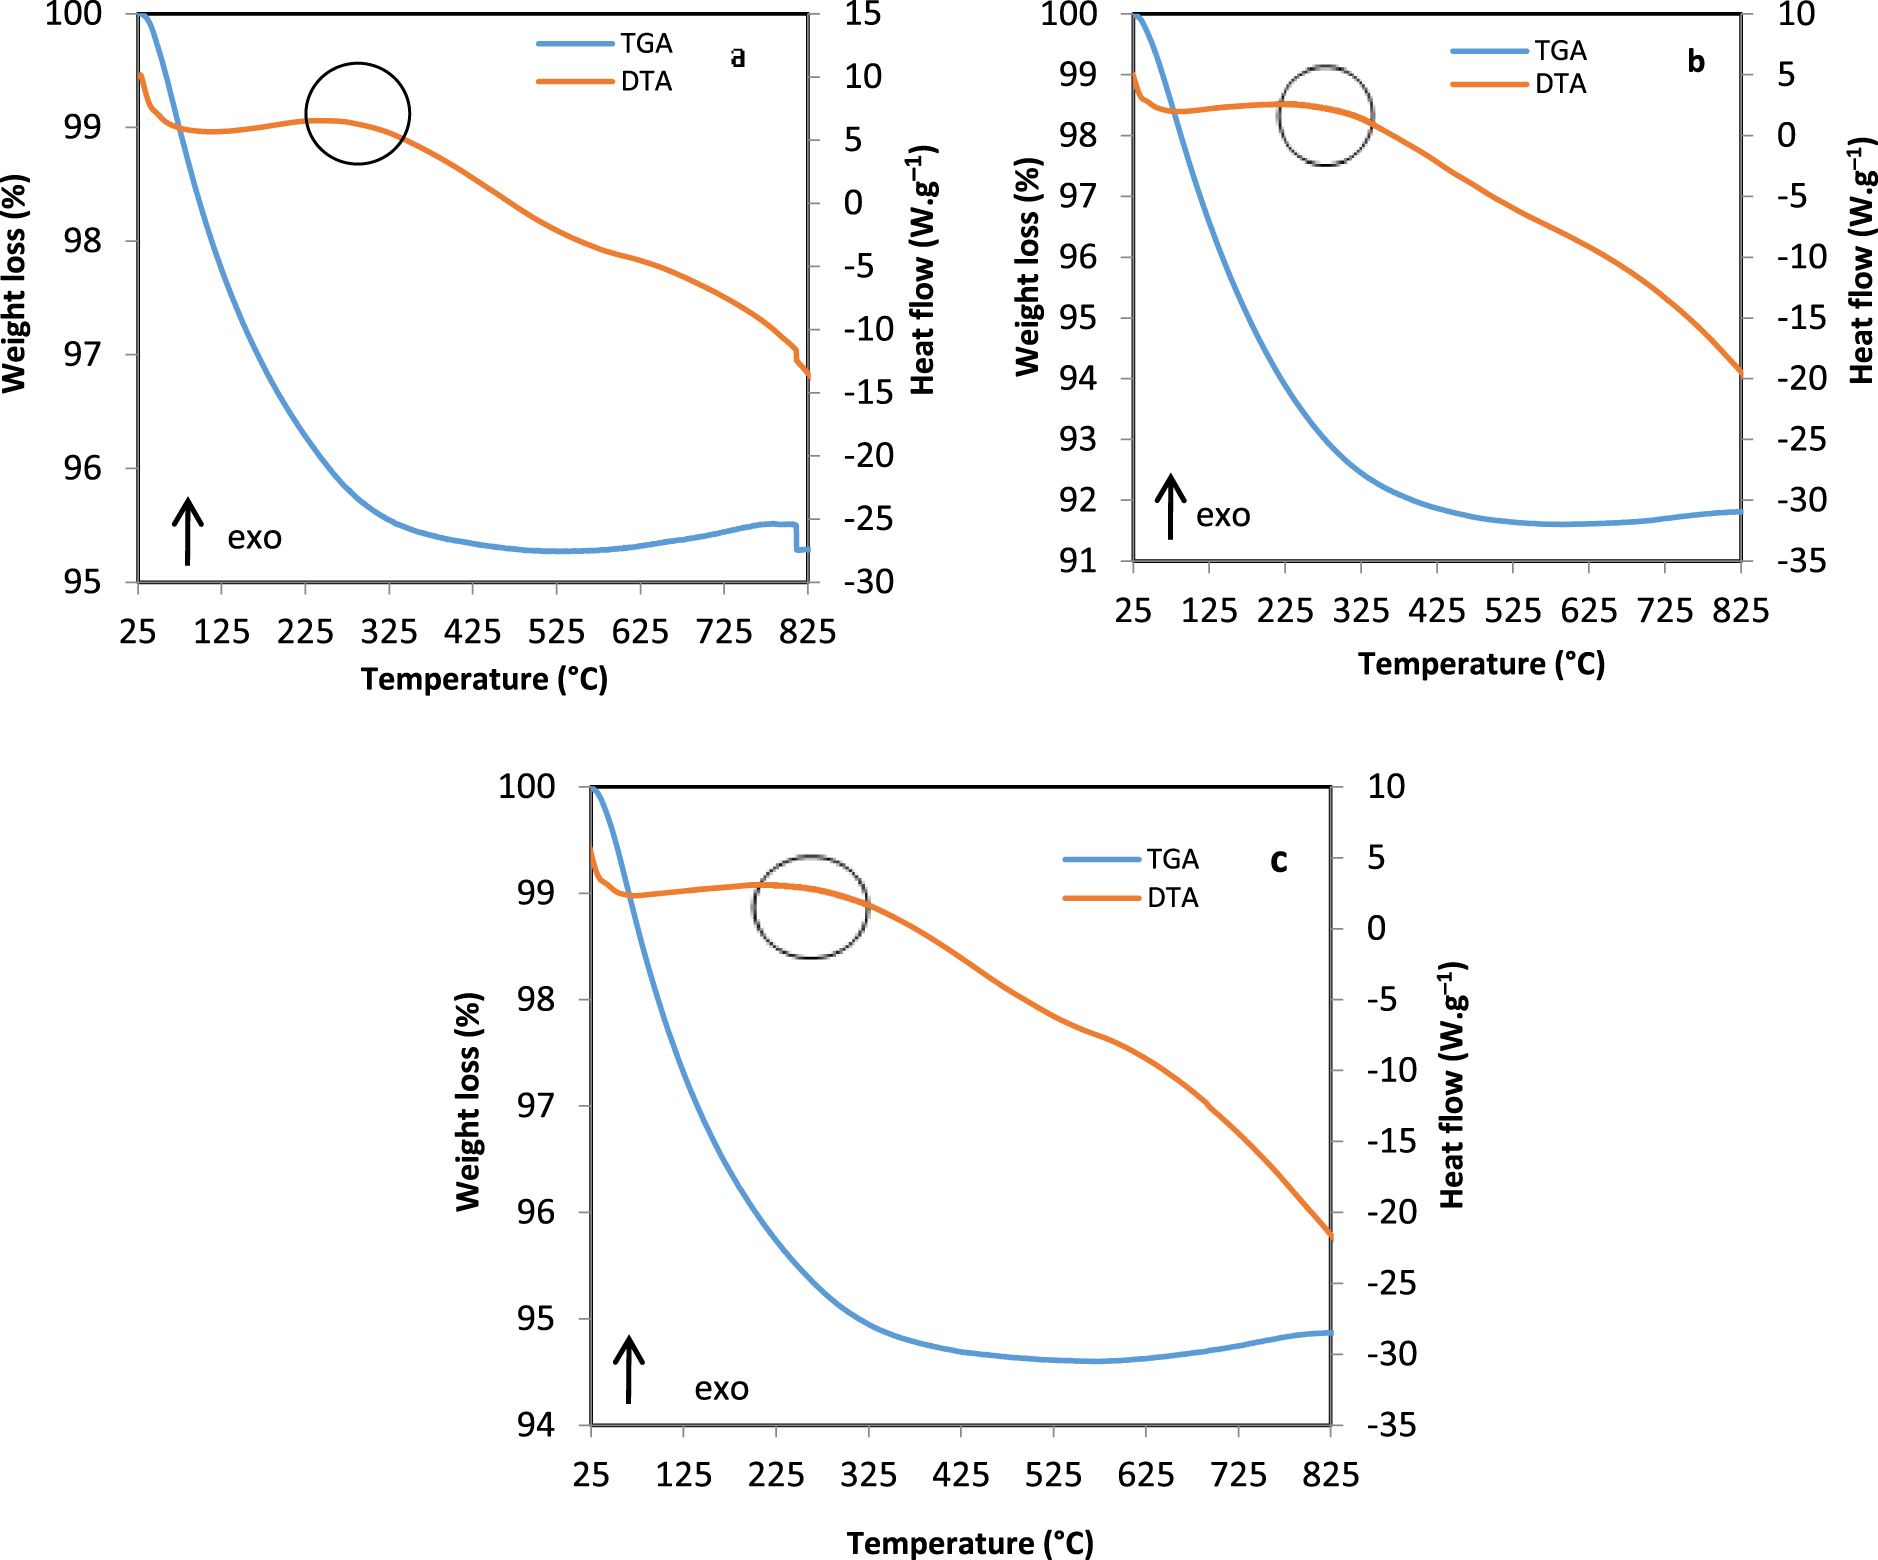
Thermal analysis after DRM for: (a) Ni-HT-CTAB (T), (b) Ni-HT-glucose (T), (c) Ni-HT-P123 (T).
The catalytic behavior of the catalyst containing SBA-15 could be explained by the fact that nickel species on its surface required some time to become active. Indeed, in the work of Tan et al. [22], different surfactants, tetrapropylammoniun hydroxide (TPAOH), P123, poly(vinylpyrrolidone) (PVP), and cetyltrimethylammonium bromide (CTAB), were used to prepare Ni–Mg–Al by hydrotalcite route. After calcination, the oxides were evaluated in DRM at 800 °C under time on stream. The results showed that the oxides prepared with PVP and CTAB did not show catalytic activity before many hours under time on stream. Characterization studies showed that these oxides required some induction time to perform the growth of the plane Ni(200) that plays a key role in CH4 activation for DRM. Conversely, TPAOH promoted the growth of Ni(200) plane and therefore, the corresponding oxide did not necessitate an induction period to become active. In fact, the crystallinity degree and the extent of exposure of Ni(200) play a crucial role in the catalytic behavior in DRM [22]. The effect of the surfactants was not the same in the work of Tan et al. [22]. It is thought that in our case, nickel species may necessitate some time under stream to become active in the oxide based on SBA-15, whereas in the other cases the formation of active nickel species is favored. Further characterization and catalytic tests studies should be performed on the SBA-15 based oxide to confirm our hypothesis.
3.5. Thermal analysis after test
DTA and TGA profiles of catalysts after DRM are shown in Figure 9. TGA curves for Ni-HT-CTAB (T), Ni-HT-glucose (T), and Ni-HT-P123 (T)—(T) designates the sample after test—showed weight losses between 5 and 8%, at around 300 °C accompanied by an exothermic peak in DTA corresponding to the oxidation of carbon present on the surface of materials. The results are in accordance with the carbon balance obtained in DRM (Figure 8) where the carbon balance was lower than 100% during the reaction.
4. Conclusion
The use of surfactants (CTAB, glucose, P123) or the intercalation of SBA-15 during the synthesis of MgAl hydrotalcite (HT) does not alter the structure. The oxides obtained after calcination evidenced more homogeneous pore distribution and higher specific surface area than the oxide derived from conventional HT. These oxides were impregnated by 5 wt% nickel.
In our conditions, no activity is obtained in DRM on Ni-HT-SBA-15 (C), whereas good activities were obtained for all the other samples. However, the oxides derived from the surfactant-based samples showed a slightly higher carbon balance than on the oxide derived from conventional hydrotalcite revealing the formation of lower amount of carbon due to side reactions. High dispersion of nickel is responsible for this lower amount of carbon formed.
Finally, it is interesting to perform studies on the stability of the catalysts under time on stream. Such a study will evidence whether intercalation of SBA-15 in Mg–Al hydrotalcite structure may show a catalytic activity in DRM after a given induction period. In addition, introduction of surfactants (CTAB, glucose, P123) in hydrotalcite structure results in a slight enhancement of the carbon balance. So, performing tests under time on stream may put more into evidence the stability with time of the catalysts with surfactants. Therefore, the longer time required to elaborate such catalysts and their higher cost will be justified by their significantly higher lifetime and lower carbon formation with time.