

 CC-BY 4.0
1. Introduction
Dyes are among the most used substances in the world with a total production of 700,000–1000,000 tons [1]. Because of their chemical stability and the ease of their synthesis, dyes are widely used in a broad range of fields: food industry, paper, cosmetic and particularly in the textile industries [1]. They are generally discharged into the environment as dissolved components in industrial waste waters. Their excessive presence in water bodies could result in an important decrease of dissolved oxygen contents due to the reduction of sunlight penetration into deep areas. This eutrophication phenomenon could cause an important deterioration of the water bodies’ physicochemical and biological quality and therefore a disturbance in the aquatic organisms’ life [2]. When it comes in contact with humans, dyes can cause skin irritation and/or allergic dermatitis and also possible serious diseases for those considered as mutagenic and/or carcinogenic compounds [3].
Methylene blue is a cationic synthetic dye that is usually used in textile and pharmaceutical industries and in the coloring of various materials including wool, cotton, paper and silk. When discharged into the environment, MB can cause damaging impacts to fauna and flora. Exposure to these pollutants could induce severe damage to eyes (humans and animals) and even result in tissue necrosis, methemoglobinemia and mental confusion [4]. Methyl orange (MO) is an anionic dye widely used in textile printing, food and pharmaceutical industries. It can induce dangerous effects on flora and fauna, as well as human and animal health in case of inhalation, ingestion, and contact with eye and skin [5].
Given the confirmed negative impacts of dyes on human health and in water resources, removal of dyes from waste waters has become inevitable and necessary in order to ensure the related industry sustainable development [6]. Up to now, various technologies have been applied separately or as hybrid systems for an efficient elimination of dyes from industrial effluents. They include biological treatment, coagulation/flocculation, membrane separation and advanced oxidation processes [7]. However, these technologies have some drawbacks such as huge sludge production that has to be appropriately handled, low dye removal efficiency and high-energy consumption [6].
Dye removal from discharged industrial effluents through retention by low cost and abundant material-derived adsorbents has been recently pointed out as an attractive and promising technique [8, 9]. The main advantages of this technique are its low cost, handling simplicity and good cost effectiveness [2]. Agricultural by-products, which are produced in huge quantities, have not only been tested as raw materials but also as activated carbons for the enhanced removal of dyes from industrial waste waters. In fact, activated carbons usually dispose of high specific surface area, have well-developed microporosity and richness in specific functional groups which favor the removal from aqueous solutions of dyes and other organic and inorganic pollutants [9]. Various agricultural precursors have been tested for the synthesis of activated carbons for dye removal from aqueous solutions. They include coconut husk, bamboo, jute fibers, rattan sawdust, orange sawdust and so on. [6, 8, 9]. In the Mediterranean region, olive oil extraction is well developed. This operation produces large amounts of solid olive stone by-products and also waste waters with possible negative impacts on the environment. According to Marks et al. [10], in 2017, the produced olive mill solid wastes were evaluated to 4.336, 0.450 and 1.050 million tons in Spain, Tunisia and Greece, respectively. The sustainable management of these wastes, therefore, represents an important challenge. Various management options have been tested and applied at laboratory scale for these by-products. They include their adapted treatment [11], their thermal conversion into biofuels and biochars for energetic, environmental and agronomic purposes [11, 12, 13, 14, 15] and also their turning into activated carbons for liquid and gaseous effluent treatment [16, 17, 18]. The characteristics of the olive stone derived activated carbons (OSAC) depend mainly on the used activating agent and concentration as well as the heating temperature and residence time [16, 18, 19]. ZnCl2 represents one of the best activating agents permitting the derived activated carbon to have attractive physicochemical characteristics [20, 21]. OSAC have exhibited important adsorption capacities of dyes [16], pharmaceuticals [18], heavy metals [20] and also gaseous pollutants [22]. However, the majority of these studies were realized in batch mode and generally focus on a single dye removal without a precise assessment of the involved mechanisms.
Therefore, the main aim of this work is to study, under various experimental conditions, the valorization of activated carbons generated from the activation of olive stones with an efficient impregnating agent, ZnCl2, for the removal of cationic and anionic dyes. Practically, the specific objectives of this experimental investigation are: (i) assessment of the impact of heating temperatures on the properties of the generated activated carbons, (ii) investigation of the efficiency of these OSAC in removing both anionic and cationic dyes under different experimental conditions and (iii) exploration of the possible involved mechanisms for both cases.
2. Materials and methods
2.1. Adsorbent preparation
The natural olive stone (NOS) wastes used in this study were collected from an olive oil industry in Ben Guerdane city, south of Tunisia. They were washed with distilled water and then dried in an oven for 24 h at 110 °C. Afterward, they were grounded and sieved to obtain light brown particles with dimension between 0.05 and 0.25 mm. Four OSAC were then prepared at four different temperatures (300, 400, 450 and 500 °C) by using a professional Muffle Furnace (Nabertherm L24/11). They were baptized OSAC 300 °C, OSAC 400 °C, OSAC 450 °C and OSAC 500 °C, respectively. Based on preliminary experiments (data not shown), all these OSAC porous media were produced for a constant (ZnCl2:NOS) mass ratio of 2:1 and a contact time of 2 h. The obtained activated carbons were washed several times with distilled water until a constant pH of the washing solutions. Finally, these samples were dried in a laboratory oven for 2 h at 80 °C.
2.2. Material characterization
The NOS as well as the generated OSAC were physicochemically characterized by using various methods and analyses with specific apparatus. They included the assessment of the N2 adsorption–desorption profiles at 77 K according to the Brauner–Emmet–Teller (BET) method by using a Quantachrome Autosorb 1-MP apparatus. For each material, the specific surface area was assessed through the BET method and the pore volume was determined from the volume of nitrogen held at a relative pressure of P∕Po = 0.99. Besides, the micropores’ surface and volume were estimated from the t-plot method. The impact of the NOS activation by ZnCl2 on its morphology was assessed through scanning electron microscopy (Philips Fei Quanta 200). Furthermore, the surface chemistry of the materials was apprehended through complementary analyses including the assessment of: (i) the pH of zero-point-charge (pHzpc), and (ii) the main surface functional groups through Boehm titration and FTIR analysis. The pHzpc was determined according to the method given by Mohan et al. [23]. During these assays, the material (0.15 g) was mixed with 50 mL of distilled water containing 0.01 M NaCl at different initial aqueous pH values (pHi) for 48 h. The used initial pH values were fixed to 2, 4, 6, 8, 10 and 12 by using 0.1 M HCl or NaOH solutions. The pHzpc of the materials were determined from the plateau of the curve of the measured final pH (pHf) versus (pHi).
The Boehm titration method aims to determine the oxygenic function contents in the studied materials [24]. During this titration, 1 g of each tested material was put in contact with 50 mL of sodium hydroxide (NaOH), sodium carbonate (Na2CO3) and sodium bicarbonate (NaHCO3) at 0.1 M for 24 h. This method was based on the fact that the strongest base, NaOH, neutralizes phenolic, lactonic and carboxylic groups. The NaHCO3 neutralizes the lactonic and carboxylic groups, while the weakest base, Na2CO3, neutralizes only the carboxylic acids. The acidic and basic functional groups were determined by titration of the filtrated aliquots against 0.05 M HCl and 0.05 NaOH solutions, respectively.
Furthermore, the Fourier transform infrared (FTIR) technique was used in order to identify the main functional groups present on the NOS and the derived activated carbon at different temperatures. For this aim, infrared spectra of these materials were assessed with a FTIR spectrometer (Perkin Elmer). The spectra were recorded within a wave number range of 4000–400 cm−1 for a spectral resolution of 2 cm−1.
2.3. Preparation and analysis of dye solutions
The used MB (chemical formula (CF): C16H18ClN3S; molar weight (MW) = 319.852 g⋅mol−1) and MO dyes (CF: C14H14N3 O3S−Na+; MW = 327.34 g⋅mol−1) were purchased from Sigma-Aldrich (Figure 1). They were used during this adsorption study for the preparation of synthetic solutions.
During the adsorption tests, two stock MB and MO solutions of 1000 mg⋅L−1 were prepared and used for the preparation of solutions at given concentrations. MB and MO removal efficiencies were assessed through the determination of their absorbance decline versus time at 664 nm and 460 nm, respectively, by using an UV spectrophotometer (Perkin Elmer, Model UV Lambda 20).
2.4. Adsorption experiments
Batch adsorption experiments have been performed in order to assess the efficiency of NOS and its derived activated carbon in removing MB and MO from aqueous solutions under various key experimental conditions. All these experiments were carried out at room temperature (25 ± 2 °C) in capped flasks. During these assays, a 0.1 g of the following materials was shaken in 50 mL of MB or MO solutions during a fixed time at 100 rpm by a magnetic shaker (Rotary agitator Reax2 (Heidolph)). The residual dissolved MB or MO concentrations were determined by using a UV-visible spectroscopy apparatus after centrifugation at 2500 rpm for 5 min with a Centrifuge Hermle Z300 apparatus.
All the experiments cited below were performed in triplicate and the mean values were given in this study. The standard deviation for all assays was lower than 5%.
Chemical structures of the used dyes: methylene blue and methyl orange.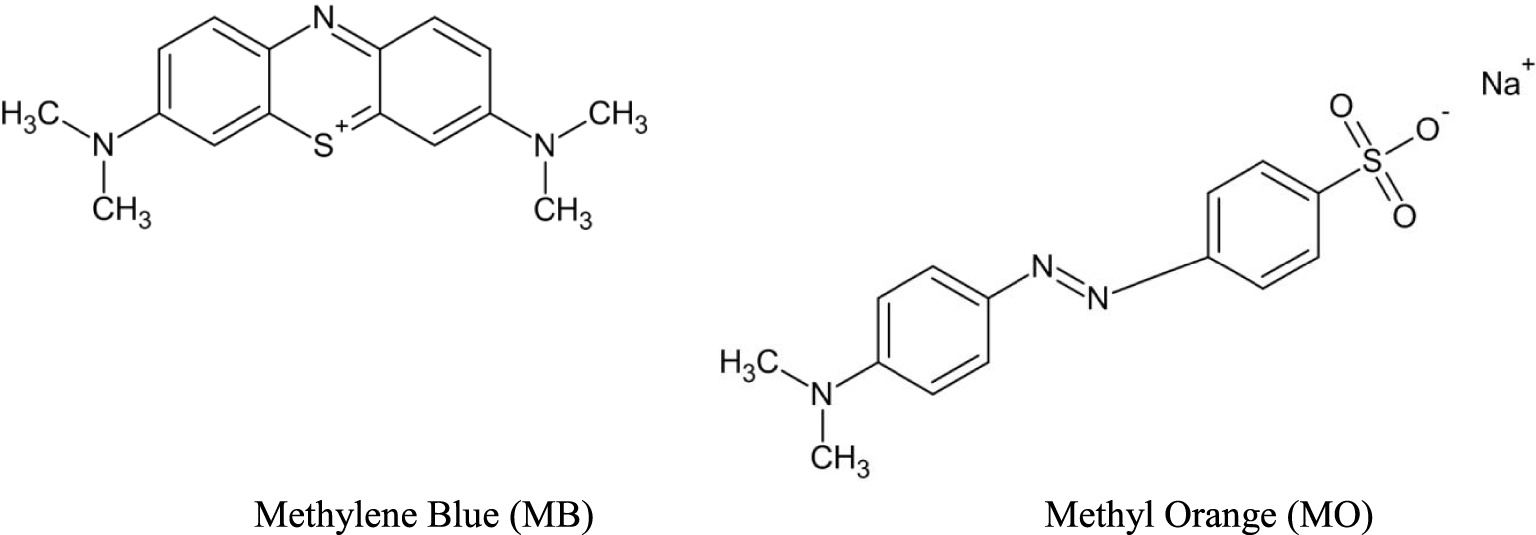
Textural properties of NOS and its derived ZnCl2 activated carbon at different temperatures
| Adsorbents | SBET (m2⋅g−1) | S𝜇 (m2⋅g−1) | VT (cm3⋅g−1) | V𝜇 (cm3⋅g−1) |
|---|---|---|---|---|
| NOS | 16 | 0 | 0.03 | 0 |
| OSAC 300 °C | 200 | 160 | 0.11 | 0.10 |
| OSAC 400 °C | 740 | 595 | 0.57 | 0.25 |
| OSAC 450 °C | 400 | 320 | 0.18 | 0.15 |
| OSAC 500 °C | 300 | 250 | 0.137 | 0.11 |
(SBET: total specific surface area; S𝜇: micropores surface area; VT: total pores volume; V𝜇: micropores volume).
2.4.1. Effect of contact time-kinetic study
The MB or MO removal kinetic by the NOS and the derived activated carbon was assessed at various times: 30, 60, 90, 120, 180, 240, 360, 480, 600, 720 and 1440 min. These assays were performed for constant adsorbents dosage of 2 g⋅L−1 and a fixed pH of 8 and 5 for MB and MO, respectively.
The MB or MO adsorbed quantities at a given time “t”, (qt) and the related removal yield (Yt) were assessed as follows:
| (1) |
| (2) |
The MB and MO adsorption kinetics measured data were fitted to three well-known models, namely pseudo-first order (PFO), pseudo-second order (PSO), and intraparticle and film diffusion models. The original as well as the linearized equation of these models are widely cited in the literature [25, 26]. The agreement between the measured and the calculated adsorbed amounts was determined according to the estimated values of the determination coefficients as well as the calculated average percentage errors (APEkinetic):
| (3) |
2.4.2. Impact of initial aqueous pH
The used initial pH values have a very important impact on ionic dye removal efficiency by adsorbents. In our case, MB and MO adsorption by the NOS and its derived activated carbon was performed for initial pH values of 2, 4, 5, 7, 8, 9, 10 and 12. The used adsorbent dose and contact time were fixed to 2 g⋅L−1 and 6 h, respectively.
2.4.3. Effect of initial concentration-isotherm study
The effect of the initial dyes’ concentrations on their removal efficiency by the NOS and OSAC were assessed at an equilibrium state for a contact time of 360 min, a pH = 9 for MB, a pH = 3.5 for MO and adsorbents dose of 2 g⋅L−1. The tested dye concentrations were fixed to 30, 75, 125, 250, 500 and 1000 mg⋅L−1. The measured data were confronted to famous models namely: Freundlich, Langmuir and Dubinin–Radushkevich (D–R) models. These model equations, assumptions and implications were widely cited in the bibliography [21, 26, 27]. The fitting goodness between the measured and theoretical adsorbed amounts by the three used models and the two tested dyes was calculated as follows:
| (4) |
3. Results and discussion
3.1. Adsorbents characterization
3.1.1. Textural and structural properties
3.1.1.1. N2 adsorption–desorption isotherms
The adsorp- tion–desorption isotherms of N2 at −196 °C by the NOS and its 4 derived activated carbons at 300, 400, 450 and 500 °C are shown in Figure 2. Based on the classification adopted by the International Union of Pure and Applied Chemistry (IUPAC), the activated carbons exhibited the type I isotherms corresponding to microporous materials. It is important to underline that, by increasing the temperature up to 400 °C, the amount of N2 adsorbed increases (this indicates the gradual development of the porous structure), then it decreases (which is explained by the deterioration of porous structure). A similar trend was found by Mojoudi et al. [28] when studying phenol adsorption onto activated carbons generated from oily sludge. Moreover, the activated carbons prepared with different temperatures present hysteresis loops indicating the existence of mesopores [29].
N2 adsorption isotherms of NOS and its derived ZnCl2 activated carbon at different heating temperatures.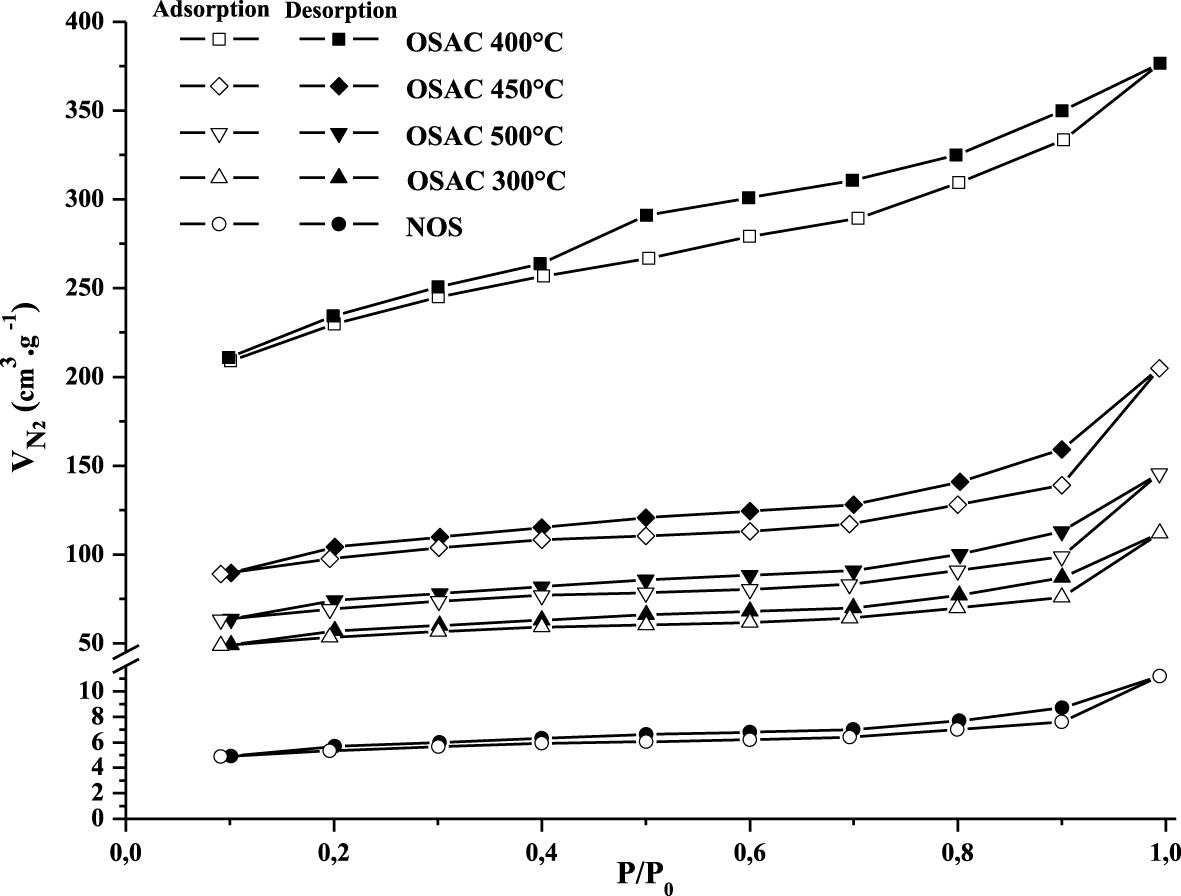
The textural characteristics of the tested materials are given in Table 1. Compared to the raw biomass, activation with ZnCl2 has an important effect on the textural characteristics of the NOS-derived activated carbons. Indeed, this operation has significantly developed the pores structure. It appears that the values of the BET surface area, the surface area of the microporous pores, the total porous and microporous volumes significantly rise with the increase of the used heating temperature until a temperature of 400 °C, then, decrease even if the temperature increases. The highest values of these parameters (obtained at a temperature of 400 °C) were assessed to 740 m2⋅g−1, 595 m2⋅g−1, 0.57 cm3⋅g−1 and 0.25 cm3⋅g−1 for the SBET, the surface microporous area, the total porous and microporous volumes, respectively. These values were about 270%, 271%, 418%, 150% and “146%”, “85%”, “216%”, “66%” higher than the values obtained at temperatures of 300 °C and “500 °C”, respectively. This outcome might be attributed to the contraction of the porous structure, destruction of micropores and the decrease of the surface area for used temperatures higher than 400 °C [28].
Similar findings have been reported by Mojoudi et al. [28] and Mahmoudi et al. [21] when they studied the activation of oily sludge and lignite by potassium hydroxide and zinc chloride, respectively. For instance, when activating oily sludge by KOH (impregnation ratio of 1:1), the highest values of specific surface area, total porous volume and micropores were obtained at a heating temperature of 800 °C; these parameters then decreased when rising the used temperatures [28].
3.1.1.2. SEM analyses
The olive stones and its derived activated carbon at 400 °C surface morphology were investigated by SEM. The related images at different scales are presented in Figure 3. It can be deduced that the activation with ZnCl2 has favored the development of cavities and micropores on the OSAC 400 °C. This activated carbon has cavities and cracks on their external surfaces. Similar findings were registered by Ibn Ferjani et al. [30], Limousy et al. [18] and Eren et al. [31] for raw marc grapes pyrolyzed at various temperatures and olive stones activated by phosphoric acid and zinc chloride, respectively.
SEM images of NOS (a,b) and the derived ZnCl2-activated carbon at a heating temperature of 400 °C (c,d).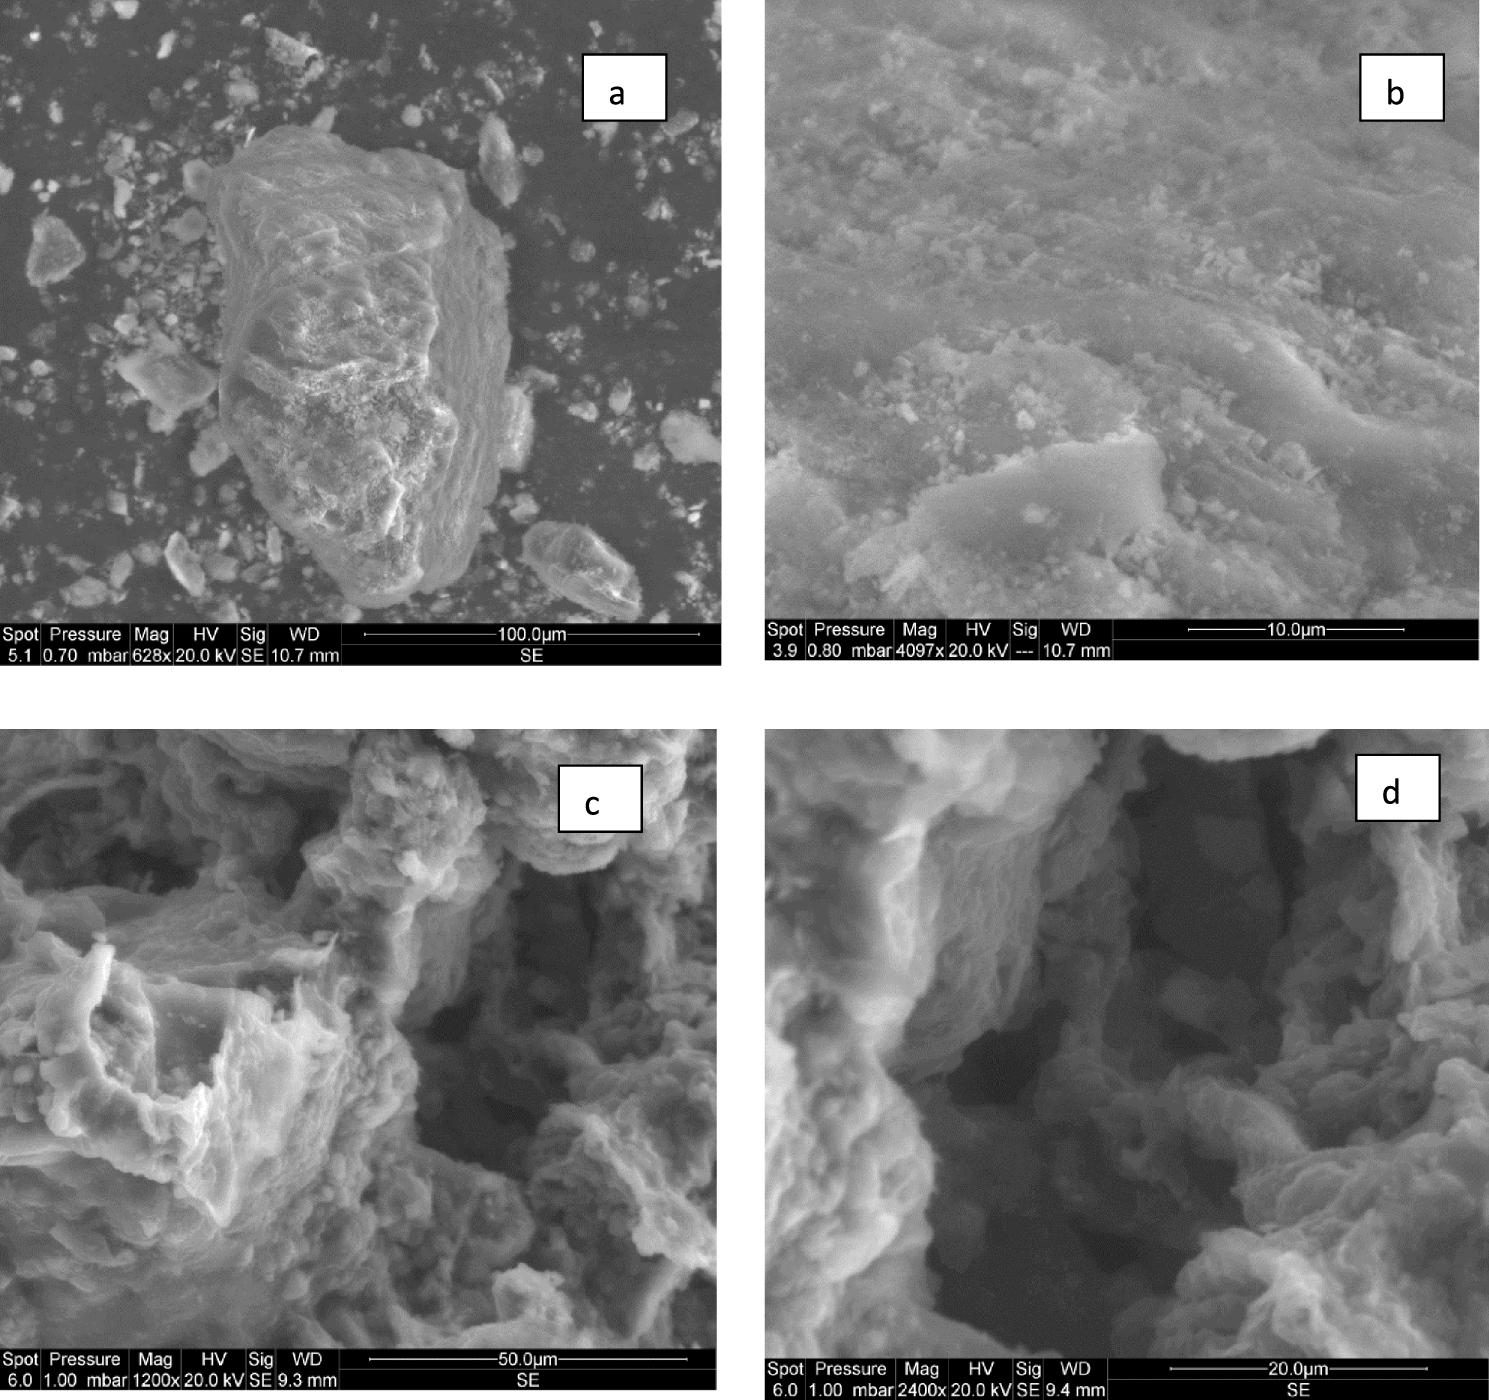
3.1.2. Surface chemistry
3.1.2.1. The point of zero charge
The determination of the pHzpc of the NOS and OSAC 400 °C was carried out with respect to the experimental protocol presented in Section 2.2. The ZnCl2 activation of the NOS has decreased its pHzpc from 5.5 to 4.6. This decrease could be imputed to the acidification of the adsorbent surface. Similar behavior has been reported by Erdem et al. [32] and Uner et al. [33] when activating by zinc chloride vine shoots and waste watermelon rind, respectively. They found pHzpc values for their activated materials of 4.8 and 4.5, respectively. It is worth mentioning that for aqueous pH higher than pHzpc, adsorbent surfaces will be negatively charged and consequently adsorption of cationic dyes should be favored and vice versa [34].
3.1.2.2. Boehm titration
The functional groups existing on the surface of the NOS and the ZnCl2-derived activated carbon at a heating temperature of 400 °C (having the best textural properties) were determined according to the explained protocol in Section 2.2. Experimental results (Table 2) showed that for natural olive stones, the total acidic and basic group contents were assessed to 3.30 and 2.03 mmol⋅g−1, respectively.
Acidic and basic functional groups of NOS and its derived ZnCl2 activated carbon at a temperature of 400 °C
| Adsorbents | Acidic functions (mmol⋅g−1) | Basic functions (mmol⋅g−1) | |||
|---|---|---|---|---|---|
| Carboxylic groups | Phenolic groups | Lactonic groups | Total acid | ||
| NOS | 0.60 | 2.00 | 0.70 | 3.30 | 2.03 |
| OSAC 400 °C | 1.90 | 1.00 | 0.80 | 3.70 | 1.00 |
FTIR spectra of NOS and its derived ZnCl2-activated carbon at different heating temperatures.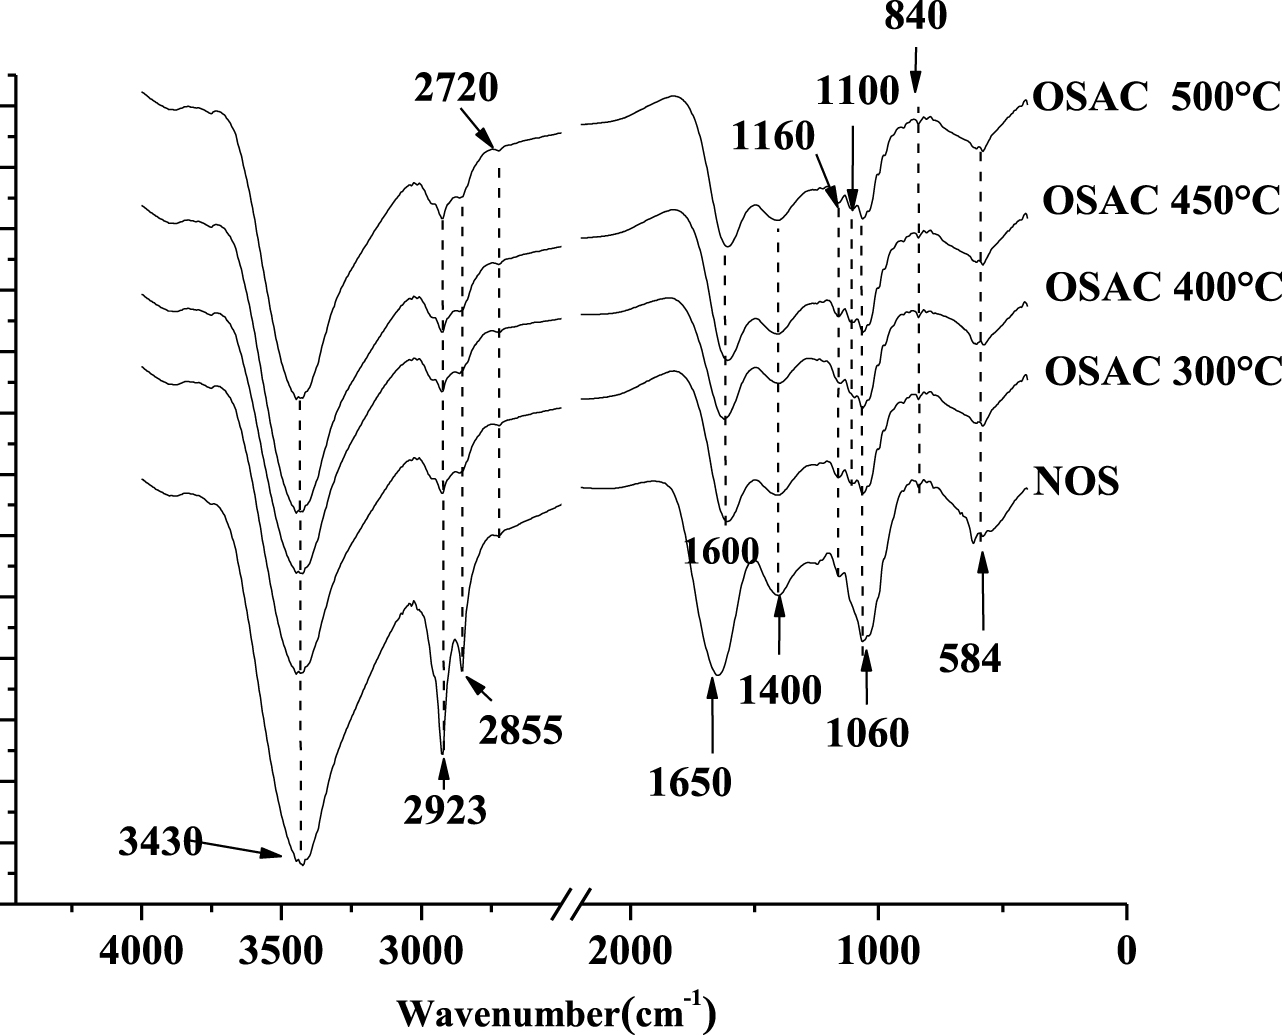
The use of zinc chloride in the activation process provides supplementary amounts of acidic groups on the OSAC 400 °C surface (especially carboxylic groups). After activation, the acidic functional groups increase by 12.1%, whereas the total basic sites decrease the OSAC by 50.7%. The formation of acidic surface groups is due to the reactions between zinc chloride and oxygen with the raw material [35]. Indeed, the ZnCl2 oxidation can occur at a temperature range of 400–600 °C as follows:
A similar trend was registered by Bohli et al. [36] when studying date pits activation by zinc chloride. They found that the total acidic groups have increased from 2.5 to 5.9 mmolg−1 and the total basic contents decreased from 1.82 to 0.72 mmol⋅g−1.
3.1.2.3. FTIR spectroscopy
The FTIR spectra of NOS and the generated ZnCl2 activated carbons at different heating temperatures are given in Figure 4. For all the analyzed samples, the stretching vibrations of the OH groups (alcohols, phenols and carboxylic acids) observed at around 3430 cm−1 was partly attributed to the residual presence of adsorbed water in the carbons [19]. The C–H stretching bands at about 2920 and 2850 cm−1 were observed for all the samples [21, 37]. However, their intensities decrease with the increase of the heating temperature [29, 38]. This behavior could be imputed to the volatilization, mineralization or degradation of the readily available molecules and metabolites [39]. The absorption band observed at 1650 cm−1 correspond to C =O stretching vibration of carbonyl groups [37] and the ones at 3430 and 1060 cm−1 are associated to O–H stretching vibration of hydroxyl groups [21, 38] and C–O stretching vibrations in phenols, alcohols, ester or ether groups [37], respectively. For all the studied activated carbons, a band occurring at 1600 cm−1 was observed; it corresponds to axial deformation of carbonyl groups [17]. Moreover, the bands observed at 1400 cm−1 correspond to C =O stretching and C–O stretching in carboxylic groups [17, 21]. The absorption band observed at 584 cm−1 corresponds to in-plane ring deformation [40]. These functional groups can significantly influence the adsorption of both the tested dyes. It is important to underline that the FTIR analyses confirm the abundance of acidic groups that were already highlighted by the Boehm titration analysis.
MB (a) and MO (b) kinetic removal by NOS (C0,MB = 125 mg⋅L−1; C0,MO = 75 mg⋅L−1) and OSAC 400 °C (C0,MB = 500 mg⋅L−1; C0,MO = 500 mg⋅L−1) and their fitting with PFO and PSO (adsorbent dose = 2 g⋅L−1; T = 25 ± 2 °C).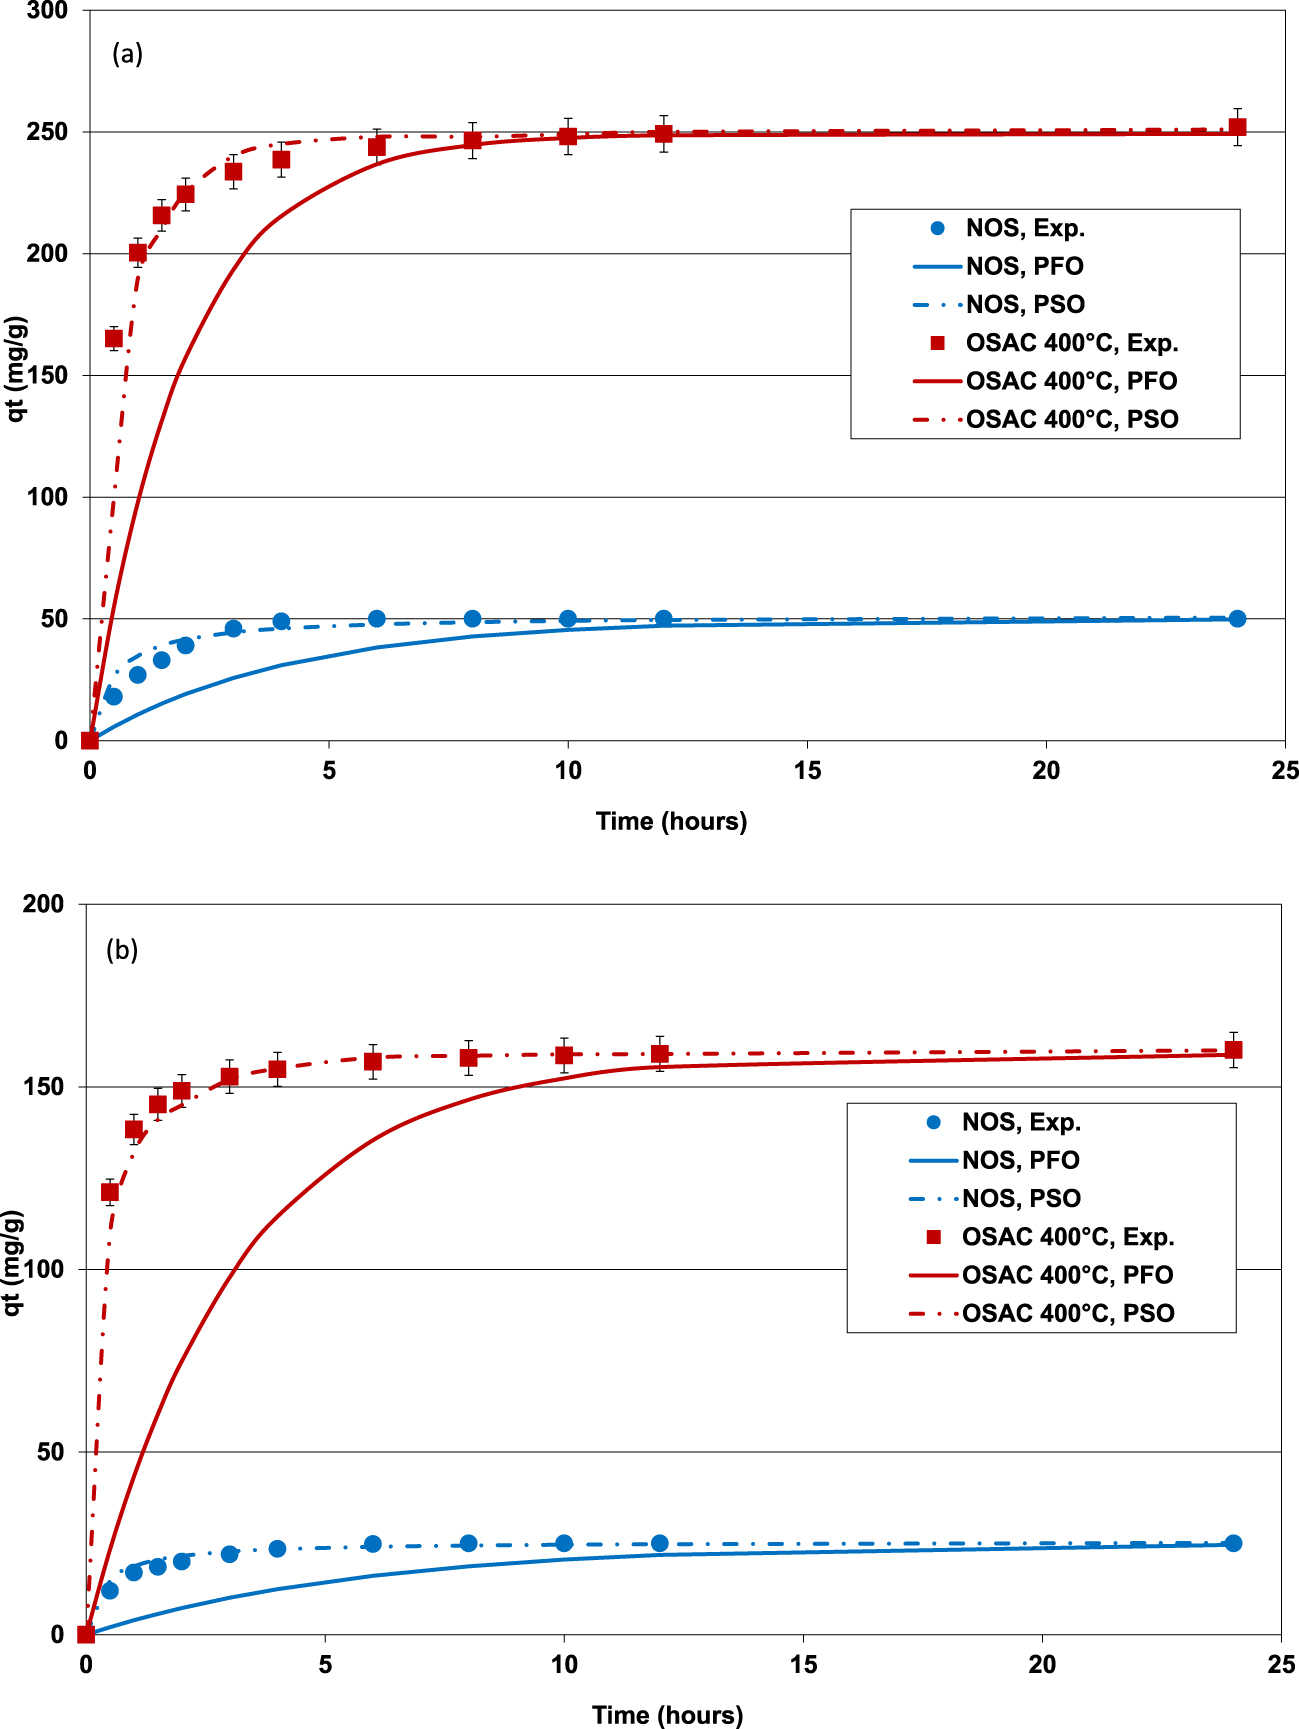
Estimated kinetic model parameters during the adsorption of MB and MO onto NOS and derived activated carbon
| Adsorbent | Dyes | PFO model | PSO model | Diffusion model | |||||||||
|---|---|---|---|---|---|---|---|---|---|---|---|---|---|
| qe,exp (mg⋅g−1) | k1 (h−1) | R2 | APE (%) | k2 (g⋅mg−1⋅h−1) | qe,calc (mg⋅g−1) | R2 | APE (%) | Df (×10−14 m2⋅s−1) | R2 | Dip (×10−14 m2⋅s−1) | R2 | ||
| NOS | MB | 50.0 | 0.242 | 0.804 | 33.5 | 0.040 | 51.6 | 0.948 | 10.9 | 7.789 | 0.999 | 35.060 | 0.991 |
| MO | 25.0 | 0.173 | 0.665 | 44.1 | 0.106 | 25.6 | 0.978 | 5.7 | 10.560 | 0.989 | 17.880 | 0.993 | |
| OSAC | MB | 249.2 | 0.499 | 0.844 | 18.2 | 0.014 | 254.8 | 0.941 | 7.5 | 4.385 | 0.997 | 9.104 | 0.973 |
| 400 °C | MO | 158.9 | 0.319 | 0.593 | 31.1 | 0.037 | 161.2 | 0.993 | 2.0 | 4.872 | 0.998 | 6.322 | 0.955 |
(C0,MB = 125 mg⋅L−1; C0,MO = 75 mg⋅L−1) and OSAC 400 °C (C0,MB = 500 mg⋅L−1; C0,MO = 500 mg⋅L−1; adsorbent dose = 2 g⋅L−1; T = 25 ± 2 °C).
3.2. Dye adsorption
3.2.1. Kinetic studies of MB and MO removal
The effect of contact time on the adsorption of both dyes (MB and MO) by the NOS and its derived ZnCl2-activated carbon at a temperature of 400 °C was determined for the experimental conditions cited in Section 2.4.1. The experimental results (Figure 5a,b) showed that it is a time-dependent process. Indeed, MB and MO adsorption was very fast at the beginning of the experiments since about 90.3% and 91.3% of the totally adsorbed amounts of MB and MO by OSAC 400 °C were removed after a duration of only 2 h, respectively. This step is generally imputed to diffusion through the boundary layer. Then, MB and MO continue to be adsorbed by the used materials but with a slower rate. This phase could be attributed to intraparticle diffusion of the dyes inside the porous structure of the used adsorbents [41, 42]. The equilibrium state which corresponds to quasi-constant adsorbed dye amounts was registered after about 6 h. This time is relatively higher than those determined by Gong et al. [43] when studying BM and MO removal by activated carbons derived from finger citron residue. It is, however, lower than the ones reported for the adsorption of MO and MB by activated carbons modified with silver nanoparticles [44]. It is worth mentioning that low equilibrium contact times is particularly important for the economic viability of the process when up-scaled to field conditions.
At equilibrium, the adsorbed MB and MO by OSAC 400 °C were determined to 249 and 158 mg⋅g−1, which are about 5.0 and 6.3 higher than the ones determined for NOS. This is attributed to the more interesting physicochemical characteristics of the OSAC compared to the NOS, especially its texture (see Table 1) and surface chemistry (see Table 2 and Figure 3). On the other hand, for both NOS and OSAC 400 °C, MB adsorbed amounts were higher than the ones for MO. This behavior will be discussed later in Section 3.2.3.
Impact of the initial aqueous pH on MB (a) and MO (b) removal efficiency by NOS (C0,MB = 30 mg⋅L−1; C0,MO = 30 mg⋅L−1) and OSAC 400 °C (C0,MB = 250 mg⋅L−1; C0,MO = 250 mg⋅L−1, adsorbent dose = 2 g⋅L−1; contact time = 6 h; T = 25 ± 2 °C).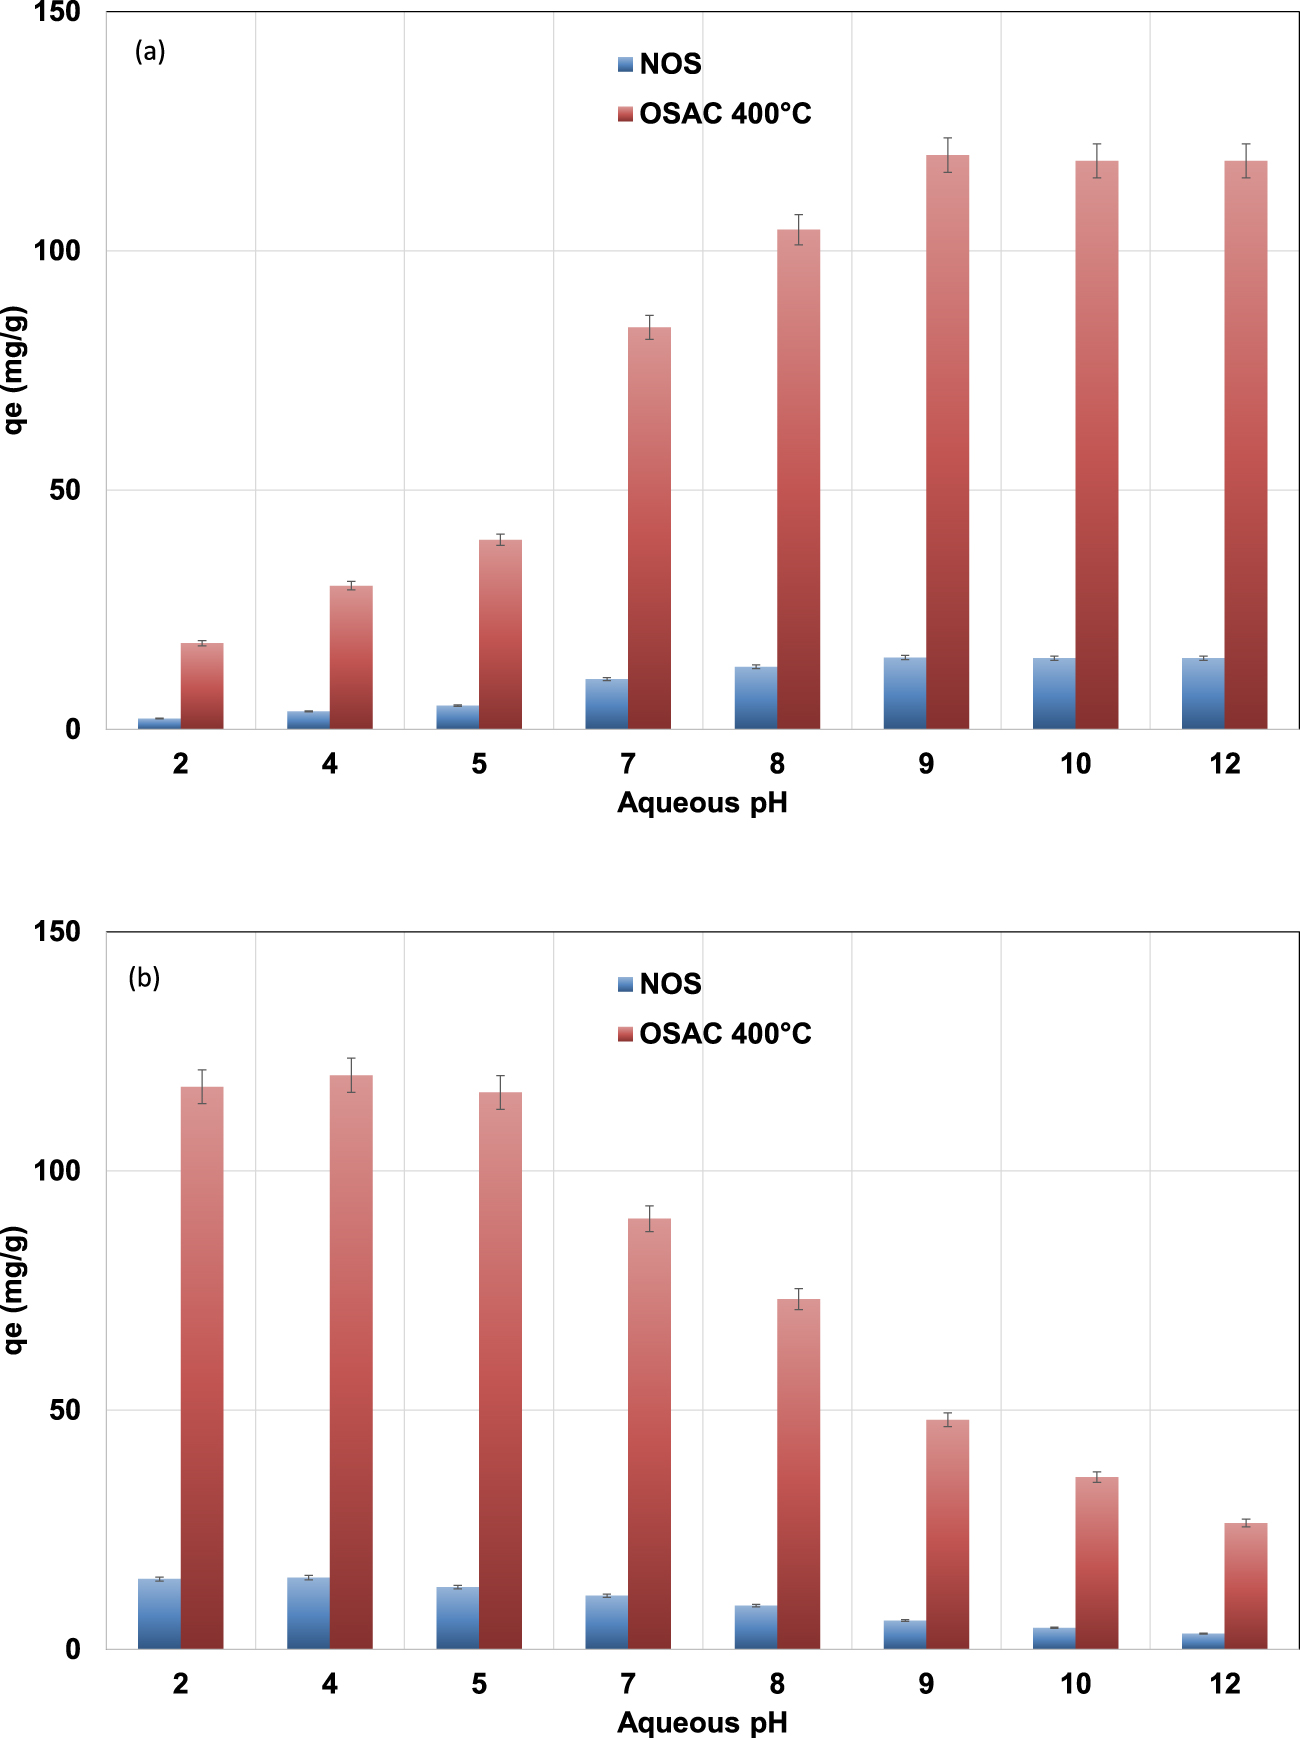
Calculated parameters of Langmuir, Freundlich and D–R models corresponding to MO and MB removal by natural olive stones and its ZnCl2-derived activated carbon at a temperature of 400 °C
| Adsorbents | Dye | Langmuir isotherm | Freundlich isotherm | D–R isotherm | |||||||||
|---|---|---|---|---|---|---|---|---|---|---|---|---|---|
| KL (L⋅mg−1) | qm (mg⋅g−1) | R2 | APE (%) | n | KF | R2 | APE (%) | qm,D–R (mg⋅g−1) | E (kJ⋅mol−1) | R2 | APE (%) | ||
| NOS | MB | 0.219 | 59.2 | 0.998 | 9.7 | 1.9 | 9.1 | 0.892 | 23.9 | 390.3 | 11.4 | 0.991 | 12.3 |
| MO | 0.338 | 34.2 | 0.955 | 12.3 | 3.7 | 12.2 | 0.893 | 20.1 | 91.4 | 15.4 | 0.862 | 14.3 | |
| OSAC | MB | 0.081 | 303.0 | 0.970 | 31.9 | 2.5 | 44.8 | 0.963 | 14.4 | 963.5 | 12.4 | 0.986 | 9.0 |
| 400 °C | MO | 0.092 | 277.8 | 0.999 | 9.2 | 2.0 | 28.7 | 0.847 | 28.7 | 1380.0 | 11.1 | 0.993 | 16.9 |
Table 3 gives the parameters of the three used kinetic models: PFO, PSO and diffusion models. It can be clearly deduced that the PFO model does not adequately fit to the experimental data. Indeed, the corresponding determination coefficients (R2) are relatively low and the calculated APE between the experimental and the theoretical adsorbed amounts was very high. For instance, for OSAC 400 °C, the corresponding R2 and APE were assessed to 0.844 and “0.593” and 18.2% and 31.1% for MB and “MO”, respectively.
On the contrary, the PSO model fits very well the kinetic experimental data (Figure 5a,b). Indeed, the R2 obtained for NOS or OSAC 400 °C and for the both studied dyes were higher than those obtained for PSO (Table 3). Moreover, the calculated APE values were relatively lower than the assessed ones for the case of PFO model. The worst case (APE = 10.9%) was observed for MB adsorption onto NOS but remains very low compared to the PFO model. This finding confirms the good concordance between the experimental data and the calculated ones by the PSO model (Figure 5). Besides the calculated adsorbed amounts of MB and MO at equilibrium for both NOS and OSAC 400 °C were close to the experimental values (Table 3). For instance, for OSAC 400 °C, these difference percentages between the experimental and the theoretical adsorbed amounts were determined to 2.3% and 1.5% for MB and MO, respectively. Therefore, under the tested experimental conditions, the PSO model is more suitable in fitting the MB and MO removal by NOS and the derived ZnCl2-activated carbon. This model suggests that the rate limiting step might be chemical adsorption including valency forces through sharing or exchange of electrons between these two tested dyes and olive stone derived adsorbents [41, 45].
The adsorption of MB and MO by the NOS and OSAC 400 °C was analyzed through the application of film and intraparticle diffusion models. Results indicated that the dye adsorption process proceeds by surface interactions for times lower than 90 min for NOS and 120 min for OSAC 400 °C and by intraparticle diffusion at later stages (Figure 5a,b). According to the calculated film and intraparticle diffusion coefficients, it can be deduced that the intraparticle diffusion process might be the limiting factor during both MB and MO adsorption onto the two adsorbents (Table 3). A similar finding was reported by Wu et al. [46] when studying methylene blue, phenol and 4-chlorophenol removal by activated carbons from oil-palm shells. On the other hand, the activation of the OS has significantly reduced the film and intraparticle diffusion coefficients for MB and MO (Table 3). The values of film diffusion coefficient, Df were higher for NOS than for OSAC indicating that film diffusion was faster for NOS than for OSAC [47]. The calculus of the intraparticle diffusion coefficients showed that OSAC was a more favored medium than NOS for internal transfer of both the studied dyes.
3.2.2. Impact of initial aqueous pH
The impact of initial aqueous pH on MB and MO adsorption onto NOS and its derived ZnCl2-activated carbon at a temperature of 400 °C (OSAC 400 °C) was investigated under the experimental conditions presented in Section 2.4.2. The experimental results (Figure 6) indicated that the two used dyes exhibited opposite behaviors. Indeed, for example, for OSAC 400 °C the MB pollutant, which is a cationic dye, was preferentially adsorbed at higher used pH values. In fact, the adsorbed MB amount increased from 18 mg⋅g−1 for an initial pH of 2 to more than 120 mg⋅g−1 for an aqueous pH of 9. This finding could be explained by the fact that for aqueous pH higher than the pHzpc, which were determined to 5.5 and 4.6 for NOS and OSAC 400 °C, these materials should be negatively charged. Therefore, adsorption through electrostatic attraction of positively charged ions will be favored. A similar trend was reported for MB removal by activated carbons from globe artichoke leaves [48] and reed-derived biochar by tannic acid [49].
For the reason cited above, the opposite behavior was registered for the negatively charged MO dye. The MO adsorbed amount decrease from about 15 and 120 mg⋅g−1 for NOS and OSAC 400 °C at an aqueous pH of 4 to about 3.3 and 26.4 mg⋅g−1 at a pH of 12, respectively. Similar findings were reported for anionic dye removal by natural or modified adsorbents [50, 51].
Isothermal experimental and fitted data with Freundlich, Langmuir and D–R models for MB (a) and MO (b) removal by NOS and OSAC 400 °C (initial pH for MB solutions = 9; initial pH for MO solutions = 3.5; adsorbent dose = 2 g⋅L−1; contact time = 6 h; T = 25 ± 2 °C).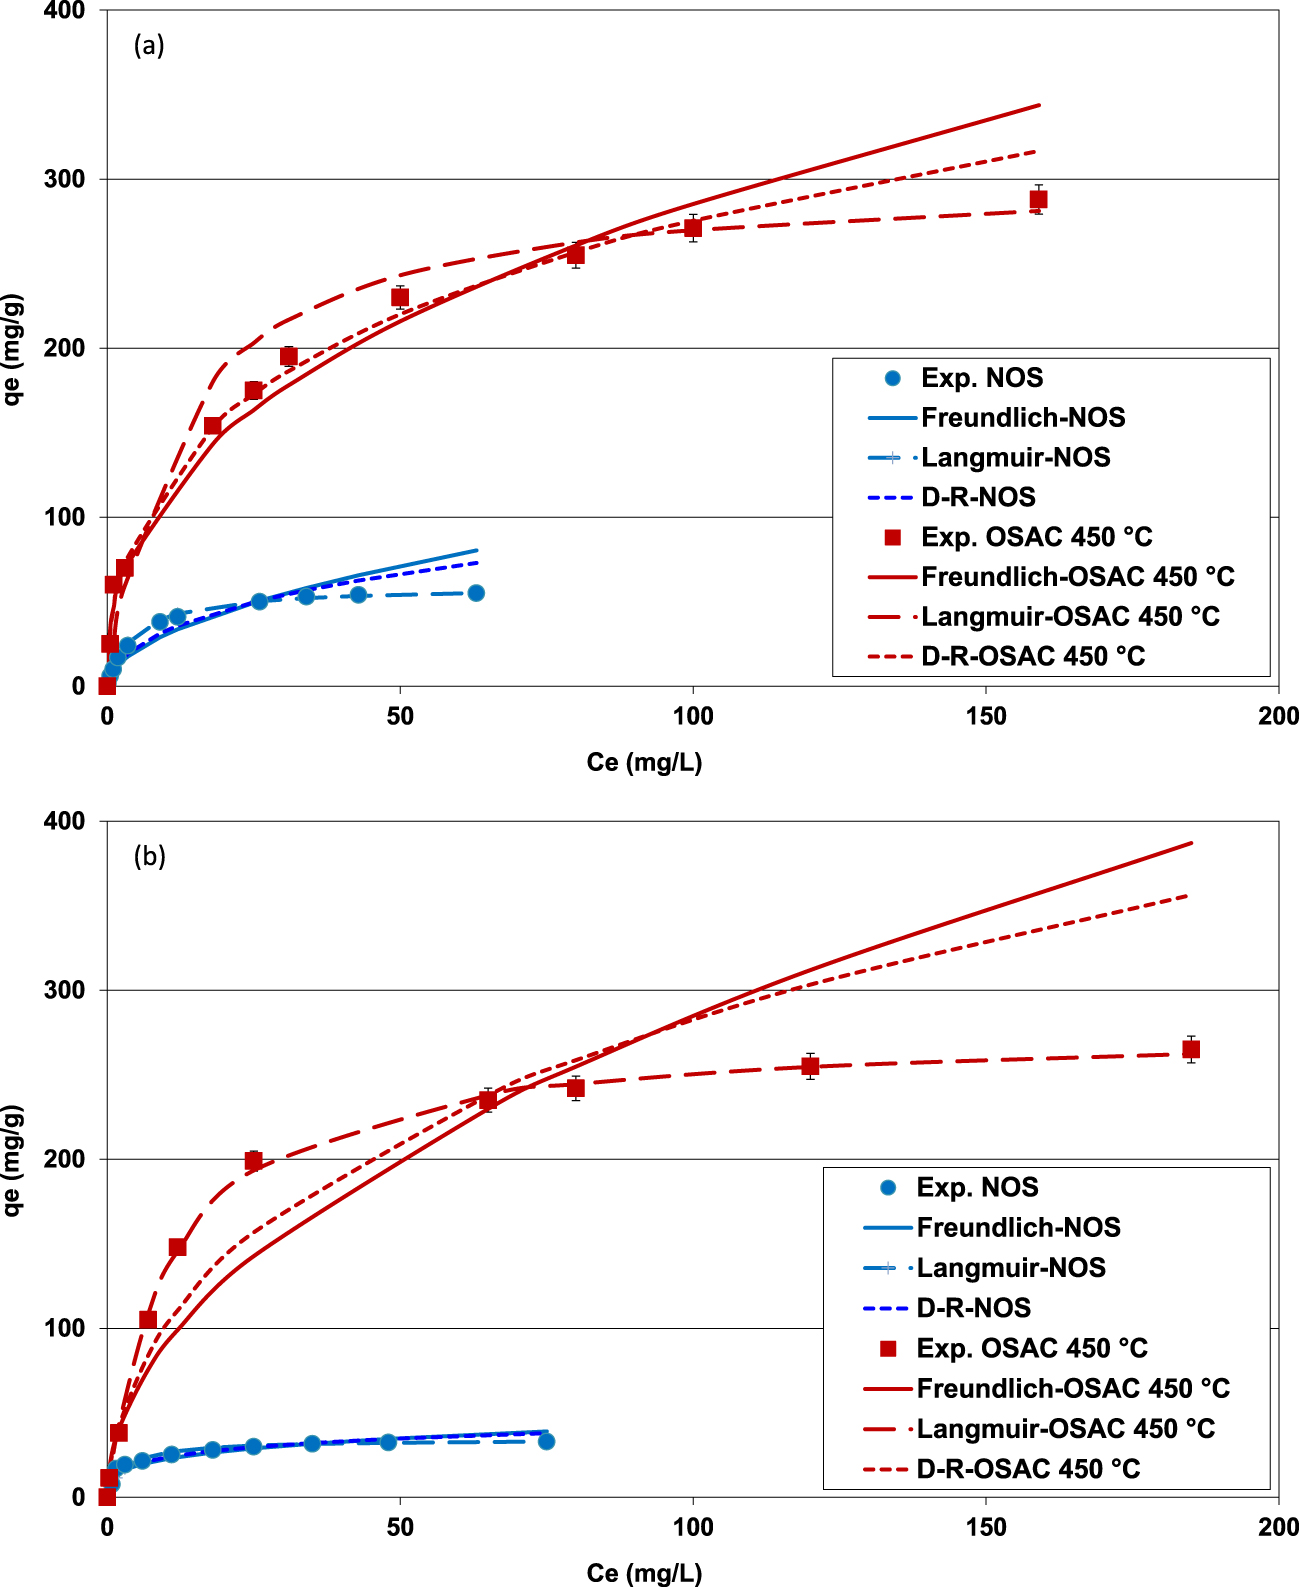
3.2.3. Impact of initial concentration-isotherm modeling
The impact of the initial concentrations on MB and MO removal efficiency by NOS and OSAC 400 °C has been determined under the experimental conditions presented in Section 2.4.3. The used pH for MB and MO solutions were fixed to 9.0 and 3.5, respectively. They correspond to their highest adsorbed amount during the kinetic study (see Figure 5). The obtained measured data were fitted to Freundlich, Langmuir and D–R models as explained in Section 2.4.3. Figures 7(a,b) give the comparison between the experimental and theoretical data regarding MB and MO adsorption by both adsorbents, respectively. The calculated constants of these three models are given in Table 4.
On the basis of Figure 7 and Table 4, it can be deduced that Langmuir isotherm fits the best to the experimental data compared to the Freundlich and D–R results. Indeed, this model has the most interesting determination coefficients and APE. For instance, for MO onto OSAC 400 °C, the highest R2 (R2 = 0.999) and the lowest APE (9.2%) were obtained for Langmuir isotherm. Even if the D–R isotherm’s R2 and APE are also satisfactory (Table 4), the corresponding predicted maximum adsorbed MB and MO amounts were very high compared to the calculated ones using the Langmuir model (Table 4). These unrealistic theoretical capacities could be imputed to the hypotheses taken into account by this model especially the presence of homogenous and uniform microporous structures in the studied material [2]. Besides, the highest Langmuir’s parameter values “RL = 1∕(1 + KL+C0)” were estimated to 0.072 and 0.055 for MB and MO, respectively. All these values are less than 1 indicating a favorable adsorption of both dyes by the used adsorbents. This result suggests that dyes adsorption onto NOS and OSAC 400 °C occurs on uniform monolayer coverage at the outer surface of the adsorbents [52]. On the other hand, Freundlich parameter “n” was assessed to 2.5 and 2.0 for MB and MO adsorption onto OSAC 400 °C. They are in the range of 1–10, indicating that the adsorption of these two dyes by the used activated carbon is a favorable process. Values in the same range were determined by Tseng and Wu [53] when studying methylene removal by activated carbon from bamboo.
Concerning the D–R isotherm application, it is very important to mention that all the calculated free energy values () for both dyes and the two adsorbents were higher than 8 kJ⋅mol−1. This indicates that MB and MO removal process might occur mainly through cation exchange (Table 4). Comparable outcomes have been stated by Valliammai et al. [54] when investigating MB removal by activated carbons derived from agricultural by-products.
The Langmuir’s maximum adsorption capacities of MB and MO by OSAC 400 °C were assessed to 303.0 and 277.8 mg⋅g−1, which are about 5.2 and 8.1 times higher than the ones determined for NOS. This behavior is attributed to the improved structural and textural properties of the ZnCl2-generated activated carbon, especially its specific surface area, microporsity volume as well as functional group richness.
Table 5 compares the determined adsorption capacities (Langmuir’s qm) of MB and MO on NOS and OSAC 400 °C with other activated carbons. It can be clearly seen that OSAC 400 °C can be considered as a promising material for dye removal from waste waters. Indeed, its MB adsorption capacity was about 28.5, 3.5 and 2.9 times higher than activated carbons generated from Macore fruit shells [55], cola nut shells [56] and cellulose biocomposite films [57]. Besides, MO adsorption capacity by OSAC 400 °C was about 2.5, 2.3 and 1.7 higher than those reported for activated carbons generated from Vitis vinifera [58], a copper sulfide nanoparticle-loaded activated carbon [59], and an activated carbon synthetized from boiler residue [60].
Probable adsorption mechanisms for MB and MO dyes onto olive stone activated carbon.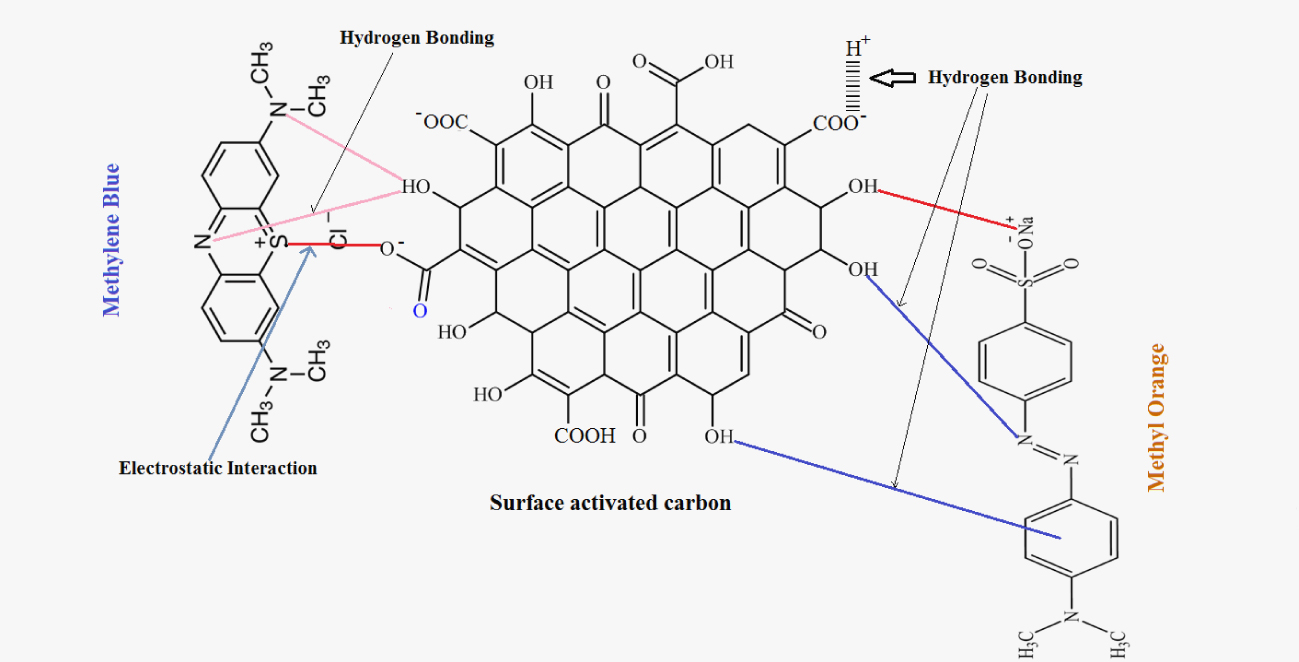
Comparison of MB and MO adsorption onto NOS and OSAC 400 °C with other activated carbons
| Adsorbent | Dye | Langmuir’s adsorption capacity, qm (mg⋅g−1) | Reference |
|---|---|---|---|
| Activated carbon from boiler residue | MO | 161.81 | [60] |
| Activated carbon prepared from Vitis vinifera L. | MO | 111.11 | [58] |
| Sisal activated carbon/cellulose biocomposite films | MB | 103.7 | [57] |
| Cola nut shells derived activated carbon | MB | 87.12 | [56] |
| Macore fruit shells derived activated carbon | MB | 10.61 | [55] |
| MO | 3.42 | ||
| Copper sulfide nanoparticles loaded activated carbon | MO | 122 | [59] |
| Activated carbon modified by three surfactants | MB | 232.5 | [61] |
| Activated carbon from olive stones | MB | 303.0 | Present work |
| MO | 277.8 | ||
3.2.4. Adsorption mechanism exploration
As illustrated in Figure 8, the adsorption mechanism is mainly attributed to hydrogen bonding and electrostatic interaction between dyes and oxygen-containing functional groups on the activated carbon surface [59, 62]. For MB, the maximum adsorption occurs for alkaline pH values when the surface sites of the adsorbent become negatively charged. MB adsorption includes the electrostatic attraction between the positively charged amino groups and the negative charges available on the activated carbon surface, and the π–π interactions which occur between the localized π electrons in the conjugated aromatic rings of activated carbon and the aromatic rings of MB dye [63]. On the contrary, the adsorption capacity of methyl orange was maximum for acidic medium (pH = 3.5). At this pH range, the surface of the activated carbon is positively charged and that of MO is negatively charged. The electrostatic interactions between the methyl orange deprotonated groups (sulfonate (−SO)) and oxygen-containing groups on the activated carbon surface promote the adsorption of methyl orange [62]. Also, the hydrogen bonding and the π–π interactions in the structure of activated carbon are important factors in this dye adsorption process [63]. It is important to underline that given the fact that MB and MO adsorption was best fitted with Langmuir model, each active adsorption site will interact with only one dye molecule. Furthermore, all the adsorption sites are energetically equivalent and there were no interactions between adjacent adsorbed molecules [25, 26].
4. Conclusions
This study investigated the synthesis of activated carbons from an abundant waste (olive stones) and its use as adsorbent for cationic and anionic dyes. Results indicated that this raw material activation with ZnCl2 at a temperature of 400 °C produces an activated carbon with attractive structural, textural and surface chemistry characteristics. These improved properties allowed the activated carbon to efficiently remove both cationic and anionic dyes under wide experimental conditions. Kinetic and isothermal data indicated that MB and MO adsorption onto the raw olive stone and its derived activated carbon occurs through chemical processes including mainly electrostatic attraction, hydrogen bonding and π–π interactions. Besides, the Langmuir’s adsorption capacities of MB and MO onto the synthetized activated carbon were assessed to 303.0 and 277.8 mg⋅g−1, for aqueous pH values of 9.0 and 3.5, respectively. These adsorption capacities are relatively higher than various activated carbons which indicates that our synthetized material could be considered as an efficient and promising material for dyes and probably other organic/mineral pollutants removal from industrial effluents. Further investigations are required in order to assess these dyes removal abilities under dynamic conditions by using laboratory column or continuous stirring tank reactors. The optimization of these dyes’ desorption and if possible, recovery for reuse, is also an important task to be undertaken.