


 CC-BY 4.0
1. Introduction
Sustainable management of olive mill waste (OMW) in Mediterranean countries is a challenging issue [1]. A great deal of research has been devoted to studying the impact of various practices and methods for managing this type of waste worldwide [2, 3].
Olive oil production is considered one of the oldest agricultural industries in the Mediterranean countries. Spain, Italy, Greece, and Tunisia are the largest oil producers worldwide, representing 73.5% of the overall olive oil production globally [4]. Furthermore, almost 98% of the world’s olive tree cultivation involving approximately 900 million trees in 10 million hectares of land is concentrated in the Mediterranean Basin [5, 6, 7, 8].
The production of olive oil from different types of olive mills (three-phase, two-phase, and traditional) is a seasonal process, which results in very large quantities of waste that must be managed in a short time. In ideal operating conditions, an oil production unit has its own waste management system (e.g., chemical or biological treatment) [9]. In most cases, however, mainly due to the small capacity of oil mills and the high cost of various waste treatment technologies, oil mills discharge untreated OMW into the environment. The main recipients are soils, surface water, and groundwater in addition to seas.
Untreated OMW can cause severe environmental degradation due to its very high organic and inorganic load, foul odour, and intense dark black/brown color [6, 7, 10, 11, 12]. Furthermore, landspreading and disposal into evaporation ponds without taking protective measures are practices that are observed in many olive producing areas and mainly small mills due to the low cost of these practices and also lenient control measures by competent authorities. Research works published so far report that discharge into soils (in ponds or directly on soil surfaces) degrades soils gradually [13] and may cause groundwater contamination through leaching [8].
As soil formation is an extremely slow process, the soil is considered a nonrenewable resource. Although, until recently, soil was the “poor relation” of air and water, its importance is now beginning to be recognized worldwide [14]. Significant strategies have been designed and implemented to protect soil [15, 16]. Soil is now included directly and indirectly in the Sustainable Development Goals (Goal numbers 2, 3, 6, 11–13, and 15) [17].
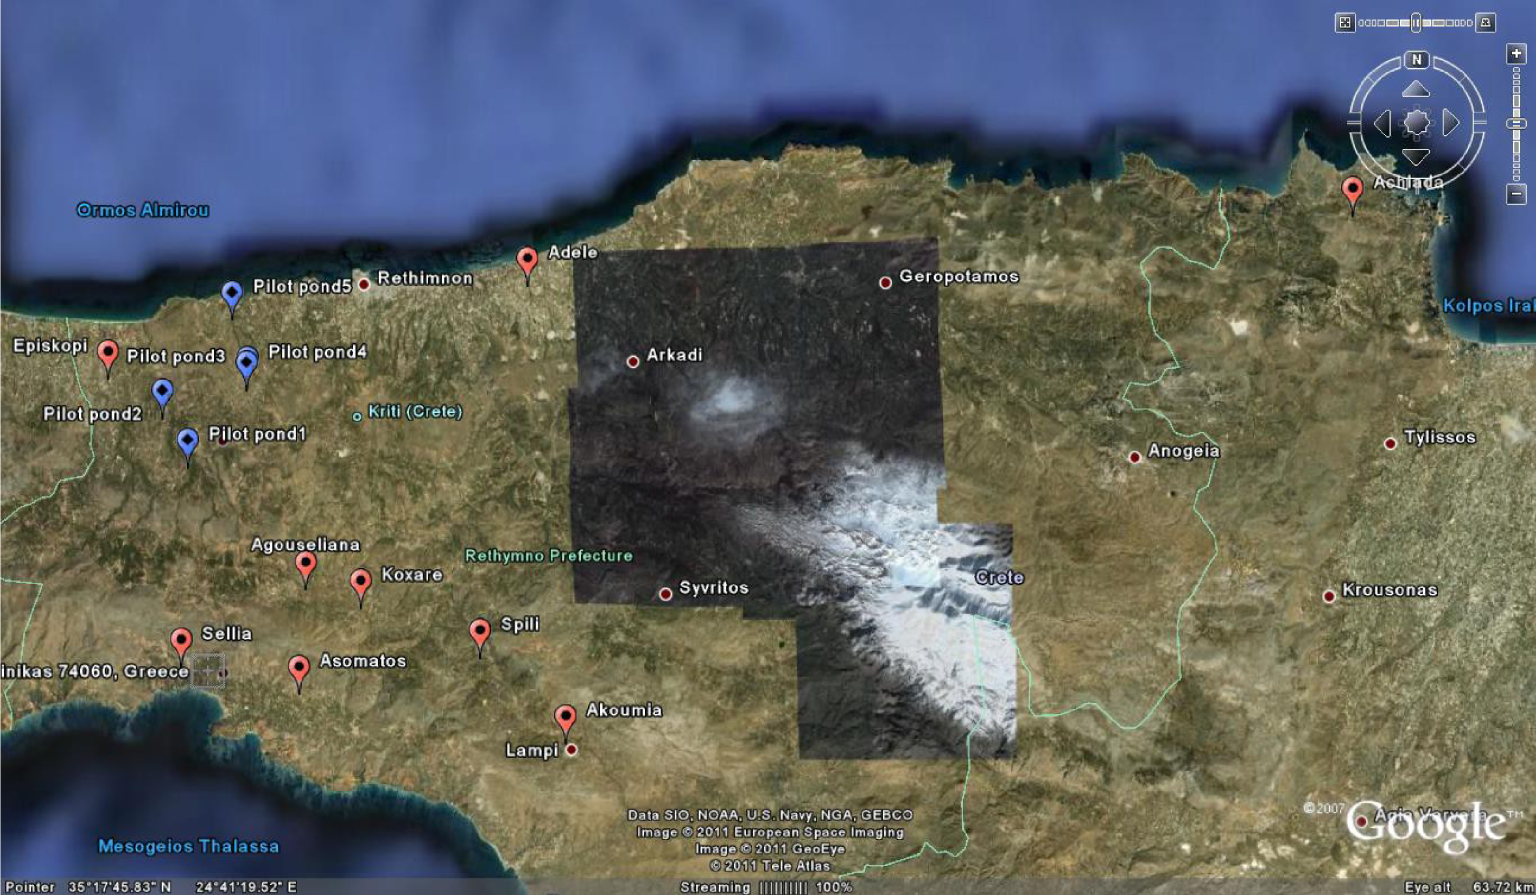
Location of the five ponds studied in the LIFE PROSODOL project (blue markers) and the nine randomly selected ponds of this study in Crete (red markers).
Without ignoring the importance and contribution of various organic waste treatment technologies in maintaining environmental quality, the current approach focuses on the utilization of organic waste and moving to a more cyclic way of implementation as regards the management of materials and resources [3, 18]. In light of these facts, many researchers and policy makers promote the reuse of OMW for irrigation and fertilization purposes [19]. Experiments with controlled addition of OMW to soils for usually a few years (1–3 years) have shown that a severe impact on soil electrical conductivity (EC), polyphenol content and pH is not expected although a significant increase is observed in potassium, phosphorus, nitrogen, and organic matter (OM) concentrations in soil [13, 20]. Even though in most of these cases and after a sufficient time period, usually 4–6 months, or after harvesting of cultivated plants, the soil was restored in terms of increased value of its constituents, this is not the case for soils where untreated OMW is disposed of in an uncontrolled manner and for many years [10, 11, 21]. Another important difference between these two cases is soil quality. In the case of field experiments, soils on experimental plots were healthy without prior waste disposal, while in the second case, soils had been receiving large amounts of waste for many years. Therefore, it is obvious that soil behaviour in these two cases does not have much in common, especially in terms of persistence, resilience, and the degradation level of pollutants. Studies carried out in the framework of the European LIFE PROSODOL Project “Strategies to protect and improve soil quality from the disposal of olive mill waste in the Mediterranean region” have shown that in areas where untreated waste is disposed of, there are changes in soil properties, which are not reverted to normal conditions even after a 10-year cessation of waste disposal [10, 11, 21, 22, 23]. Although most of the soil properties were found to be affected to a greater or lesser degree, it was also found that some soil properties could be used as indicators for the assessment of soil quality at OMW disposal areas. These include soil pH, OM, EC, total nitrogen, polyphenols, exchangeable potassium, available phosphorus, and available iron [21]. This study aims to confirm the validity of these proposed soil indicators by evaluating the results obtained after visiting and studying nine OMW disposal sites in Greece, which were randomly selected and without any knowledge of their history. Therefore, the importance and innovation of this study lie in verifying the ability of soil OMW indicators as proposed by Doula et al. [21]. This approach can be used as a framework for assessing soil quality not only in areas where the disposal of OMW is common practice but also in areas where OMW is applied for fertigation in accordance with current legislation.
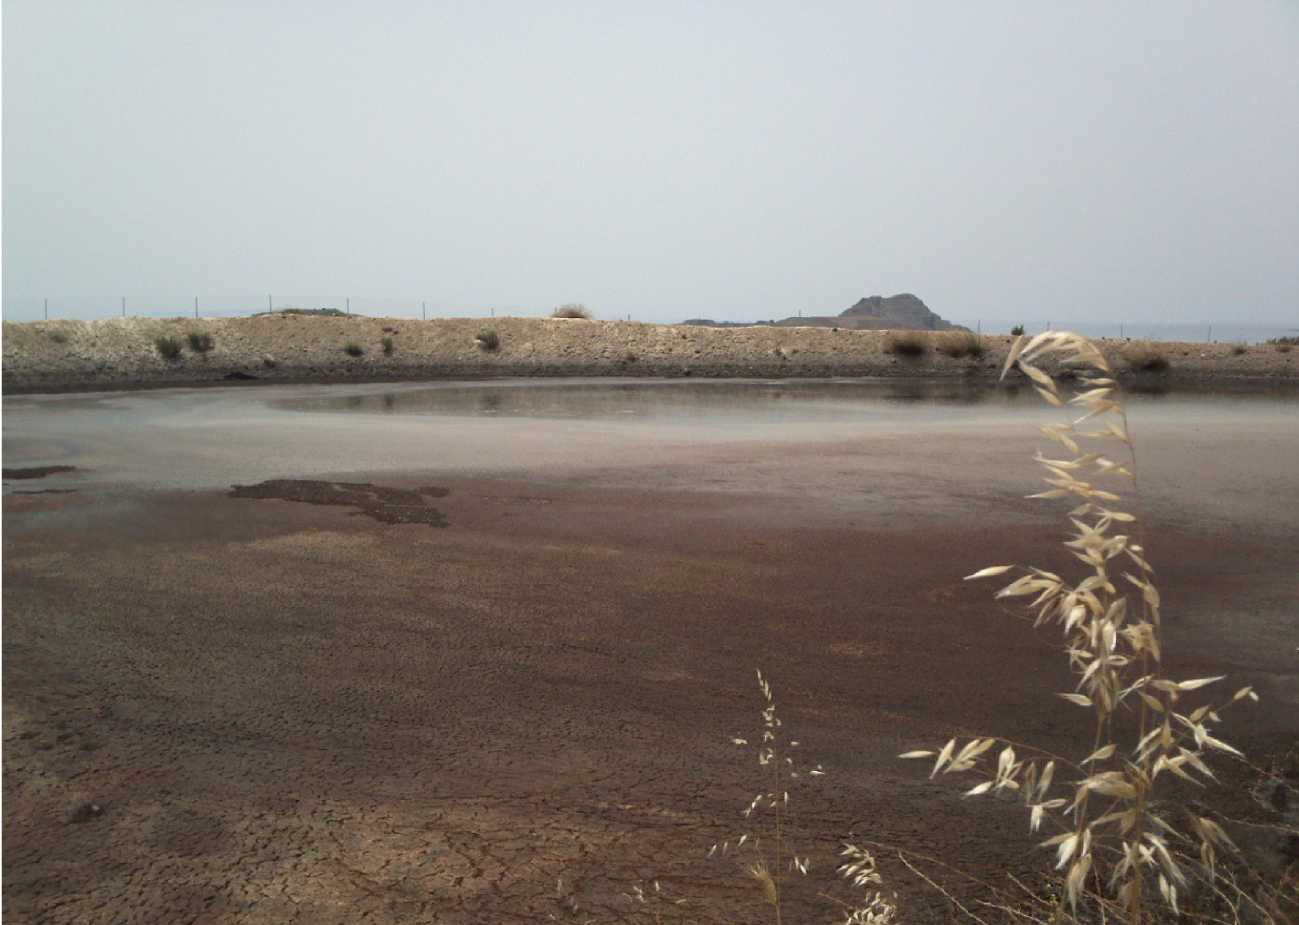
Typical OMW evaporation pond in Crete, Greece.
2. Materials and methods
The study was based on the research work of Doula et al. [21] in the framework of the LIFE PROSODOL project [24], in which the authors reported their results regarding the definition of soil indicators specific to OMW disposal areas. In brief, the LIFE PROSODOL project was implemented in Rethymno, Crete, Greece, where a well-designed soil monitoring system was implemented to assess the impact of OMW disposal on soil properties.
The monitoring strategy was applied for almost two years. The process included bimonthly soil sampling and analysis of 23 soil parameters from five OMW disposal areas (blue markers in Figure 1), which were located in the prefecture of Rethymno, Crete. More than 16,200 samples were collected and analyzed. After processing the collected soil data, eight soil-quality indicators were defined and proposed.
Coordinates, percentage of clay content, and texture of the nine OMW disposal areas in this study
| Disposal area | Latitude | Longitude | Clay (%) | Texture |
|---|---|---|---|---|
| Episkopi, Rethymno | 35° 19′ 34.68′′ N | 24° 20′ 21.47′′ E | 28 | Silty clay loam |
| Sellia, Rethymno | 35° 12′ 08.21′′ N | 24° 22′ 39.64′′ E | 28 | Silty clay loam |
| Akoumia, Rethymno | 35° 10′ 8.72′′ N | 24° 34′ 48.99′′ E | 27 | Silty clay loam |
| Agouseliana, Rethymno | 35° 14′ 7.72′′ N | 24° 26′ 36.62′′ E | 14 | Sandy loam |
| Koxare, Rethymno | 35° 13′ 39.28′′ N | 24° 28′ 20.95′′ E | 10 | Sandy loam |
| Asomatos, Rethymno | 35° 11′ 26.00.′′ N | 24° 26′ 23.39′′ E | 29 | Silty clay loam |
| Spili, Rethymno | 35° 12′ 22.02′′ N | 24° 32′ 6.98′′ E | 16 | Sandy loam |
| Adele, Rethymno | 35° 21′ 57.17′′ N | 24° 33′ 39.70′′ E | 48 | Clay |
| Achlada, Heraklion | 35° 23′ 38.65′′ N | 24° 59′ 49.07′′ E | 20 | Loam |
2.1. Areas understudy
Nine OMW disposal areas were selected from Crete (red markers in Figure 1; Table 1). Soil and waste samples were collected once in June 2017 when evaporation ponds were full of OMW (after the oil production period, which ends in January, and before the hot Mediterranean summer when OMW partly evaporates). In all cases, OMW was produced from three-phase mills by the continuous centrifuge extraction process. The OMW management practice was the same for all sites, that is, disposal in evaporation ponds. The ponds were deep (up to 1.5–2 m) and were poorly constructed by using simple soil excavation methods (Figure 2) and without using any protective medium to prevent leaching to aquifers (e.g., geotextiles).
Soil and waste samples were collected by following the method of composite samples. Composite samples were prepared from discrete, equal quantities of specimens were taken from several locations at a constant depth (spatial composite). This type of sampling is considered as being representative of the mean composition of an area because in general it reduces the intrinsic variability of the final sample and allows the mean concentration of an area to be estimated with better accuracy [25].
Chemical analysis results of the OMW collected from the nine ponds
| Parameter | Value range | Mean | SD |
|---|---|---|---|
| pH | 4.91–5.45 | 5.10 | 0.18 |
| Electrical conductivity (mS/cm) | 7.62–8.15 | 7.93 | 0.17 |
| Total organic carbon (g/L) | 34–37 | 35 | 1 |
| BOD (g/L) | 35–42 | 38 | 3 |
| COD (g/L) | 55–74 | 65 | 7 |
| Total Kjeldahl nitrogen (mg/L) | 750–790 | 775 | 15 |
| Total polyphenols (g/L) | 8.5–9.2 | 8.8 | 0.2 |
| Potassium (g/L) | 4.2–4.7 | 4.5 | 0.2 |
| Phosphorus (mg/L) | 430–480 | 463 | 17 |
| Calcium (mg/L) | 430–500 | 466 | 24 |
| Sodium (mg/L) | 106–118 | 111 | 4 |
| Magnesium (mg/L) | 152–170 | 162 | 6 |
| Boron (mg/L) | 5.1–5.4 | 5.3 | 0.1 |
| Copper (mg/L) | 30–33 | 32 | 1 |
| Iron (mg/L) | 210–260 | 238 | 14 |
| Zinc (mg/L) | 17–21 | 19 | 1 |
| Manganese (mg/L) | 9–13 | 11 | 1 |
Soil samples were collected from the inner area of the ponds and also from the surrounding area (control samples). The sampling interval was 25 cm, starting from the surface and ending at a depth of 1 m. However, in areas with shallow soils, samples were collected to a depth where it was possible for the auger to penetrate the soil. From inside the evaporation ponds, samples were collected from different points on the walls and the bottom (five points in each pond) and at different depths. Then, the samples of the same depth were mixed to form a single composite sample. As the soil inside the ponds was disturbed due to the excavation, the soil texture was determined from the undisturbed samples, which were the controls (Table 1).
2.2. Soil and OMW analysis
The collected soil samples were analyzed not only for the eight indicators defined by Doula et al. [21] but also for multiple parameters to determine whether other properties were affected by waste disposal. In particular, soil samples, after air drying and sieving, were analyzed for particle size distribution texture (only the control soils) by using the Bouyoucos method [26]; pH and EC in paste extract using a pH/EC meter [27, 28]; OM by dichromate oxidation [29, 30]; carbonates by using a Bernard calcimeter [27]; total N by the Kjeldahl method [31]; available P by sodium hydrogen carbonate extraction [32] and measured using a HITACHI U3010 Spectrophotometer; and exchangeable K+, Ca2+, and Mg2+ by BaCl2 extraction [33] and measured using a Varian SpectrAA 220 Atomic Absorption Spectrometer. Methanol-extractable phenol compounds were quantified by means of the Folin–Ciocalteu colorimetric method [34]. Available Mn, Fe, Cu, and Zn were determined using extraction with diethylenetriaminepentaacetic acid according to the standard ISO 14870:2001 [35] and measured by a Varian SpectrAA 220 Atomic Absorption Spectrometer. Boron was extracted using boiling water and quantified by applying the azomethine-H method [36].
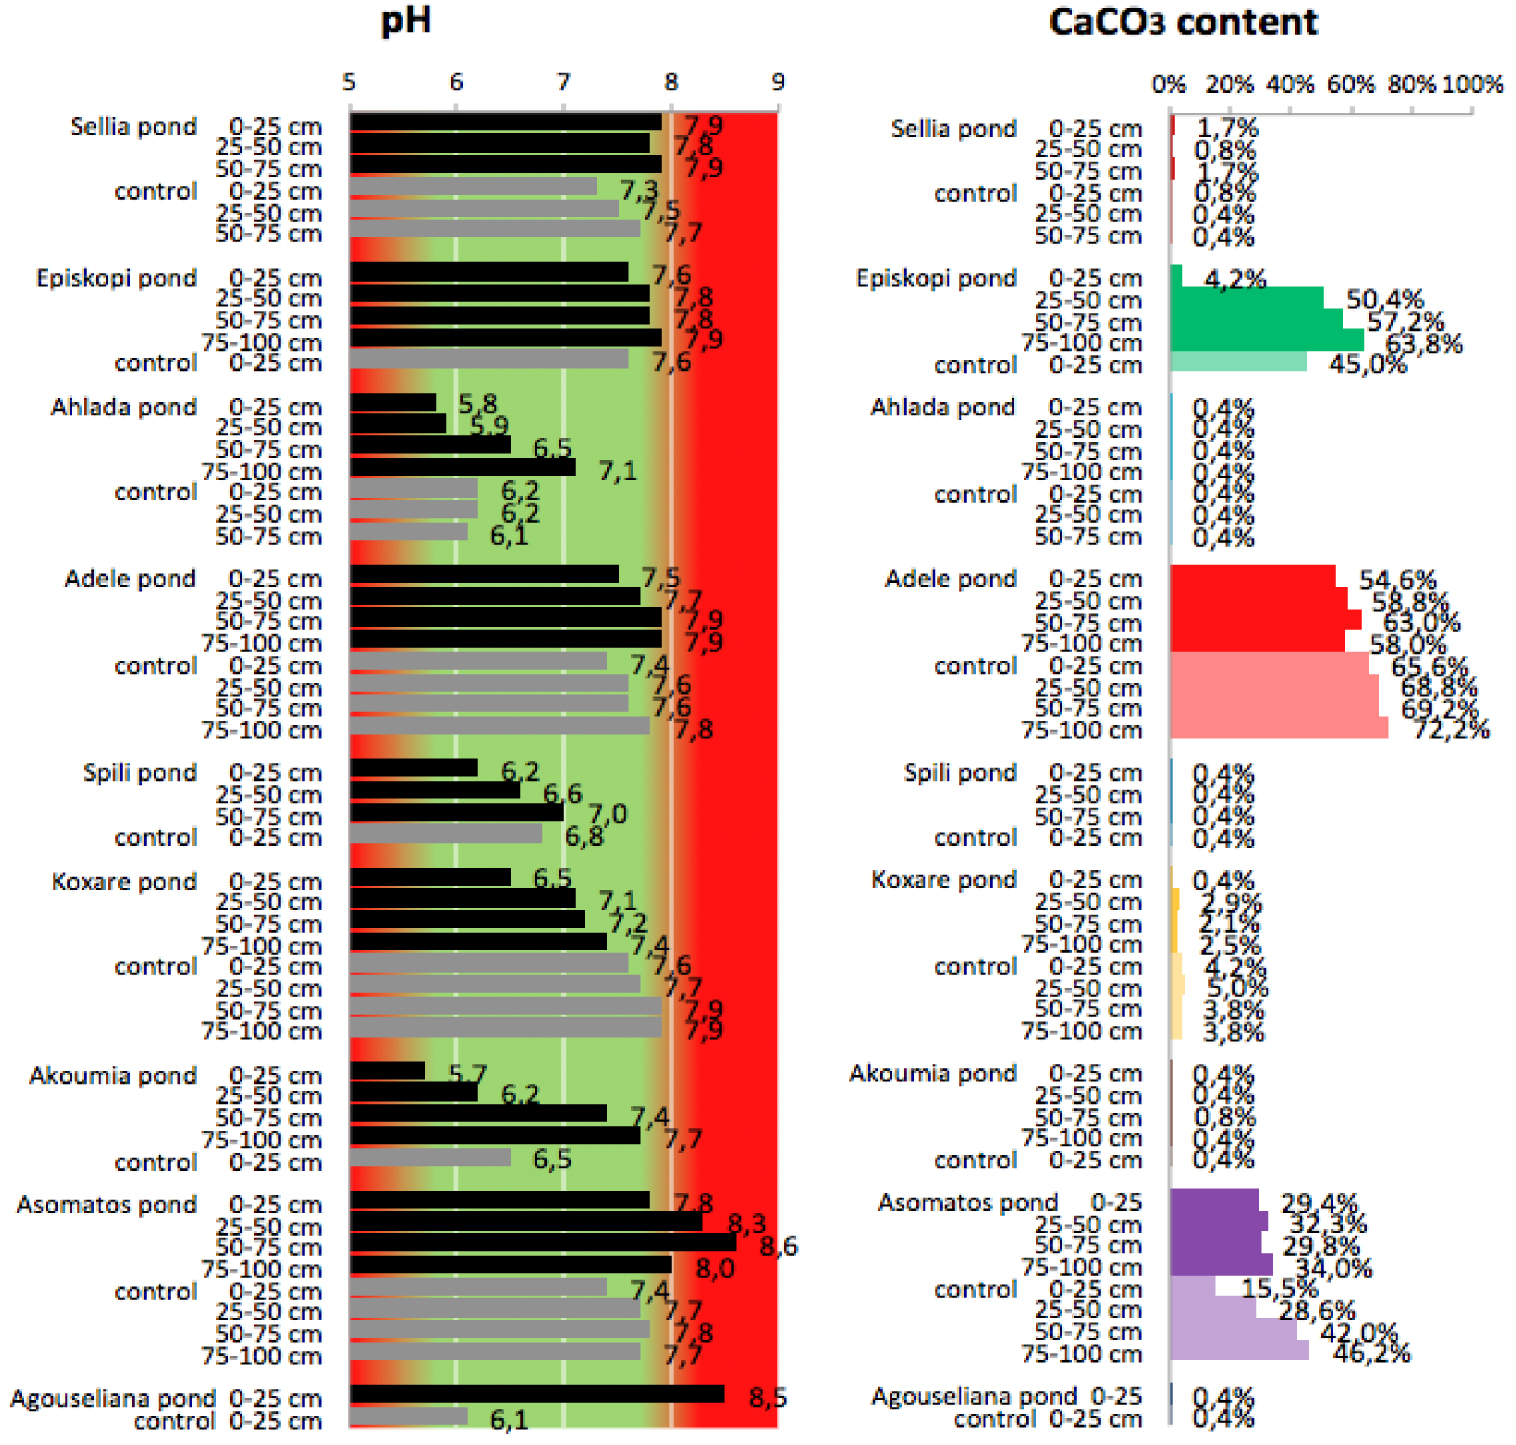
pH values and CaCO3 content of soil samples collected from the nine disposal areas in Crete.
Moreover, nine mixed waste samples were collected from inside the nine ponds and analyzed for several parameters (Table 2) using accredited methods [6]. The initial digestion of the waste samples was carried out by using the EPA 3052 method with HNO3 digestion in a microwave oven. The total phenol content was determined using the Folin–Ciocalteu method [34]. As can be seen in Table 2, the collected samples are characterized by low pH, high EC, and a high content of nutrients and polyphenols.
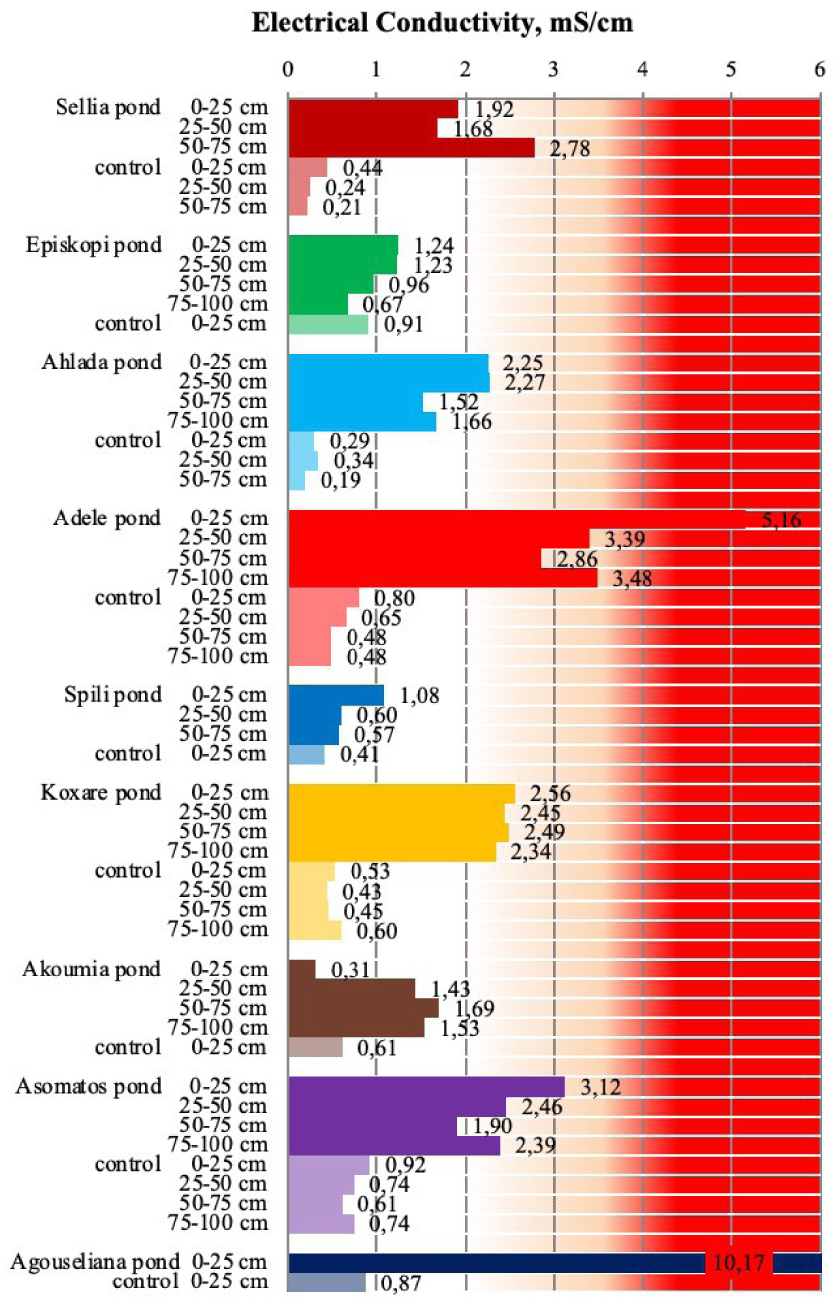
Electrical conductivity of soil samples collected from the nine disposal areas in Crete. Values in the red area are above the threshold of 4 mS/cm [21, 23].
3. Results and discussion
3.1. Carbonate content and pH of pond soils
Regarding the effect on soil pH, as can be seen in Figure 3, the high percentage of carbonates acts protectively against the acidity of OMW. Thus, in soils with a low carbonate content, the reduction in pH is more probable (Achlada, Spili, and Akoumia). However, in some cases, there is an increase in the pH of pond soils in comparison to the controls (Sellia, Episkopi, Adele, and Asomatos). The common denominator of the later cases appears to be the clay content of the soil, which in all these cases is higher than 28%. This is in agreement with the results by Regni et al. [20], who reported that soils with a high percentage of clay appear to be the best choice for fertigation with olive mill wastewater, while the carbonate content is important for providing efficient buffering power and avoiding extreme changes in the pH value. This is in line with the results from the main sampling campaign of the PROSODOL project, which indicate that for alkaline soils rich in CaCO3, seasonal surface application of OMW does not markedly affect the soil pH in the long term since most of the acidity of OMW is neutralized by the CaCO3 [23] in the soil. However, this study also reveals that OMW disposal may gradually reduce the CaCO3 content in the soil as can be observed for Episkopi and Adele ponds. This is in agreement with the results of previous work [37], which reported that the low pH of OMW results in the long-term loss of carbonate from the topsoil.
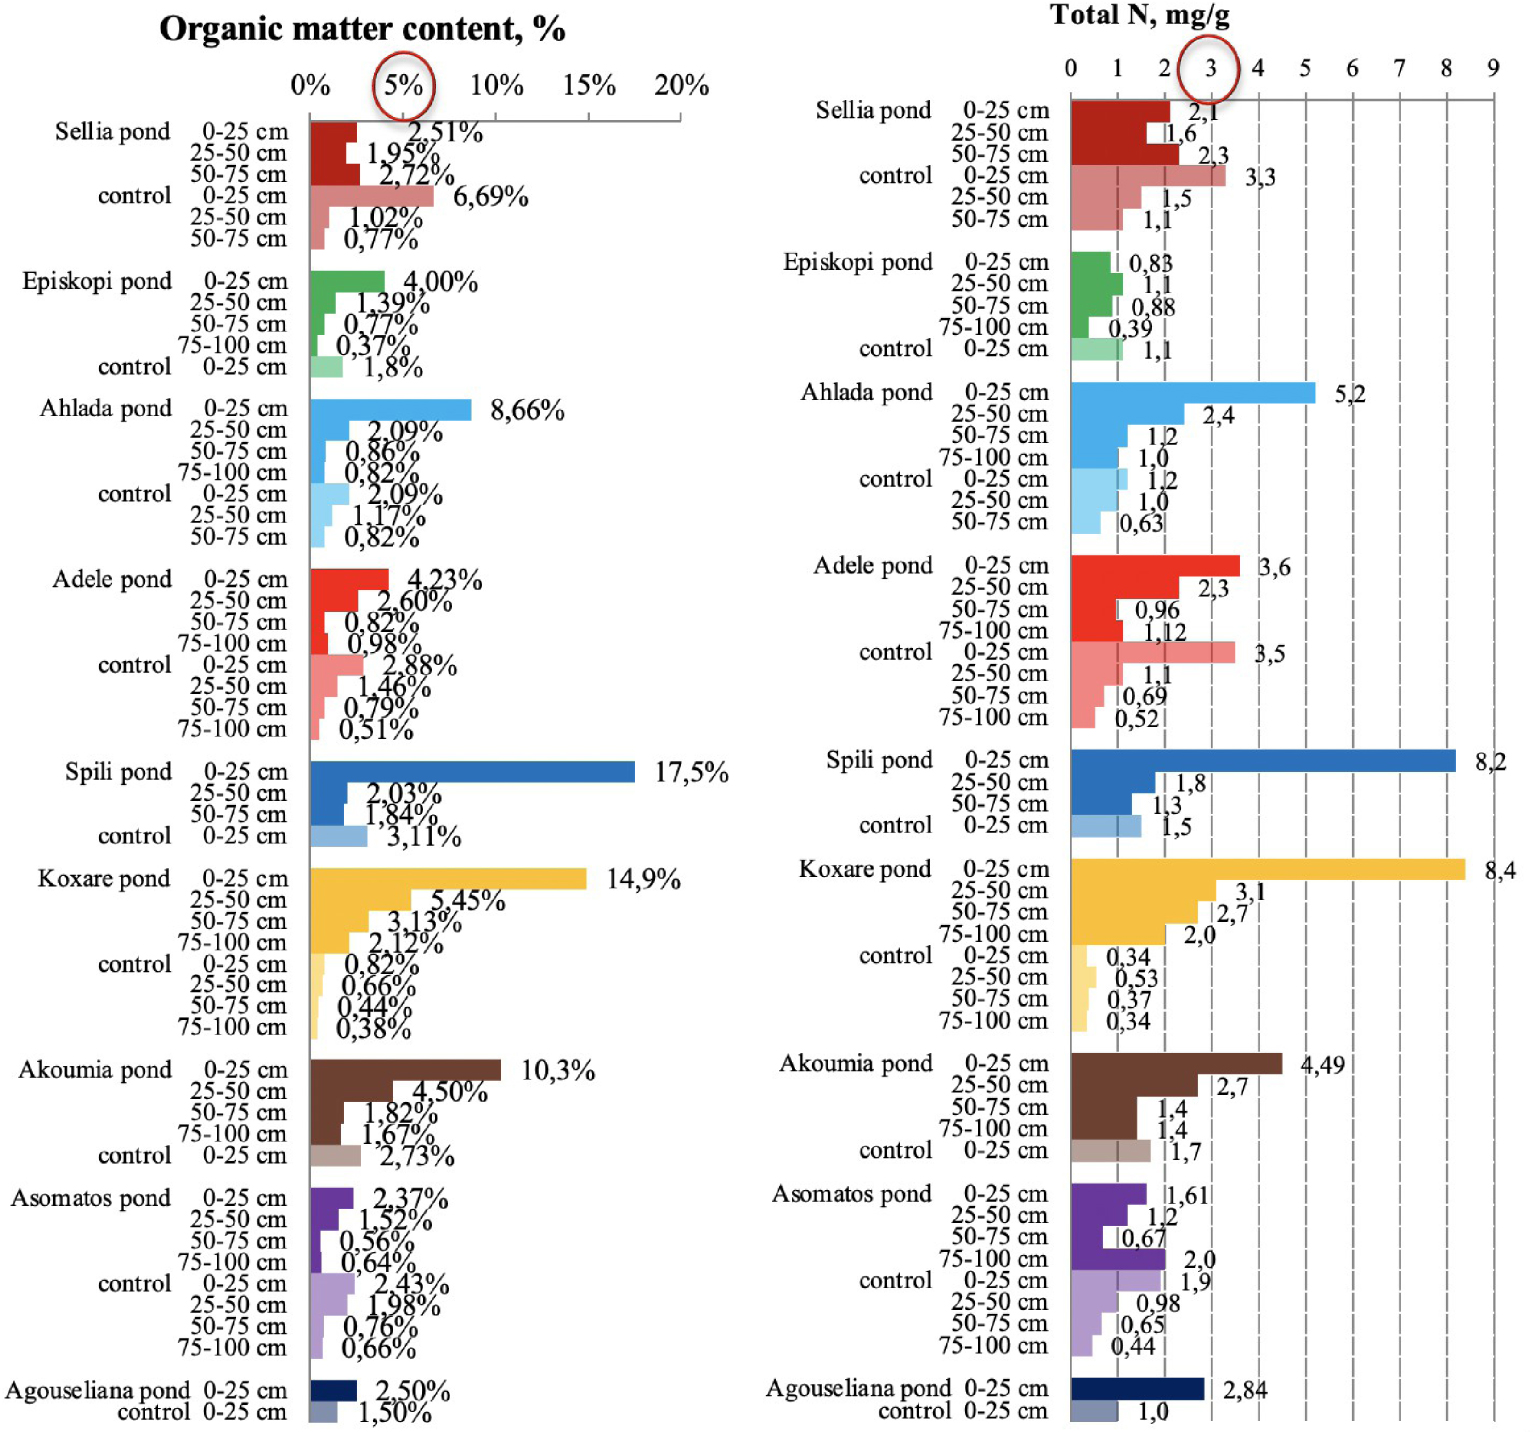
Organic matter and total Kjeldahl nitrogen content in soil samples collected from the nine disposal areas in Crete. The upper threshold values for the parameters are circled in red [21, 23].
Another interesting finding is that for some cases, the pH was found to increase (Sellia, Episkopi, Adele, and Asomatos). However, this result should not be considered unusual on the basis that because OMW has a low pH value, the expected effect on the soil pH is its reduction. As Tang and Yu reported [38], the direction and the magnitude of pH change depending on the concentration of organic anions in the residues, on the initial pH of the soil, and on the degree of residue decomposition. This suggestion was based on the findings of Yan et al. [39], who mentioned that the magnitude of change in soil pH involves the glycolytic pathway and the citric acid cycle. In particular, the decomposition of carbohydrates in the glycolytic pathway produces carboxylic groups, which after dissociation may decrease the soil pH. When these groups are decarboxylated in the citrate cycle, an equivalent number of protons is required, thereby inducing a rise in soil pH.
Apart from the above explanation, the pH increase has also been attributed to the production of ammonia from the microbial degradation of OMW [40].
3.2. Electrical conductivity of pond soils
In general, the ECs of all pond soils were significantly higher than the ECs of the respective control soils not only for the upper soil layers but also for the deeper layers (Figure 4). However, two of the nine cases had ECs lower than the threshold value for salinity (4 mS/cm) [21, 23]. Moreover, for eight cases, there was a substantial increase in EC in comparison to the control soils. It should, however, be noted that the selected areas had not been monitored in the past and no further information such as years of disposal, pretreatment of wastes, and so on was available. Therefore it is not possible to correlate the results with the ponds’ history. Nevertheless, the general conclusion drawn by Kavvadias et al. [23] after studying ponds where OMW disposal ceased for more than 8 years was that the increase in salinity appears to be irreversible when excessive amounts of OMWs were applied on soils, especially in the upper soil layers.
3.3. Organic matter and nitrogen in pond soils
High concentrations of OM were measured to a depth of 1 m in many areas (Figure 5), indicating a significant quantity of organic carbon as was also found for the five ponds in the main pilot area of the PROSODOL project [23]. For topsoils (0–25 cm), in all cases, the OM content was higher than 2%, while there were also cases of very high OM (up to 17%). Although the increase in OM content could be very beneficial to soils (increases fertility, sequesters carbon, provides nutrients, improves physical properties, protects against erosion, etc.), its extensive increase does not translate to more benefits. In fact, the addition of labile OM (not well stabilized) may decrease stocks of soil organic carbon. This happens because unstabilized OM decomposes quickly, which enhances the decomposition of native soil OM [41]. Saviozzi et al. [42] reported variable decomposition rates in soils amended with OMW, which are distinguished by a fast primary phase, in which the decomposable fraction is rapidly degraded, and a slower secondary phase, in which the more stable fraction is degraded. In addition, Pezzolla et al. [43] demonstrated that the application of organic fertilizer that is not well stabilized on the soil causes a significant increase in dissolved organic carbon and consequently CO2 emissions. This is due to the rapid rise in microbial respiration resulting from the presence of available labile carbon. Therefore, this explains the small increase in OM observed in some of the ponds and a large increase in others. In addition, the excessive increase in OM is not necessarily beneficial to the soil system.
In general, OM and total nitrogen are well correlated (Figure 5). This is because the total nitrogen content in the upper soil layer was very high (higher than the value considered as the upper threshold, which is 3 mgN/g [23]) for the majority of the examined cases (except two). Moreover, high values were also measured to a depth of 1 m. High levels of OM and residual N were also found in the control soils of some areas (e.g., Sellia) possibly due to sheep grazing since livestock farming is one of the main activities in the area of central Crete. Increased nitrogen concentration was detected also by Chartzoulakis et al. [13] after a controlled application of OMW in a plot experiment. This result was attributed to the increase in nitrogen-fixing microflora.
Evaluating the data from Figure 5, it can be observed that for the cases of a small increase in OM at Sellia, Episkopi, Asomatos, and Agouseliana ponds (probably for the reasons mentioned above), the nitrogen content is also low as compared to the other ponds. This could be due to the fact that OM is the main source of organic nitrogen. Therefore, low OM concentrations lead to low nitrogen concentrations in the soil. However, this effect may also be due to quick nitrogen mineralization and loss in soils amended with unstabilized OM [40].
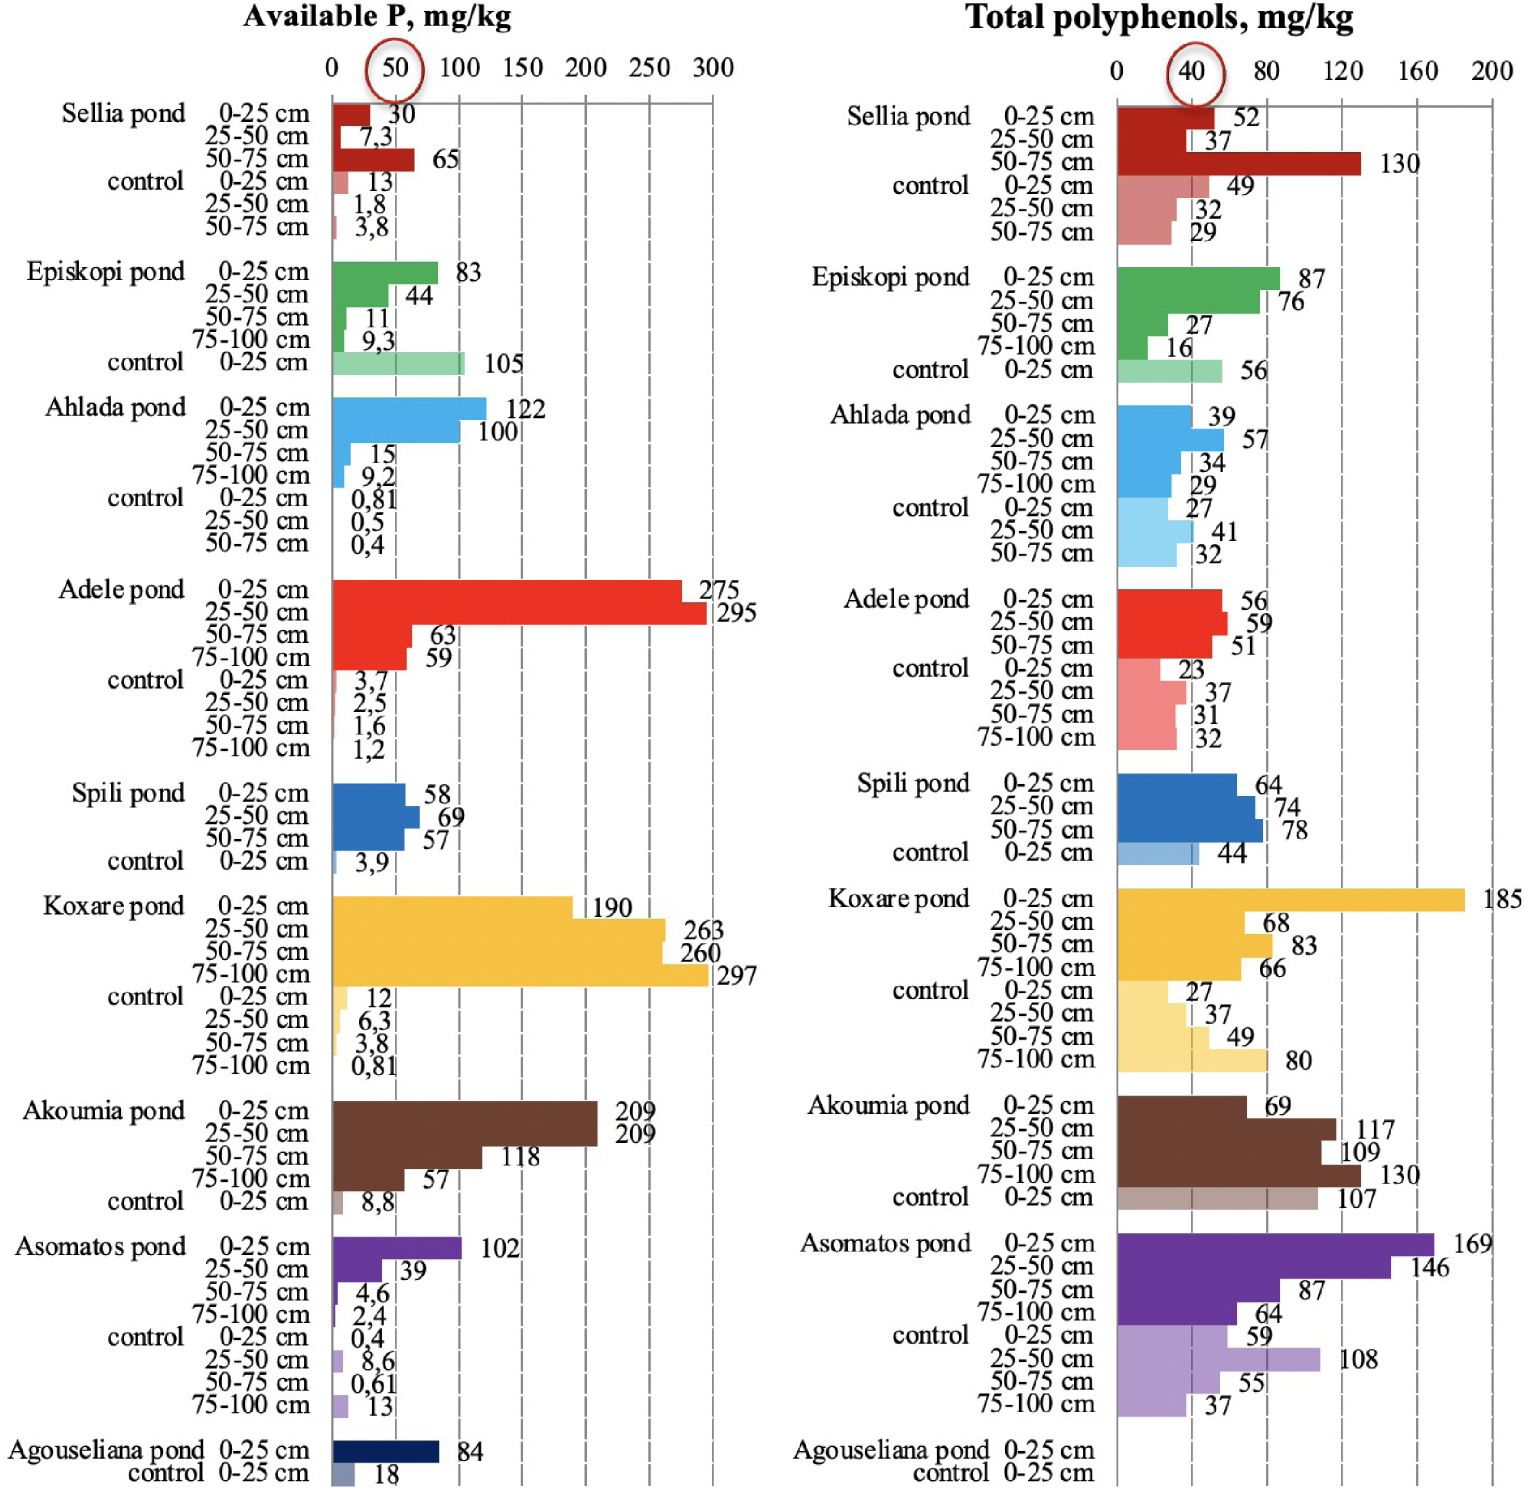
Phosphorus and total polyphenol content in soil samples collected from the nine disposal areas in Crete. The upper threshold values for the parameters are circled in red [21, 23].
3.4. Phosphorus, polyphenols, potassium, magnesium, boron, and calcium in pond soils
The available P (Figure 6) ranged between 0.4 and 13 mg/kg for control soils, while high values were measured in pond soils, ranging from 2.4 to 297 mg/kg across the soil profile. Different thresholds for available phosphorus (Olsen P) have been proposed for soils to evaluate the P mobilization risk as, for example, the value of 50 mg/kg, above which phosphorus mobility increases considerably although the soil pH has an important role in this behavior [21, 23]. In any case, phosphorus is a parameter that is significantly affected by the disposal of OMW, which was also reported in the survey of the PROSODOL project [21, 23].
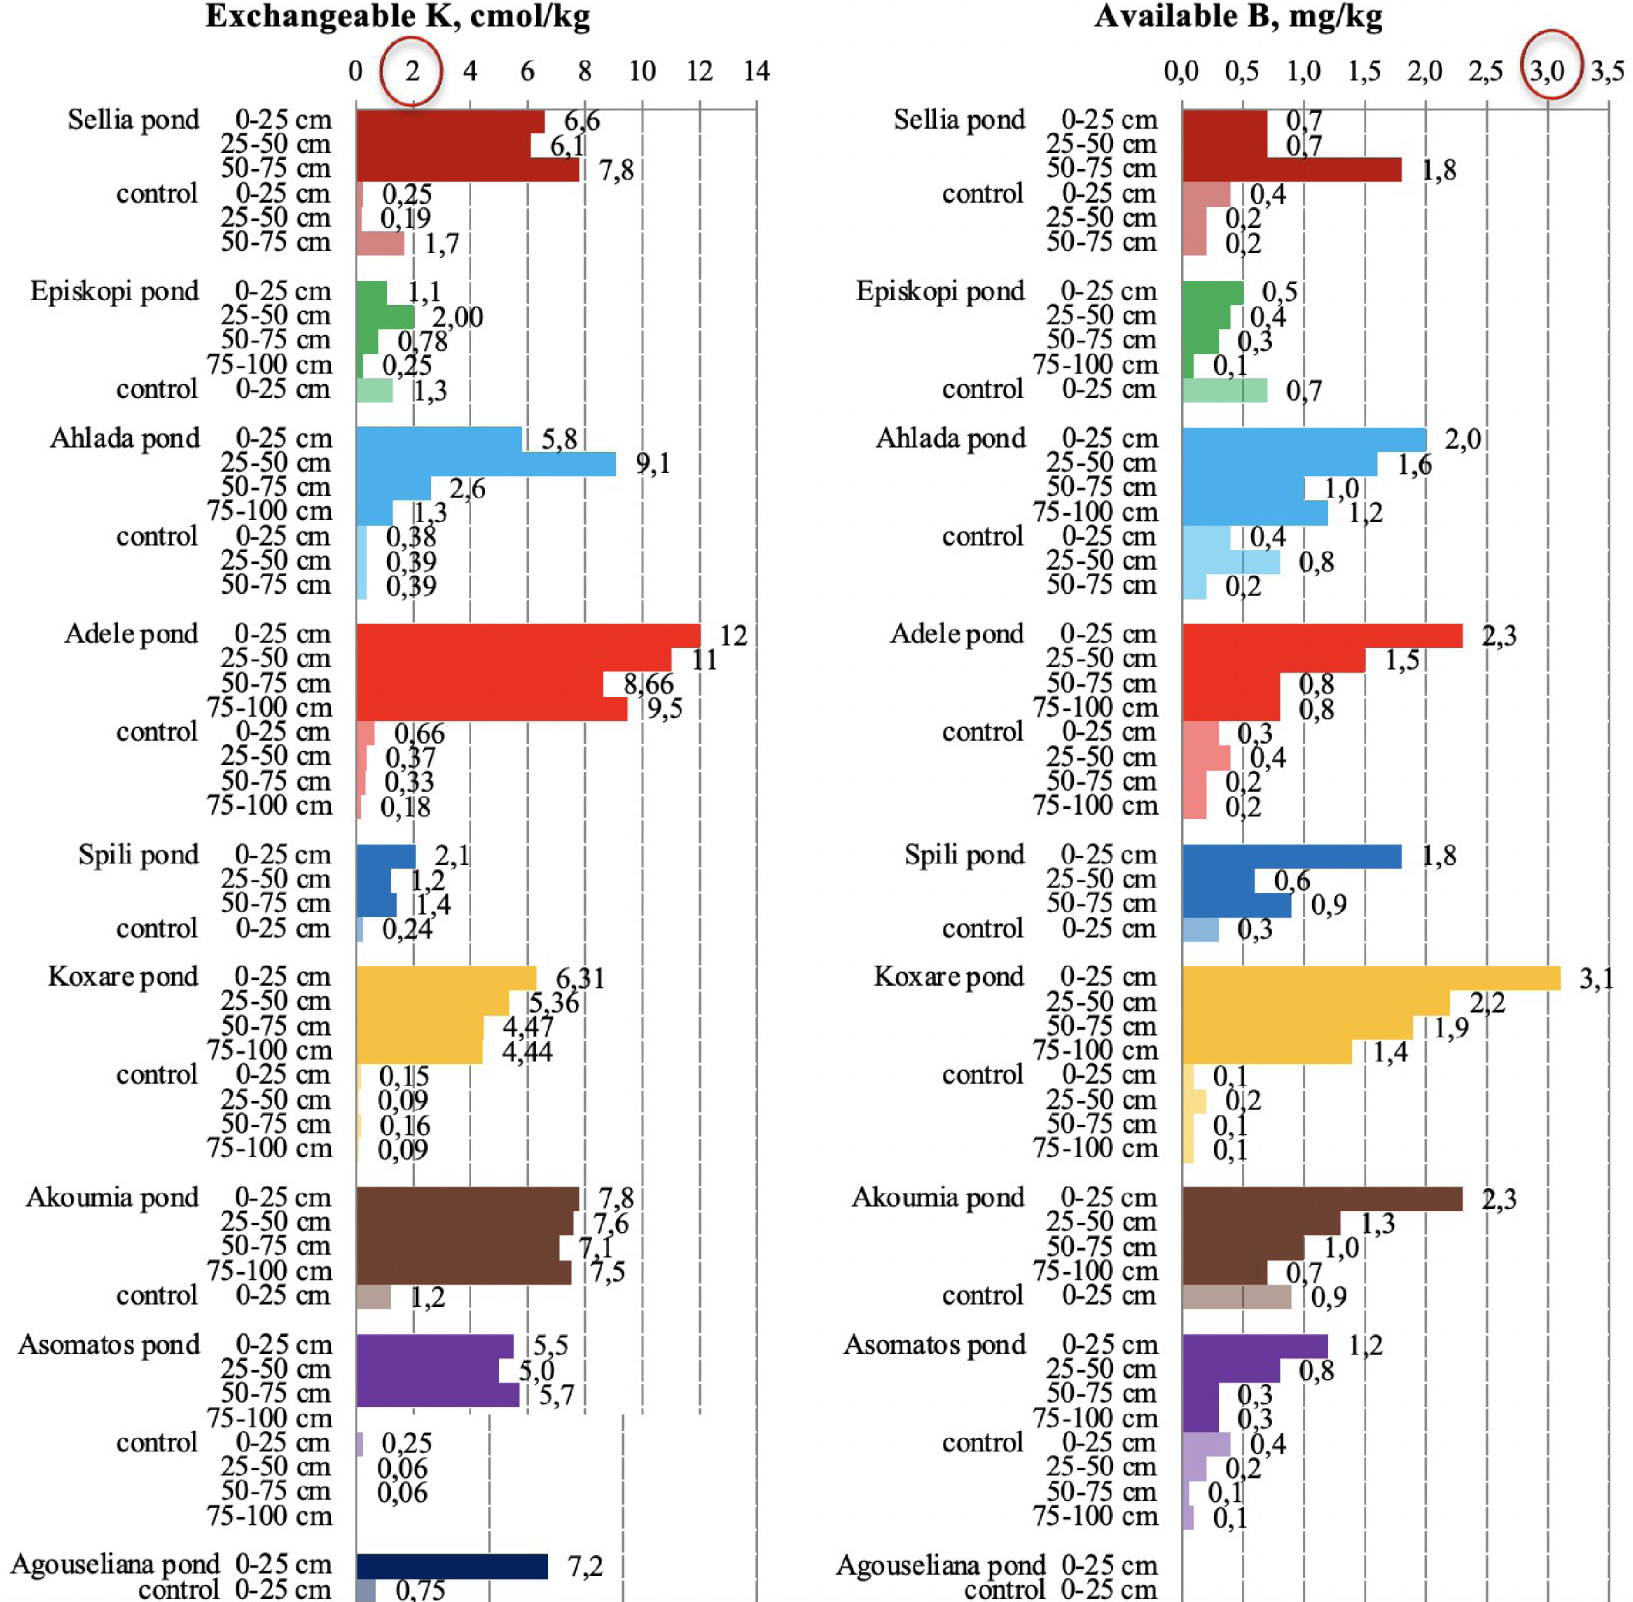
Exchangeable potassium and available boron content in soil samples collected from the nine disposal areas in Crete. The upper threshold values for the parameters are circled in red [21, 23].
In general, the assessment of polyphenol concentration in soils is considered difficult and has a high degree of uncertainty due to the lack of generally accepted thresholds [21, 23]. Thus, local and site-specific thresholds are often adopted as in the case of the study by Sierra et al. [44]. These authors decided to consider as guideline values the concentrations of phenolic substances in the control soils of their study, which varied from 14 to 25 mg/kg. Other values have been proposed as thresholds such as the value of 10.0 mg/kg as a threshold concentration of phenols in paddy soil or the value of 40 mg/kg, which has been adopted by the Netherlands [10, 11, 21, 23]. In the present study, a high percentage of the control samples (45%) had polyphenol values between 41 and 108 mg/kg, which are considered high, although the reason for that is unknown. This could be due to leakages during OMW transportation, the emptying of the solid residue from the ponds after the evaporation of wastewater, the discharge of other types of waste, or even the deposition of manure owing to the presence of animals in these areas. Nevertheless, in most of the areas, pond soils have polyphenol concentrations higher than those in the control samples.
Figure 5 indicates also that high polyphenol concentrations can be detected in deeper soil layers, which is in line with the results obtained by Mekki et al. [45], who reported that phenolic compounds migrate in soil according to their molecular mass. Thus polyphenols are adsorbed in the upper layers of the soil, while phenolic monomers can be detected at a depth of 1.2 m 1 year after irrigation with untreated OMW.
The increase in potassium concentration in soils that accept OMW has been reported by many researchers [10, 11, 13, 20]. The very high exchangeable K content of the pond soils (Figure 7), especially in the upper soil layer, confirms also the observations about the main pilot area of the PROSODOL project. Namely, the 89% of K data in pond soils had values from >2 cmol(+)∕kg up to 26 cmol(+)∕kg, which were found throughout the soil profile.
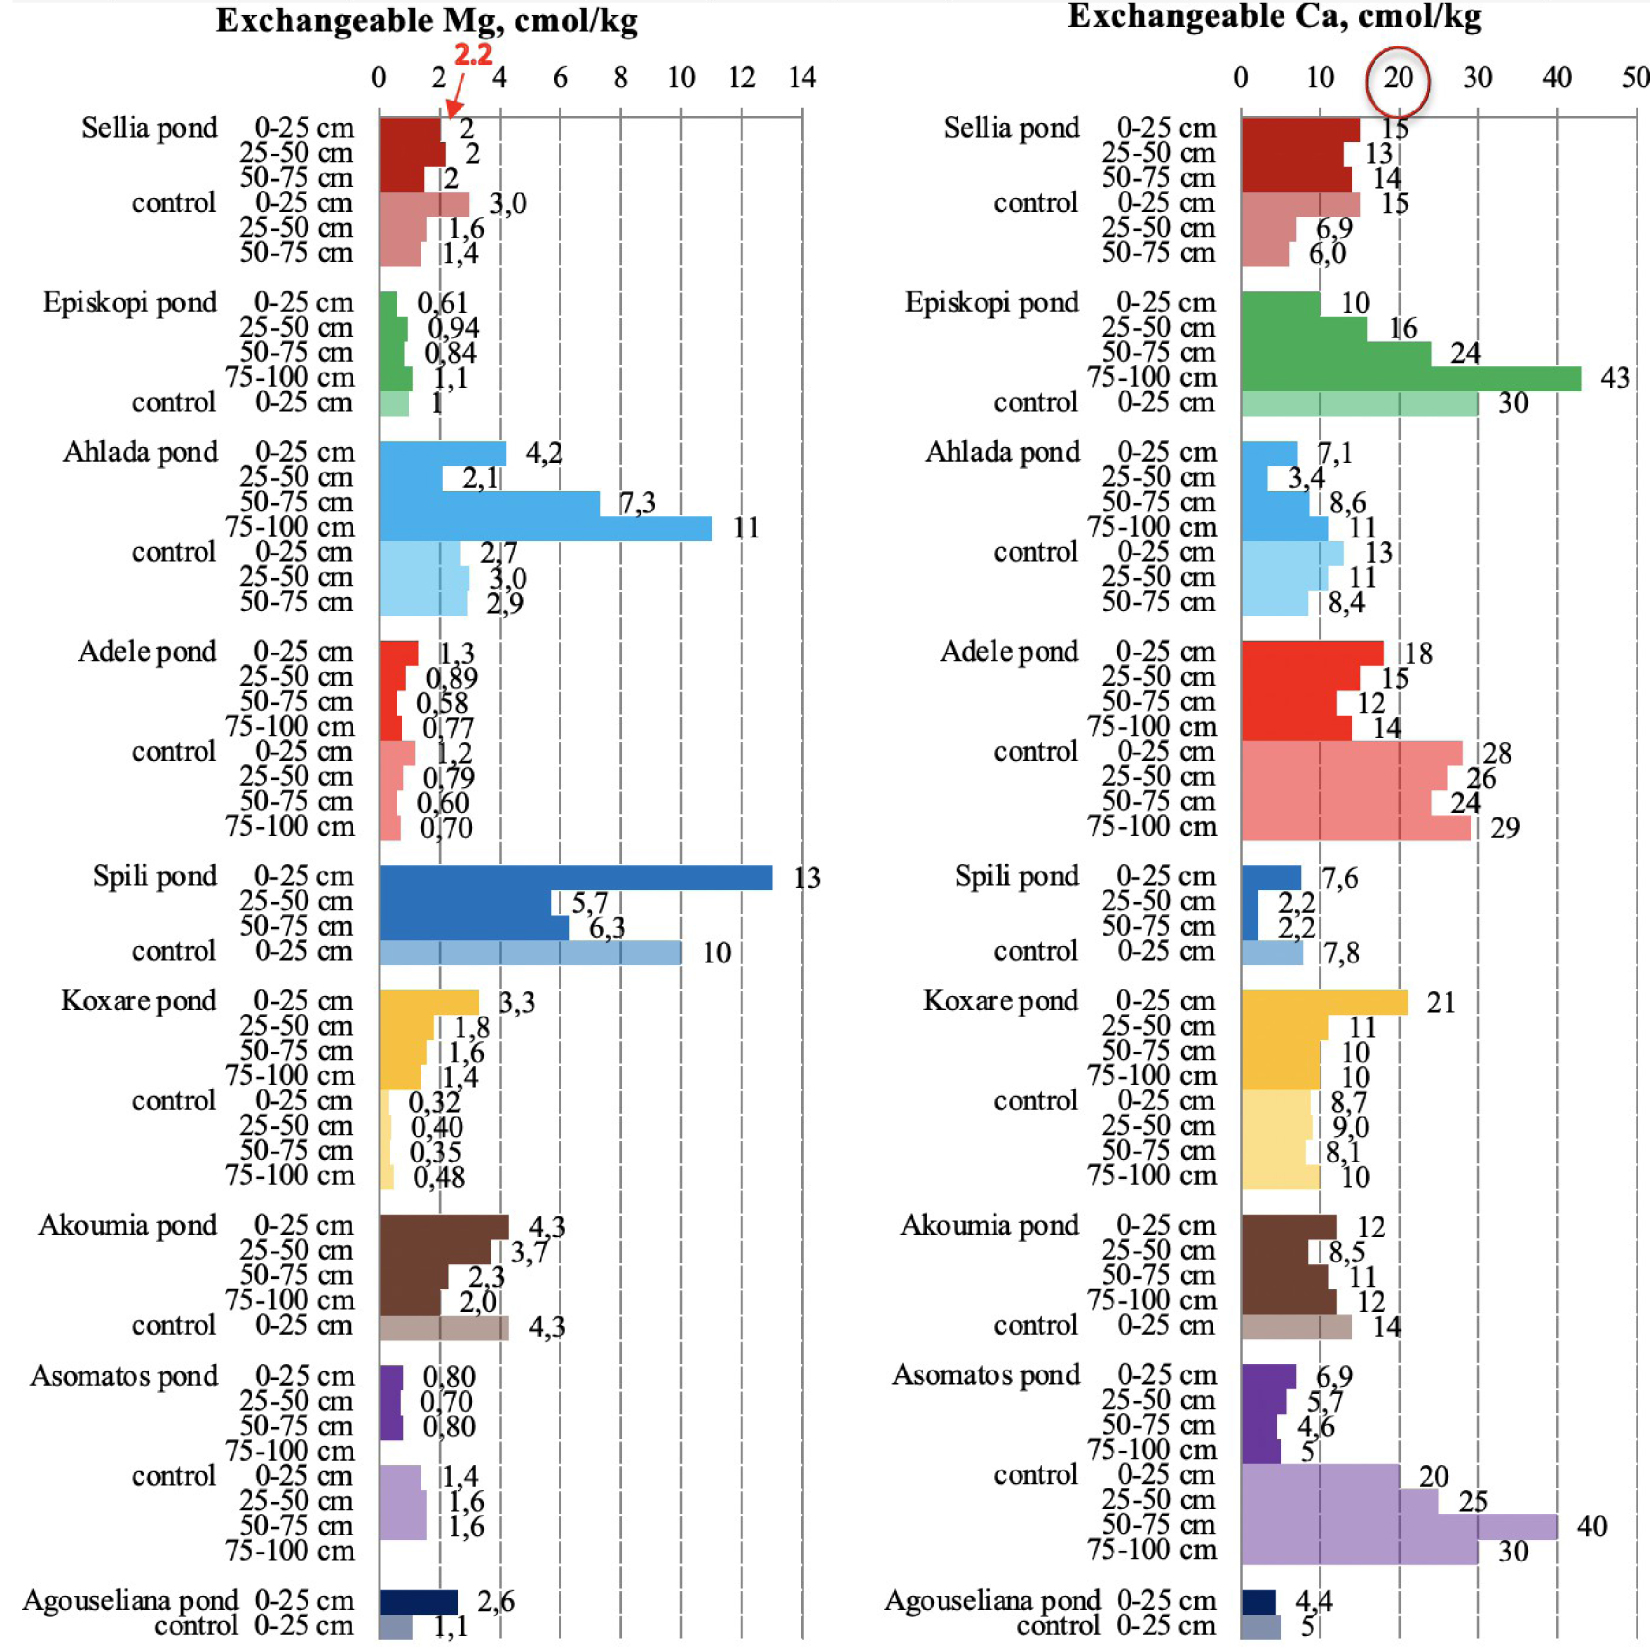
Exchangeable magnesium and calcium in soil samples collected from the nine disposal areas in Crete. The upper threshold value is numbered red for Mg and is circled in red for Ca [21, 23].
Potassium in the control soils of the nine disposal areas of this study ranged below the threshold value of 2.0 cmol(+)∕kg [23]. On the contrary, potassium accumulation was high in pond soils, and more than 80% of K data had values >2 cmol(+)∕kg up to 12 cmol(+)∕kg throughout the soil profile.
Therefore, the potential for accumulation of K in soils due to OMW disposal is high and can adversely impact soil properties. Furthermore, since excessive concentrations of the element were also found in deeper soil layers, the uncontrolled disposal of OMW in evaporation ponds may cause K leaching to groundwater, especially in soils with a high sand content. As is the case for potassium, the available boron was significantly higher in pond soils compared to control samples (Figure 7). However, to assess the potential risk from boron increase, one has to note that hot-water-soluble B levels higher than 5.0 mg/kg should be considered toxic for plants [10, 11]. Furthermore, the phytotoxic threshold values above 2–3 mg∕kg−1 were given by Kelling [45] and Alloway [47].
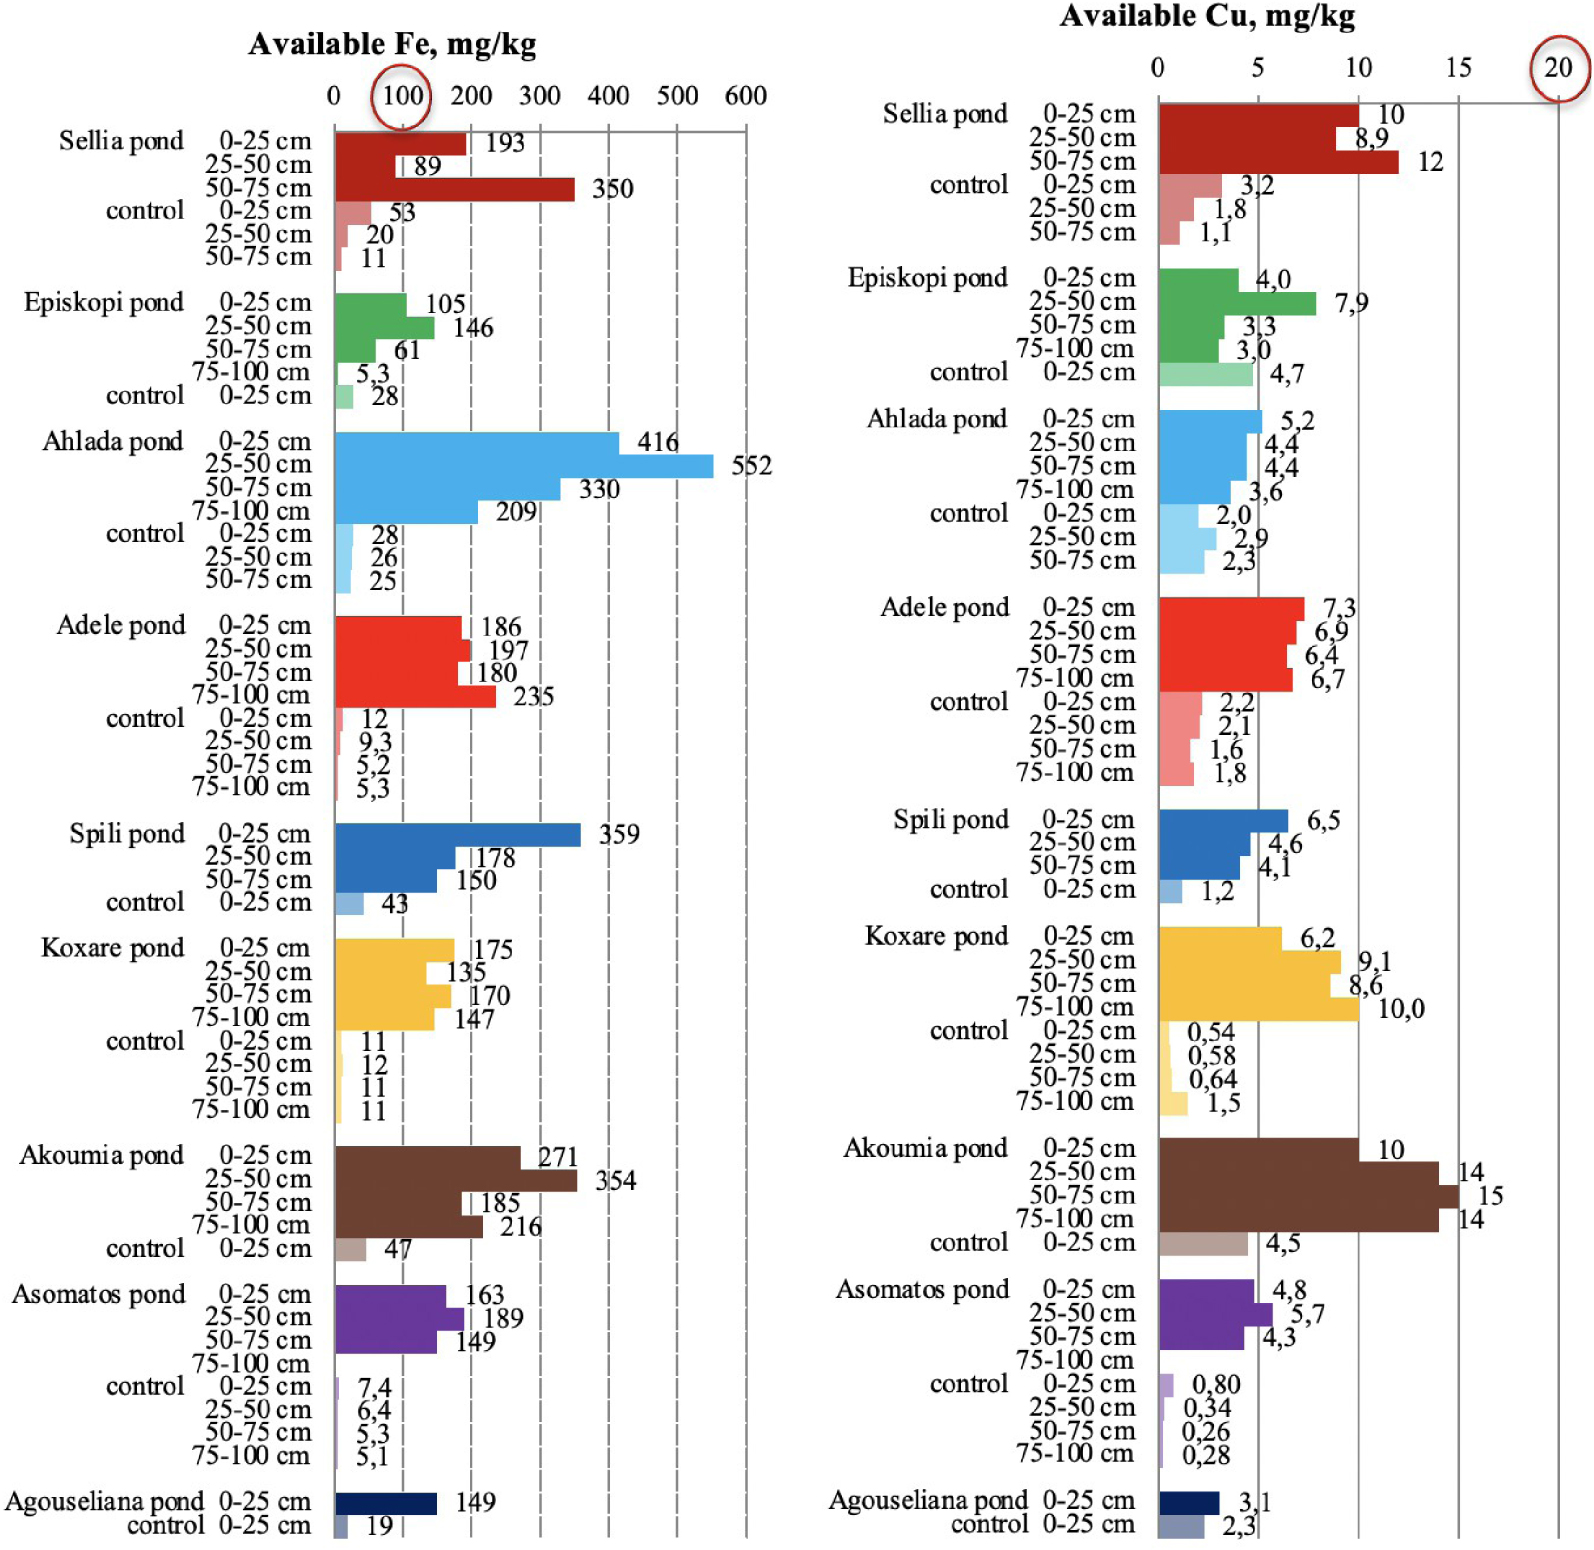
Available iron and copper in soil samples collected from the nine disposal areas in Crete. The upper threshold values for the parameters are circled in red. [21, 23].
For all the soils monitored, the exchangeable Mg content was determined to be in higher concentrations than those in the control samples (Figure 8). Approximately 25% of Mg data in pond soils ranged from 2.3 to 11 mg/kg throughout the soil profile; the concentrations >2.2 mg∕kg are characterized as high [10, 11, 21, 23].
Regarding the presence of exchangeable Ca in pond soils, there is a decreasing tendency in relation to control soils. Soils with a high CaCO3 content underwent a decrease in calcium (Episkopi, Adele, and Asomatos; Figure 3) because of CaCO3 dissolution. Similarly, a decrease in Ca was observed for soils with a low carbonate content (Achlada, Spili, Koxare, Akoumia, and Agouseliana; Figure 3) for the same reason. Namely, carbonate dissolution buffers soil pH, which however does not appear to be successful since for these areas, the pH values of ponds finally decreased.
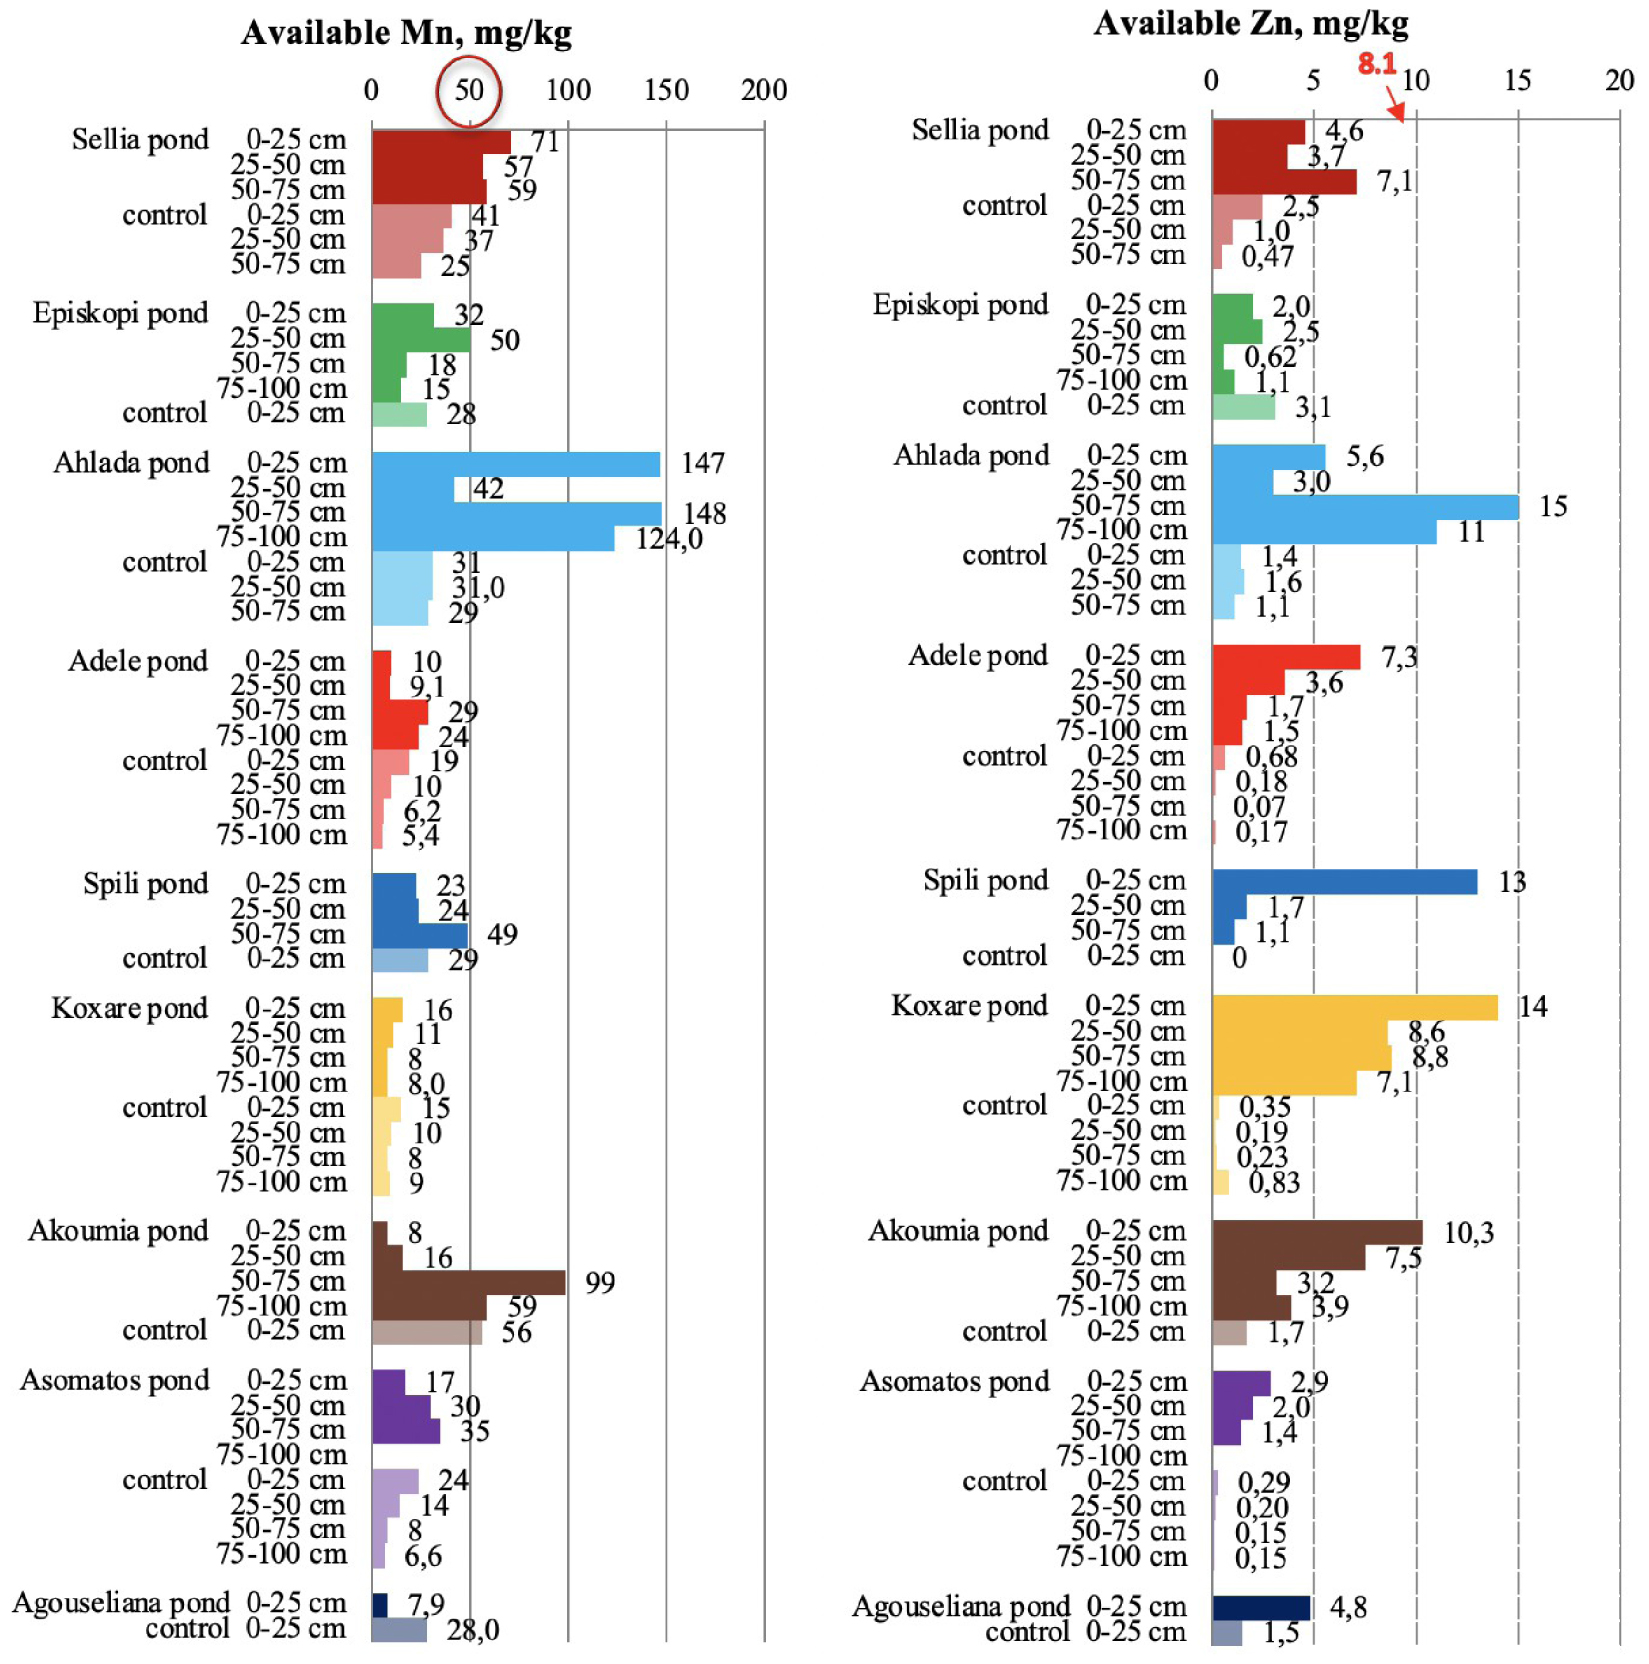
Available manganese and zinc in soil samples collected from the nine disposal areas in Crete. The upper threshold value for the metals are circled in red for Mn and numbered red for Zn [21, 23].
3.5. Iron, copper, zinc, and manganese in pond soils
Very high concentrations of available Fe and Cu were measured in soil samples collected from inside the disposal ponds (Figure 9), confirming the threat of severe soil degradation due to overloading of metals. According to the literature [21, 23, 48], normal available-Fe concentration is below 50 mg/kg, while the concentration values between 50 and 100 mg/kg are considered very high. Values higher than 100 mg/kg are considered excessive and toxic to plants. In addition, the release of other soil elements such as As and Al is possible [49]. In this study, it was found that the Fe concentrations of all pond samples were above 100 mg/kg, while most of the Fe data for control soils had values lower than 50 mg/kg.
Copper in control soils ranged from 0.3 to 4.7 mg/kg (Figure 9). A high accumulation of available Cu was recorded in pond soils, where the values ranged from 3 to 15 mg/kg across the soil profile, which are slightly lower than the toxicity limit (>15 −−16 mg∕kg) [21, 23].
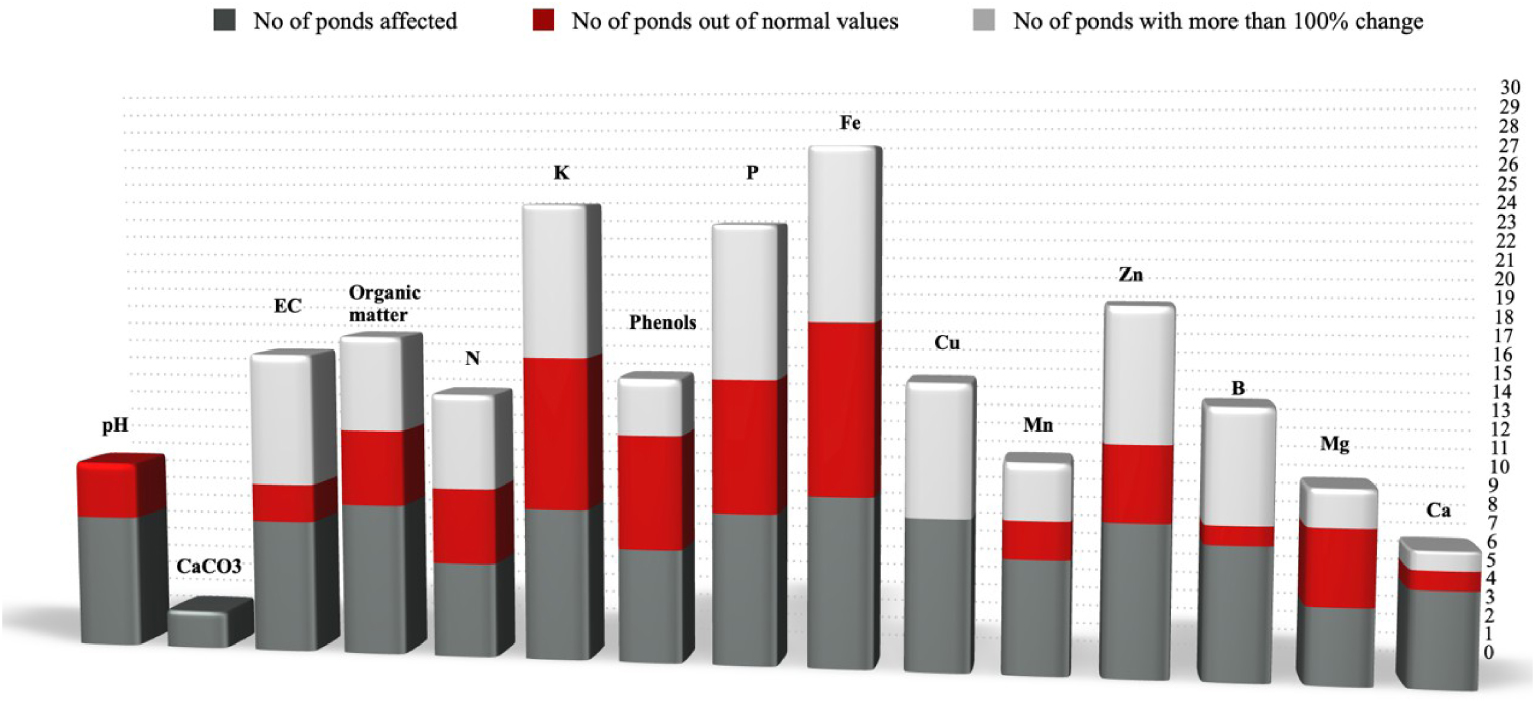
Number of ponds for which (a) changes in soil parameters were observed; (b) a parameter value was measured above the excessive threshold; (c) the change in the parameter values was >100%.
Regarding Mn (Figure 10), there were two cases among the nine ponds for which the metal had a measured value higher than the threshold value of 50 mg/kg [50]. There were also cases of Mn decrease in comparison to the control soils after OMW disposal, potentially due to waste acidity, which caused the dissolution of naturally occurring metals (e.g., Spili, Akoumia, Asomatos, and Agouseliana). Another reason could be the potential higher mobility of Mn in comparison to Fe, Zn, and Cu as Wang et al. [51] reported. On the contrary, available Zn (Figure 10) was significantly higher in pond soils than that in control soils; for many pond soils, the Zn content was higher than the threshold value of 8.1 mg/kg [21, 23]. This behavior was also detected in soils collected from the main pilot area of the PROSODOL project.
3.6. Evaluation of the proposed soil indicators
Figure 11 summarizes the changes that occur in all soil parameters measured for all the evaporation ponds to assess which of them would be suitable for soil-quality indicators and whether the outcomes of this study are in line with previous work regarding the definition of soil indicators for areas of OMW disposal [21]. For this purpose, the same evaluation factors as in the work of Doula et al. [21] were used: the number of ponds for which (a) changes in soil parameters were observed; (b) a parameter value was measured above the excessive threshold; and (c) the change in the parameter values was >100%.
From this figure, it is therefore concluded that OM, nitrogen, polyphenols, potassium, phosphorus, and iron are the properties for which all three evaluation factors yield the highest values. Electrical conductivity, although less variable compared to zinc, is nevertheless a very important property (quality indicator) of soil and is directly related to salinization, which is one of the soil threats described in the EU Thematic Strategy for Soil Protection [15]. It is therefore an important indicator that should be identified and evaluated even though it did not exhibit significant variations in the areas of this study. Zinc exhibits a dynamic profile although the number of ponds with values above the excessive value is relatively small compared to the values of the other two evaluation factors for this element. However, it could be further evaluated as a potential indicator in the future. Although the pH did not generally show significant fluctuations, a considerable change in this parameter indicates a decrease in the soil buffering capacity. Therefore, this parameter should be always determined.
4. Conclusions
An unsustainable practice for OMW management is discharge into evaporation ponds without following protective measures for soils and aquifers. Previous research reported benefits for soil when specific doses of OMW were applied followed by frequent monitoring of soil quality. The high content of OM and plant nutrients such as Fe, Mg N, K, P, and so on makes OMW not only a valuable material for agriculture but also a threat when used without regulations and precautionary measures. This study focused on confirming the results of previous research work, which suggested that pH, OM, total nitrogen, polyphenols, exchangeable potassium, available phosphorus, and iron are appropriate indicators for assessing soil quality at OMW disposal areas. Therefore, these indicators were tested at nine OMW disposal areas, which were selected randomly without any knowledge of their history or other details regarding current activities in the vicinity of the evaporation ponds. The study revealed that all the tested soil parameters were affected, some to a large and some to a lesser extent. It was confirmed that a high carbonate content protects soils against the acidity of OMW. However, apart from a potential decrease in soil pH due to the acidic character of OMW, an increase in pH is also an anticipated behaviour due to decarboxylation of OM and ammonia production. From all the tested soil properties, iron and potassium were found to be affected to the greatest extent. Organic matter, nitrogen, phosphorus, and polyphenols were also affected. Therefore these, along with potassium and iron, are considered appropriate indicators for OMW disposal areas. Electrical conductivity, although not found to be affected to a similar extent as in previous works, is an important property (quality indicator) of soil and is directly related to salinization. Therefore, it should be identified and evaluated. A parameter that has not been proposed to belong to the set of indicators is zinc, which presented a dynamic profile as a potential indicator in this study. Therefore, it is proposed as a potential indicator to be further evaluated in the future. Finally, although the pH did not generally show significant changes, this parameter is strongly related to the buffering capacity of soils. Therefore, it should be always determined at such degraded areas.
Vous devez vous connecter pour continuer.
S'authentifier