

 CC-BY 4.0
1. Introduction
Coumarin (known as 1,2-benzopyron) and its derivatives consist of an aromatic ring coupled to an 𝛼-pyrone ring. These compounds are widely spread in nature, being found as secondary metabolites in green plants, fruits, green tea, fungi, bacteria, and some animal species [1]. Coumarins display a remarkable array of biochemical activities such as anti-inflammatory, antioxidant, anticancer, antiviral, and anticoagulant properties [2, 3]. Few studies evaluated the consumption of coumarins in foods and their clinical relevance. Thus, because of their beneficial effects on human health, coumarins raised considerable interest in the pharmaceutical industry [4]. For this reason, extensive investigations have led to the development of numerous techniques for their synthesis.
Many of the described biological and pharmacological activities of coumarins might be a consequence of their antioxidant activities [5]. High levels of free radicals, in the first-line reactive oxygen species (ROS), cause significant damage to important biological macromolecules, such as lipids, proteins, and DNA, and thus may contribute to the development of many diseases such as cancer, inflammation, diabetes, cataracts, autism, cardiovascular, and Alzheimer’s disease, and aging in aerobic organisms [6]. Coumarin derivatives with antioxidant properties may contribute to the protection of cells from oxidative stress and also lower the risk of chronic diseases [7]. Theoretical methods were, as well, employed to investigate the antioxidant activity of simple coumarins and coumarin–chalcone derivatives [8, 9]. On the one hand, different studies indicate the effective action of coumarin derivatives in preventing cell proliferation of various cancers [10] as well as interference with the normal functioning of diverse strains of microorganisms [11]. Therefore, the design of new coumarin derivatives that can be used as drugs and complementary medicine supplements presents a challenge in modern science. On the other hand, the design of new coumarin derivatives with antioxidant properties can be beneficial for the pharmaceutical industry.
4,7-Dihydroxycoumarin and its derivatives are an important class of the coumarin family. However, the biological activities of 4,7-dihydroxycoumarin derivatives have not been extensively studied in the scientific literature so far. Due to the pronounced biological and pharmacological properties of the parent molecule, three new aminophenol derivatives are synthesized in this work.
This work aims to structurally and theoretically describe three novel coumarin derivatives with aminophenols, along with their antimicrobial and cytotoxic activities. The crystallographic structure of (E)-3-(1-((3-hydroxyphenyl)amino)ethylidene)-2,4-dioxochroman-7-yl acetate is obtained and solved. All compounds are characterized by different spectroscopic methods (IR, 1H NMR, 13C NMR, and UV/Vis) in conjunction with DFT optimization of the structure. Also, the results of cytotoxic activity of investigated compounds against four different cell lines, human colon cancer (HCT-116), human cervix cancer (HeLa), human breast cancer (MDA-MB-231), and healthy human lung fibroblast (MRC-5), are reported. The antimicrobial activity was screened against 13 strains of microorganisms determining the minimum inhibitory concentration (MIC) and the minimum microbicidal concentration (MMC) using the microdilution method. The molecular docking simulation of synthesized compounds with epidermal growth factor receptors (EGFR) was performed.
2. Experimental section
2.1. Chemicals and instrumentations
All chemicals of analytical grade were purchased from commercial suppliers: Sigma-Aldrich Chemical Company (St. Louis, MO), Difco, and Merck Laboratory Supplies (Darmstadt, Germany). The elemental microanalysis of C, H, and N was performed on the Vario EL III C, H, and N Elemental Analyzer. For IR spectral measurements, Perkin–Elmer Spectrum spectrophotometer was employed using the KBr pellet technique (range of wavenumbers 4000–400 cm−1). 1H and 13C NMR spectral analyses were carried out using Varian Gemini-2000 spectrometer (1H NMR at 200 MHz, 13C NMR at 50 MHz) at 298 K in CDCl3 with tetramethylsilane (TMS) as an internal standard. The UV–Vis spectra were measured on a Thermo Scientific Evolution 220 spectrophotometer in the range between 200 and 450 nm.
2.2. General synthesis procedure
The synthesis of the 4,7-dihydroxycoumarin derivatives (3a–3c) was performed according to Scheme 1. New coumarin derivatives were synthesized in the reaction of the previously synthesized compound (1) [12] and different aminophenol derivatives (2) (0.002 mol) at 3-hour reflux in ethanol (50 ml). Progress of reactions was monitored by Thin Layer chromatography (toluene:acetone = 7:3). When the reaction was completed the mixture was cooled to room temperature. The obtained precipitate was filtered and air-dried. Recrystallization was performed by dissolving the obtained compounds in methanol through stirring and heating, and then cooling to room temperature. The structures of the synthesized compounds were confirmed by FT-IR, 1H NMR, 13C NMR, and UV/Vis spectroscopic methods, while compound 3b was characterized by X-ray analyses.
General procedure for the synthesis of coumarin derivatives with atomic numbering. Reagents and conditions: (a) EtOH, reflux, 3 hours.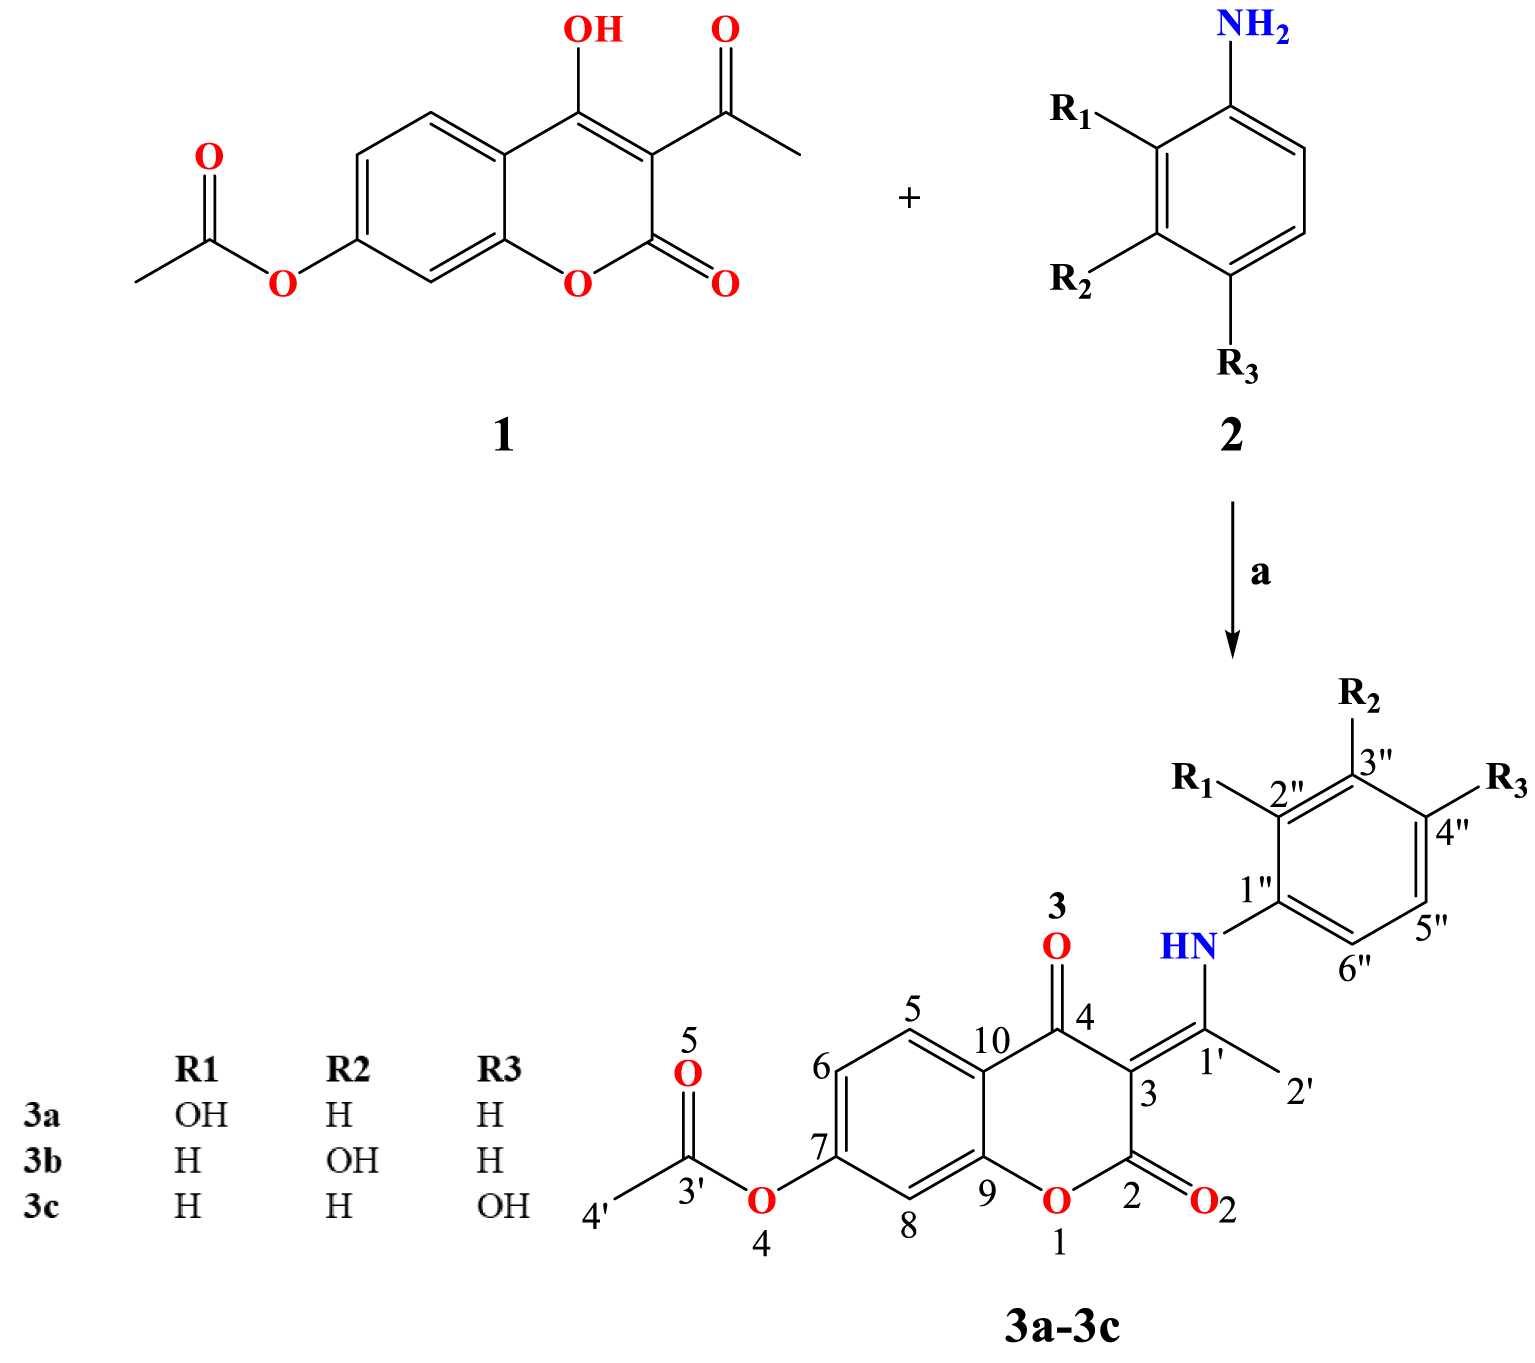
(E)-3-(1-((2-hydroxyphenyl)amino)ethylidene)-2,4-dioxochroman-7-yl acetate (3a) Yield, 0.416 g (83.37%). 1H NMR (DMSO-d6, 200 MHz) (𝛿 ppm): 2.32 (3H, s, C4′–H), 2.61 (3H, s, C2′–H), 6.94 (1H, m, C3′′–H), 7.15 (5H, m, C6–H, C8–H, C4′′–H, C5′′–H, C6′′–H), 8.03 (1H, m, C5–H), 10.42 (1H, bs, OH), 15.17 (1H, bs, NH). 13C NMR (DMSO-d6, 50 MHz) (𝛿 ppm): 20.59 (C2′), 21.08 (C4′), 96.69 (C3), 109.88 (C8), 116.64 (10), 117.75 (C3′′), 118.07 (C6), 119.12 (C5′′), 119.49 (C6′′), 123.25 (C4′′), 127.16 (C1′′), 129.65 (C5), 151.54 (C2′′), 153.86 (C7), 154.87 (C9), 161.42 (C2) 168.68 (C1′), 176.02 (C3′), 179.60 (C4). IR (KBr) 𝜈 cm−1: 3078 (O–H), 2935 (N–H), 1765, 1711 (C=O), 1608, 1570, 1552, 1508, 1462, 1441 (C=C), 1207 (C–O).
(E)-3-(1-((3-hydroxyphenyl)amino)ethylidene)-2,4-dioxochroman-7-yl acetate (3b) Yield, 0.404 g (80.96%). 1H NMR (DMSO-d6, 200 MHz) (𝛿 ppm): 2.32 (3H, s, C4′–H), 2.63 (3H, s, C2′–H), 6.81 (3H, m, C4′′–H, C5′′–H, C6′′–H), 7.20 (3H, m, C6–H, C8–H, C2′′–H), 8.01 (1H, m, C5–H), 9.98 (1H, bs, OH), 15.37 (1H, bs, NH). 13C NMR (DMSO-d6, 50 MHz) (𝛿 ppm): 20.63 (C2′), 21.06 (C4′), 96.92 (C3), 109.88 (C2′′), 112.46 (C8), 115.47 (C4′′), 116.14 (C10), 117.61 (C6′′), 119.17 (C6), 126.72 (C5′′) 127.15 (C5), 130.53 (C1′′), 136.81 (C7), 153.86 (C9), 154.93 (C3′′), 158.36 (C2), 168.64 (C1′), 175.75 (C3′), 179.70 (C4). IR (KBr) 𝜈 cm−1: 3331 (O–H), 3080 (N–H), 1765, 1678 (C=O), 1618, 1579, 1497, 1458 (C=C), 1205 (C–O).
(E)-3-(1-((4-hydroxyphenyl)amino)ethylidene)-2,4-dioxochroman-7-yl acetate (3c) Yield, 0.425 g (85.17%). 1H NMR (DMSO-d6, 200 MHz) (𝛿 ppm): 2.31 (3H, s, C4–’H), 2.56 (3H, s, C2′–H), 6.88 (2H, m, C2′′–H, C6′′–H), 7.12 (2H, m, C3′′–H, C5′′–H), 7.23 (2H, m, C6–H, C8–H), 8.00 (1H, d, 3 JH-5,H-6 = 8.4 Hz, C5–H), 9.91 (1H, bs, OH), 15.24 (1H, bs, NH). 13C NMR (DMSO-d6, 50 MHz) (𝛿 ppm): 20.49 (C2′), 21.05 (C4′), 96.73 (C3), 109.84 (C8), 116.09 (C10), 117.71 (C3′′, C5′′), 118.04 (C6), 126.85 (C2′′, C6′′), 127.00 (C5), 127.10 (C1′′), 153.82 (C4′′), 154.83 (C7), 157.35 (C9), 161.48 (C2), 168.64 (C1′), 175.75 (C3′), 179.50 (C4). IR (KBr) 𝜈 cm−1: 3188 (O–H), 3080 (N–H), 1768, 1714 (C =O), 1614, 1549, 1518, 1443 (C =C), 1203 (C–O).
2.3. X-ray
X-ray diffraction data for 3b were collected at room temperature using graphite-monochromated MoK𝛼 radiation (𝜆 = 0.71073 ) on an Oxford Diffraction Gemini S diffractometer. CrysAlisPro and CrysAlis RED software packages [13] were employed for data collection and data integration. Final cell parameters were determined by a global refinement of 942 reflections (3.0 <𝜃< 25.3°). Collected data for 3b were corrected for absorption effects using the Multiscan method, applying an empirical absorption correction using spherical harmonics [14] as implemented in SCALE3 ABSPACK [13] scaling algorithm.
Structure solution and refinement for 3b were carried out with the programs SHELXT [15] and SHELXL-2018/3 [16], respectively. MERCURY [17] was employed for molecular graphics and OLEX2 [18] software was used to prepare the material for publication. Non-hydrogen atoms were refined freely with anisotropic displacement parameters. Hydrogen atoms attached to carbon atoms were placed in geometrically idealized positions and refined as riding on their parent atoms, with C–H = 0.93 and Uiso(H) = 1.2Ueq(C) for methine groups, and with C–H = 0.96 and Uiso(H) = 1.5Ueq(C) for methyl groups. Hydrogen atom attached to oxygen and nitrogen were located in a difference Fourier map and refined isotropically. Crystal data and experimental details of the structure determination are listed in Table 1.
Crystallographic data and refinement parameters for (E)-3-(1-((3-hydroxyphenyl)amino) ethylidene)-2,4-dioxochroman-7-yl acetate (3b)
| Crystal data | |
|---|---|
| Compound | 3b |
| Chemical formula | C19H15NO6 |
| Mr | 353.32 |
| Crystal system, space group | Monoclinic, P21∕c |
| Temperature (K) | 293 |
| a, b, c (Å) | 13.0302 (8), 4.6054 (4), 27.202 (3) |
| 𝛽 (°) | 98.207 (7) |
| V (3) | 1615.6 (2) |
| Z | 4 |
| Dx (Mg⋅m−3) | 1.453 |
| μ (mm−1) | 0.11 |
| Data collection | |
| Absorption correction | Multiscan CrysAlis PRO 1.171.40.53 (Rigaku Oxford Diffraction, 2019) |
Tmin, Tmax | 0.915, 1.000 |
| No. of measured, independent, and observed [I > 2𝜎(I)] reflections | 6921, 3759, 1947 |
| Rint | 0.036 |
| 𝜃 values (°) | 𝜃max = 29.2, 𝜃min = 2.0 |
| Range of h, k, l | h = −17→14, k = −6→5, l = −20→34 |
| Refinement | |
| Refinement on | F2 |
| R[F2 > 2𝜎(F2)], wR(F2),S | 0.083, 0.221, 1.04 |
| No. of reflections | 3759 |
| No. of parameters | 245 |
| No. of restraints | 0 |
| H-atom treatment | H atoms treated by a mixture of independent and constrained refinement |
| Weighting scheme | where |
| 𝛥𝜌max, 𝛥𝜌min (e⋅−3) | 0.43, −0.25 |
2.4. Hirshfeld surface analysis (HSA)
Intermolecular interactions are important for the overall stability of crystal; therefore, it is of great interest to quantify them with the Hirshfeld surface analysis (HSA) that could be performed on the CIF file output (3b). 2D-fingerprint plots were prepared by the CrystalExplorer17 software [19]. The main parameter in the discussion of the results is the normalized contact distance (dnorm), which can be calculated using the following equation:
| (1) |
2.5. Cytotoxic activity
Four human cell lines, HCT-116 (colorectal cancer), MDA-MB-231 (breast cancer), HeLa (cervix cancer), and healthy lung fibroblast cells MRC-5, were obtained from ATCC (Manassas, VA, USA), and routinely cultured in 75 cm2 cell culture flasks, in DMEM medium supplemented with 10% of FBS and 1% penicillin/streptomycin, at 37 °C with 5% of CO2 in a humified incubator.
The tested chemicals were dissolved in DMSO and diluted in an adequate volume of culture medium. The stock solution (100 mM) was sterilized by S 0.2 and diluted in culture medium to various working concentrations. The final DMSO concentration in treatment was less than 0.5%, hence not toxic to the cells [21].
2.5.1. MTT test of cytotoxicity
The cytotoxic effects of tested chemical compounds were measured on HCT-116, MDA-231, HELA, and healthy MRC-5 cells using MTT test, 24 and 72 hours after treatment. The assay was done according to the protocol previously described in detail [22]. The evaluation of the cytotoxic effects of tested compounds was based on the obtained IC50 values, which represent the treatment doses that induce the death of 50% of treated cells.
2.6. Antimicrobial activity
The antimicrobial activity of the compounds was tested against 13 microorganisms. The experiment involved 12 strains of bacteria (4 standard strains, 3 clinical isolates, 5 isolates from nature) and 1 yeast species. All clinical isolates were a generous gift from the Institute of Public Health, Kragujevac. The other microorganisms were provided from the collection held by the Microbiology Laboratory Faculty of Science, University of Kragujevac.
The bacterial suspensions were prepared by the direct colony method. The turbidity of the initial suspension was adjusted using a densitometer (DEN-1, BioSan, Latvia). When adjusted to the turbidity of the 0.5 McFarland’s standard [23] the bacteria suspension contains about 108 colony forming units (CFU)/mL and the suspension of yeast contains 106 CFU/mL. Ten-fold dilutions of the initial suspension were additionally prepared into sterile 0.85% saline. Microbial inocula were obtained from cultures incubated for 24 hours at 37 °C for bacteria and 48 hours at 27 °C for yeast and brought up by dilution according to the 0.5 McFarland standard to approximately 106 CFU/mL and 108 CFU/mL, respectively.
Antimicrobial activity was tested by determining the minimum inhibitory concentrations (MIC) and minimum microbicidal concentration (MMC) using the microdilution plate method with resazurin [24]. The 96-well plates were prepared by dispensing 100 μL of nutrient broth, Mueller–Hinton broth for bacteria and Sabouraud dextrose broth for yeast, into each well. The tested compounds were dissolved in DMSO and then diluted into a nutrient liquid medium to achieve a concentration of 10%. A 100 μL aliquot from the stock solution of the tested compound (with a concentration of 2000 μg∕mL) was added to the first row of the plate. Then, two-fold serial dilutions were performed by using a multichannel pipette. The obtained concentration range was from 1000 to 7.8 μg∕mL. The method is described in detail in the reported paper [25].
Doxycycline and fluconazole were used as a positive control. 10% DMSO (as solvent control test) was recorded not to inhibit the growth of microorganisms. Each test included growth control and sterility control. All the tests were performed in duplicate and the MICs were constant. Minimum microbicidal concentrations were determined by plating 10 μL of samples from wells with no indicator color change on nutrient agar medium. At the end of the incubation period, the lowest concentration with no growth (no colony) was defined as the minimum microbicidal concentration.
2.7. Computational methodology
All calculations were performed by employing the Gaussian09 program package and B3LYP-D3BJ functional in conjunction with 6-311++G(d,p) basis set (with polarization and diffuse functions included) [26, 27]. In previous studies, it has been shown that the B3LYP-D3BJ method reproduces experimental geometrical parameters well [28, 29]. The vibrational spectra were analyzed by the Potential Energy Distribution (PED) analysis [30] and FCART version 7.0 software [31]. The solvent effect in NMR and UV–Vis spectra was approximated by the Conductor-like Polarizable Continuum Model (CPCM) [32]. The Gauge Independent Atomic Orbital (GIAO) approach was used to calculate the 1H and 13C NMR chemical shifts of investigated compounds [33, 34]. The UV–Vis spectra were calculated with Time-Dependent Density Functional Theory (TD-DFT) in methanol. For the theoretical spectra, the pre-defined peak half-width at half-height in the GaussView Program was used.
2.8. Molecular docking simulation
Various studies indicate the importance of epidermal growth factor receptor (EGFR) inhibition as an effective method in the treatment of different types of cancer. Inhibition of EGFR, as a potential therapeutic target, limits the proliferation of cancer cells [35]. For this reason, the potential inhibitory effect of newly synthesized coumarin derivatives was investigated and the contribution of different positions of aromatic OH groups on inhibitory activity was discussed in detail.
Docking studies have been performed using the AutoDock 4.2 software package for predicting the protein–ligand interactions between the EGFR receptor and the newly synthesized compounds [36]. The structures of the investigated compounds were subjected to full geometry optimization using the program package Gaussian09 [26]. The geometries for all structures were optimized using quantum chemical calculations based on density functional theory B3LYP-D3BJ functional with a 6-311++G(d,p) basis set. The X-ray structure of the EGFR receptor cocrystallized with pyrollo derivative, at 1.9 Å resolution, was taken from RCSB Protein Data Bank in PDB format (PDB:3W2S) [37, 38]. The graphical user interface AutoDockTools (ADT) was used to generate the docking input files. Grid maps were computed using AutoGrid considered grid box of dimension 60 × 60 × 60 (grid size) in −x, −y, and −z directions. Grid spacing, with the point separated by 0.375 Å (approximately one-fourth of the length of a carbon–carbon covalent bond) was used for the calculation of the energetic map. The Lamarckian genetic algorithm was chosen for the search of the best conformers of investigated compounds in the receptor. The pose of investigated compounds with the lowest energy of binding was extracted and aligned with receptor structure for further analysis. The Discovery Studio 4.0 (BIOVIA Discovery Studio 2016) was used to visualize and analyze docking results after simulation [39].
3. Results and discussion
3.1. X-ray structure and optimized geometric configurations
The crystallographic structure of 3b with the adopted atom-numbering scheme is shown in Figure 1. Compound 3b crystallizes in the monoclinic crystal system and P21/c space group in which the asymmetric part of the unit cell contains one neutral molecule. Selected bond lengths, bond angles, and dihedral angles of 3b are listed in Tables S1, S2, and S3. Based on the values of dihedral angles (Table S3), it can be noticed that the 7-acetate part (∠C3’–O4–C7–C8 = 96.7 (5)°) and aniline derivative (∠C1’–N1–C1′′–C2′′ = 78.6 (4)°) give rise to the distortion from planarity. Moreover, the value of the angle between C5/C6/C7/C8/C9/C10 and C1′′/C2′′/C3′′/C4′′/C5′′/C6′′ weighted least-squares planes is 76.7 (4)°, which confirms the non-planar molecular structure of 3b.
The structure of 3b is additionally stabilized by the intramolecular hydrogen bond between N1 and O3 atoms (Figure 1) with the following parameters (Table 2): N1–H1 = 0.88(4), H1⋯ O3 = 1.81(4) Å, N1⋯ O3 = 2.550(4) Å, and ∠ N1–H1⋯ O3 = 141(4)°.
MERCURY [24] drawings of the molecular structure of (E)-3-(1-((3-hydroxyphenyl)amino) ethylidene)-2,4-dioxochroman-7-yl acetate (3b) with labeled non-H atoms (left) and a packing diagram (right). Displacement ellipsoids are shown at the 30% probability level, while the H atoms are drawn as spheres of arbitrary radii. Hydrogen bonds are shown as black dashed lines.
Selected hydrogen-bond parameters
| D–H⋯A | D–H (Å) | H⋯A (Å) | D⋯ A (Å) | D–H⋯A (°) |
|---|---|---|---|---|
| C2′′–H2′′⋯ O2i | 0.93 | 2.59 | 3.271 (5) | 130.5 |
| C6′′–H6′′⋯ O5ii | 0.93 | 2.64 | 3.300 (6) | 128.6 |
| N1–H1⋯ O3 | 0.88 (4) | 1.81 (4) | 2.550 (4) | 141 (4) |
| O6–H6⋯ O2i | 0.83 (4) | 1.97 (4) | 2.788 (4) | 166 (4) |
Molecular arrangement in the crystal structure of 3b (Figure 1) is governed by a network of O6–H6⋯ O2i (i: −x + 1, y + 1∕2, − z + 3∕2) hydrogen bonds (O6–H6 = 0.83(4) Å, H6⋯ O2 = 1.97(4) Å, O6⋯ O2 = 2.788(4) Å, ∠ O6–H6⋯ O6 = 166(4)°) in a head-to-tail manner, grouping molecules into chains parallel to the b crystallographic axis.
Symmetry code(s): (i) −x + 1, y + 1∕2, −z + 3∕2; (ii) −x + 1, −y, −z + 1.
The structures of obtained compounds were optimized based on the crystallographic structure of 3b (Figure 2). The crystallographic and theoretical bond lengths and angles, as well as other experimental and calculated values, were mutually correlated. The quality of correlations was measured using two statistical parameters, namely the correlation coefficient (R) and the average absolute error (AAE). The first parameter gives the correlation between experimental and theoretical values, while the second parameter presents the average value of the difference between these values. The high value of R and low value of AAE define a good description of the experimental system by calculated values. As observed in Tables S1–S3, correlation coefficients for 3b are higher than 0.97 for bond lengths, bond angles, and dihedral angles, while AAEs are 0.02 Å, 0.91°, and 3.13°, respectively. This result proved that the chosen level of theory described the experimental structure well. In the case when bond lengths and bond angles of 3a are compared to those of 3b, the AAEs are 0.03 Å and 0.26°, respectively, while the differences in structural parameters between 3c and 3b are even lower, namely 0.0008 Å and 0.18°, respectively. This is an expected result since the investigated molecules have a rigid structure, i.e., the rotatable part is the N–C bond, which also has a partial double character, which makes a rotation around it significantly more difficult. It should be noted that the difference in the position of the –OH group could also lead to different inter- and intramolecular interactions in solid state that alter the overall structure. Therefore, in the case of 3a and 3c, the lower values of statistical parameters do not necessarily mean the lower reliability of experimental or theoretical data.
Optimized geometries of investigated compounds at B3LYP-D3BJ/6-311++G (d, p) level of theory in the gas phase.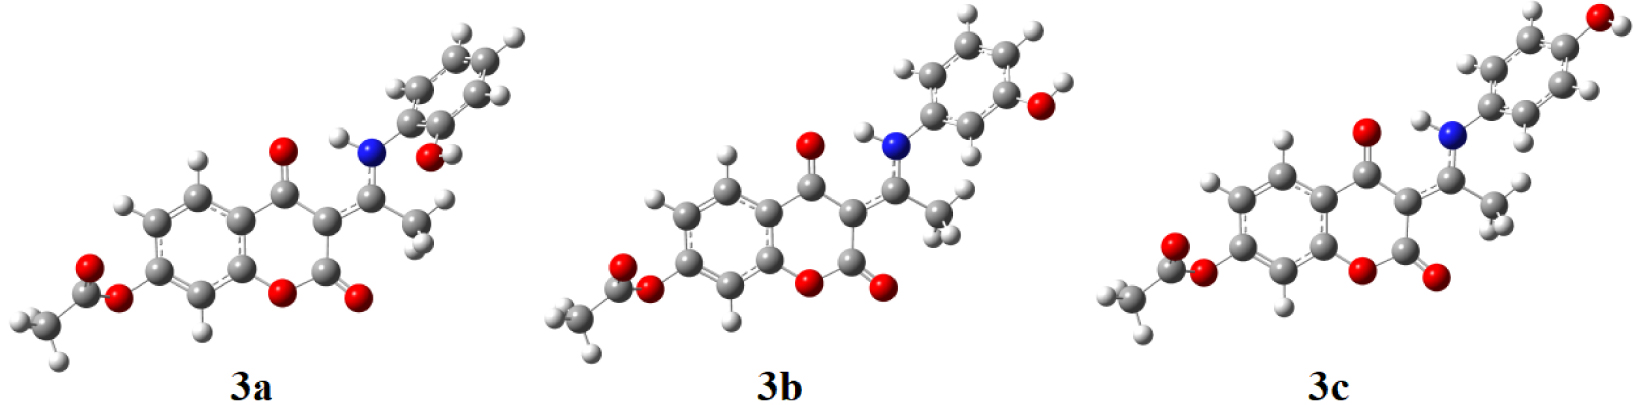
Two-dimensional (2D) fingerprint plots for the 3b structure, with a Hirshfeld surfaces mapped with dnorm view and relative contribution of the atom pairs to the Hirshfeld surface.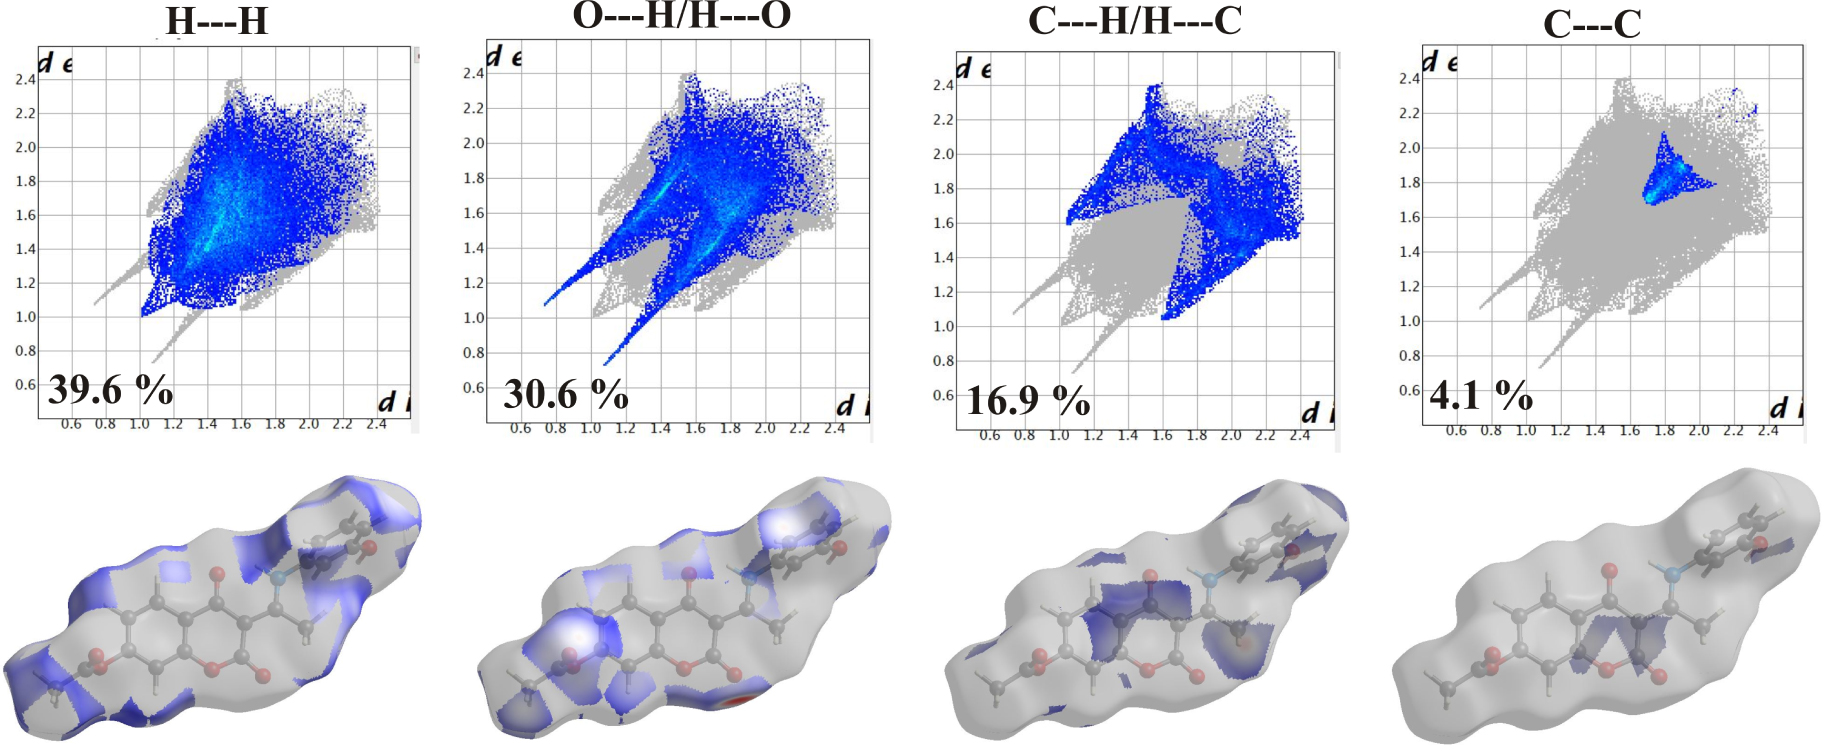
3.2. Hirshfeld surface analysis (HSA)
As previously explained, in this contribution the Hirshfeld Surface (HSA) was used for the quantification of the various contributions to the overall stability of crystal structure. The results are presented in the 2D-fingerprint plots (Figure 3) with the red–blue–white color scheme: red regions represent closer contacts and negative dnorm value (shorter than vdW separation); blue regions represent longer contacts and positive dnorm value (longer than vdW separation), and white regions represent the distance of contacts, which is exactly the vdW separation and with a dnorm value of zero (equal to vdW separation). The main contributions come from H⋯H, H⋯O, H⋯C, and C⋯C interactions. The main contribution of 39.6% comes from H⋯H contacts, which are shown as a sharp large spike in the 2D-fingerprint plots. The second most important interactions (30.6%) originates from H⋯O/H⋯O contacts due to the presence of several oxygen atoms in the structure. The steric repulsions are represented by the blue color spikes in Figure 3. C⋯H/H⋯C interactions contribute 16.9% and the peaks 2D-finger plots are slightly deviated due to the hyperconjugative interaction. The lowest contribution is observed for noncovalent C⋯C (4.1%) contacts, which can be attributed to π–π contacts.
3.3. NMR spectra
The 1H and 13C NMR spectra were recorded for investigated compounds in DMSO relative to TMS and the obtained values are given in Supplementary material as Tables S4 and S5. The structures of obtained compounds and TMS were optimized at the B3LYP-D3BJ/6-311++G(d,p) level of theory in DMSO. The theoretical values for chemical shifts, again relative to TMS, are given in Tables S4 and S5. Based on the value of the statistical parameters, AAE and R, it can be concluded that the optimized structures describe the experimental data well. High correlation coefficients, > 0.998 and > 0.993 were obtained for 1H and 13C NMR spectra, respectively.
In the synthesized compounds, three groups of protons can be distinguished. The first group includes hydrogen atoms attached to C4′ and C2′ methyl groups. Their positions are around 2.32 and 2.60 ppm in experimental spectra, and between 2.36 and 2.86 ppm in theoretical spectra. The difference in positions of these groups of hydrogen atoms lies in the proximity of the electronegative atoms of nitrogen and oxygen and partial delocalization over C2′. The theoretical values are higher because interactions with solvent molecules and hydrogen bonds are not taken into account and it is expected for these to further induce separation of charges in the proximity of electronegative atoms. The second group of hydrogen atoms consists of those in aromatic rings of coumarin core and benzene ring of a substituent in position C3. These atoms are positioned between 6.81 and 8.03 ppm in all three experimental spectra. The theoretical values are again overestimated for about 0.3 ppm. This result is a consequence of the rigidity of these parts of molecules as well as low reactivity toward solvent and other solute molecules. It was observed in previous studies that the position C5–H has the highest value of the chemical shift among hydrogen atoms attached to aromatic rings and this is common for all of the coumarin derivatives [28]. The third group of hydrogen atoms represented by protons of the –OH groups in the experimental spectra occur as singlets at about 10 ppm, while in the theoretical spectra they are not observed due to exchange with solvent molecules, and therefore, no theoretical values for chemical shifts are given.
On the other side, the chemical shifts of carbon atoms can be divided into two groups. The first one includes carbon atoms of methyl groups in positions 2′ and 4′ with chemical shifts of around 20 and 21 ppm in the experimental spectrum and 17 and 16 ppm in the theoretical spectrum. The reason for such low values of chemical shifts lies in the fact that they are not sp2 hybridized and are not bound to electronegative atoms. The second group includes carbon atoms of coumarin core and benzene ring. The values of chemical shifts for a second group of carbon atoms cover a wide range between 96 and 179 ppm in the experimental spectrum and almost the same range in theoretical. The differences in calculated and experimental values are very low again due to the rigidity of molecules and the absence of electronegative atoms in a structure that could form hydrogen bonds with neighboring molecules. Carbon atoms close to oxygen atoms in positions O1, O2, O3, and O4 have higher values of chemical shifts higher than 161 ppm, due to the negative inductive effect of oxygen atoms. Due to the extended delocalization between coumarin core and aromatic ring and the presence of nitrogen atom, the values of chemical shifts for C1′ are much higher than expected (168 ppm in the experimental spectrum and 178 ppm in the theoretical spectrum). The main difference in the 13C NMR spectra of obtained compounds is in the position of the carbon atoms to which the hydroxyl groups are attached. As seen in Table S5, the value of chemical sifts significantly increases when an oxygen atom is present. For example, the chemical shift of C2′′ is 150 ppm when oxygen atom is directly attached while in other cases it is below 126 ppm. The same applies to positions C3′′ and C4′′ (Table S4).
3.4. IR spectra
The vibrational spectra were recorded for the solid substances in KBr in the region between 4000 and 400 cm−1. The theoretical spectra were predicted for the separate molecules in vacuum at the B3LYP-D3BJ/6-311++G(d,p) level of theory. The experimental and unscaled/scaled predicted wavenumbers are given in Tables S6–S8 along with the assignations and PED percentages of various vibrational modes. The spectra are given in Figure 4. Due to the structural similarity of the synthesized molecules, significant differences in positions are not expected, except for those modes influenced by the position of the –OH group on an aromatic ring. The discussion of vibrational spectra will mainly include a general description of spectra with special emphasis on these differences. Three distinct regions can be observed in the experimental spectra.
Experimental IR spectra in the solid state (black lines) compared with the corresponding predicted spectra in the gas phase of 3a (top), 3b (middle), and 3c (below) at B3LYP-D3BJ/6-311++G(d,p) level of theory.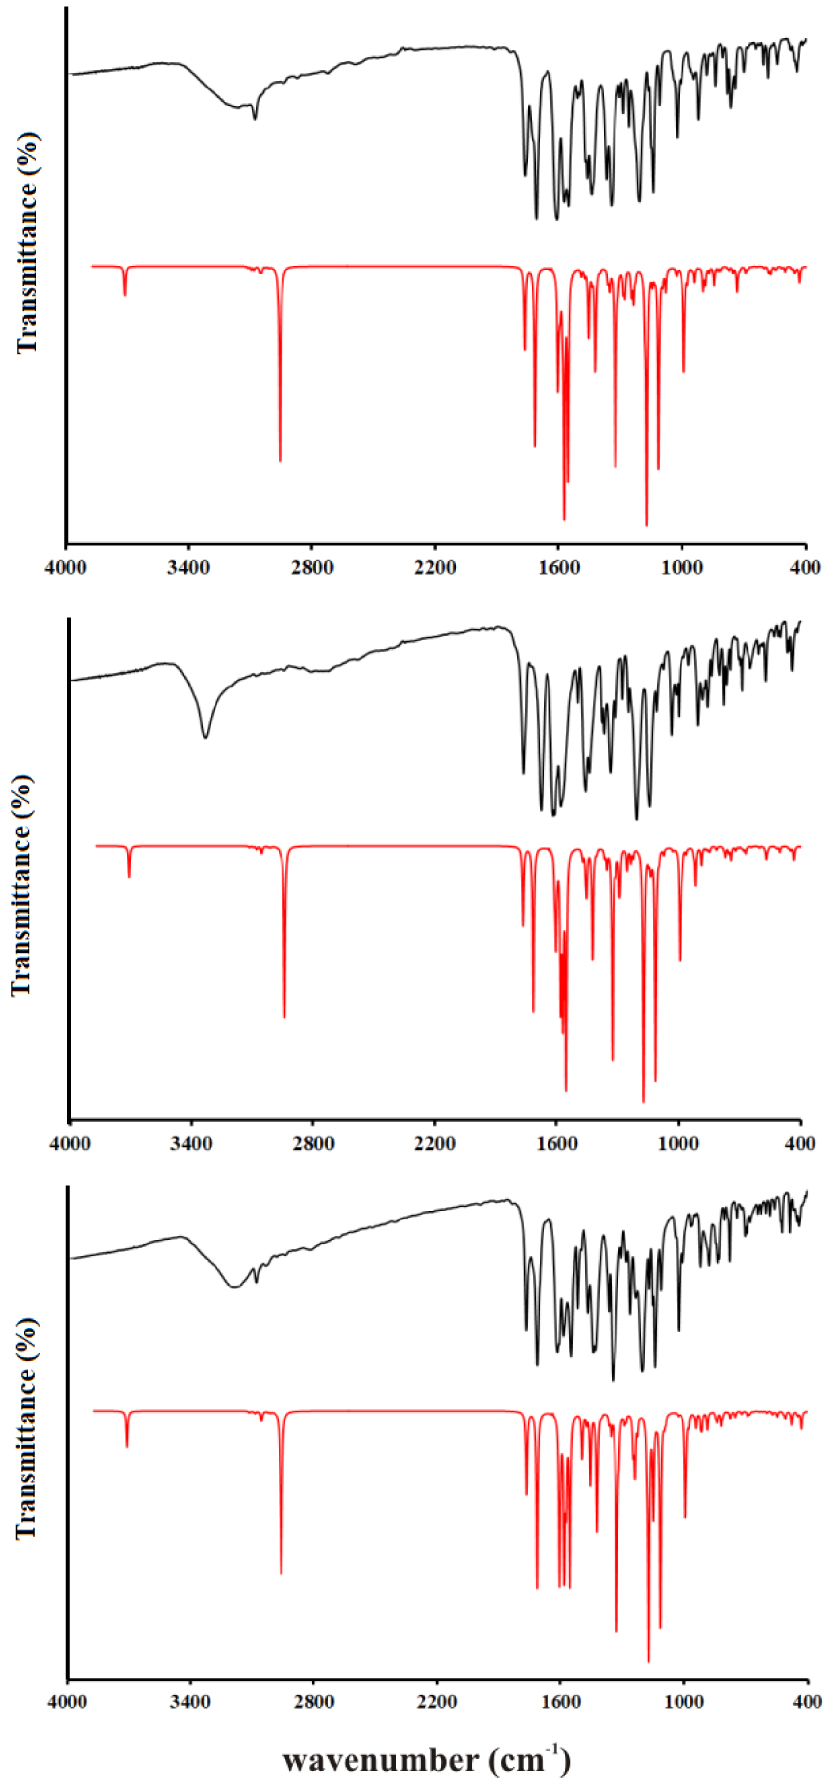
The first region covers the range between 4000 and 2800 cm−1 and includes vibrations assigned to the single stretching mode. In the experimental spectrum, three wide peaks can be observed for all three molecules. These include the superposition of O–H and C–H stretching modes, especially for 3a and 3c. When the −OH group in the ortho or para position on the benzene ring are the lower values for wavenumbers for the O–H stretching vibrations, 3220 and 3212 cm−1 are observed. These lower values of the wavenumbers are a consequence of the delocalization of the negative charge on the oxygen atom and around the aromatic ring. A much higher wavenumber was obtained for 3b 3342 cm−1, which is a consequence of the weaker delocalization of the negative charge of the oxygen atom through the aromatic ring. In the theoretical spectrum, these vibrations are positioned around 3520 cm−1 (scaled) with a 100% contribution from O–H vibration. This discrepancy is expected because the structures were optimized in a vacuum and intermolecular interactions are not included. In crystal structures, two molecules are connected through a hydrogen bond between the –OH group and the oxygen atom of the coumarin core, as shown in Figure 1. The other vibrations contributing to the wide peak are C–H stretching vibrations of the aromatic ring and coumarin core. The highest values of wavenumbers are calculated for the C–H stretching vibrations of aromatic rings (above 3000 cm−1), as expected. Methyl group vibrations of acetate group in all three molecules are positioned between 2954 and 2935 cm−1 due to the proximity of electronegative oxygen atoms, while lower values are obtained for methyl group of the aliphatic part (2897 and 2845 cm−1). The N–H stretching vibrations are located at 3084 (3a), 2838 (3b), and 2850 (3c) cm−1, while calculated values are 2865 (3a), 2836 (3b), and 2853 (3c) cm−1. These wavenumbers are much lower than expected because of the formation of the quasi-six-membered ring and strong hydrogen bond which weakens the N–H bond. This was also observed for similar compounds [10, 26]. The area between 2800 and 1800 cm−1 is empty of peaks.
In the second region, between 1800 and 1000 cm−1, there is a vast number of peaks attributed to the mixture of stretching and bending modes. Although very similar in positions, the peak intensities are those that differentiate spectra of various derivatives. This region starts with two intense peaks that are attributed to the C=O stretching vibrations. The carbonyl group that is part of the quasi-six-membered ring is vibrating at a lower frequency due to the elongation of the bond. The wavenumbers for C=O in the experimental spectrum are similar for all three molecules, around 1767 cm−1 and 1700 cm−1. The difference in scaled values of two C=O stretching vibrations in the theoretical spectrum is almost identical among three derivatives, around 50 cm−1. The theoretical values are lower again since in crystalline structure these groups are included in the hydrogen-bond formation with the neighboring molecules. The other prominent bands include C–C stretching vibrations, around 1620 cm−1 in experimental, and 1570 cm−1 in the theoretical spectrum. Very intense peaks in doublets around 1200 and 1100 cm−1 are attributed to the C–O stretching vibrations. These are positioned at 1211 and 1110 cm−1 (3a), 1207 and 1045 cm−1 (3b), and 1205 and 1027 cm−1 (3c). The peak at higher values belongs to C2–O2 stretching vibration, which is a consequence of the presence of the lactone group, while the second one is attributed to C4–O3 vibration. Another important detail that should be pointed out is that the C4–O3 bond is protected by the formation of a six-membered ring structure with N–H, which is followed by the formation of a hydrogen bond. In the theoretical spectrum of 3c, the values are lower for 36 cm−1 for the first peak and 6 cm−1 for the second. As can be seen, the hydrogen bond in the subunit is formed between the –OH group in ortho position and C2–O2 which changes the energy of the bond. The bond C4–O3 is much more protected by the formation of a ring structure with N–H. Several bending modes additionally contribute to the peaks in this area. Some of them in the spectrum of 3a are C–C–H (1464, 1211, and 1110 cm−1), C–C–O (1442 cm−1), and H–C–H (1346 cm−1). Also, the torsion vibrations, for example, H–C–C–O (1026 cm−1), are present in this part of the spectrum. The positions of these vibrations in the spectrum of 3b and 3c differ for several cm−1. The predicted values are within 20 cm−1 of experimental ones which can be justified by the low reactivity of the present groups and the inexistence of intermolecular interactions with the surrounding molecules.
The third region covers the values below 1000 cm−1 and it is characterized by the medium to low-intensity peaks assigned to the bending and torsion vibrations, or their combination with stretching vibrations. In the spectrum of 3a, the most intense peaks are positioned at 999 (𝛿(C–C–H), 𝜈(C–C), and 𝜈(C–O)), 904 (𝜏(H–C–C–H), 𝜏( C–C–C–H)), 569 (𝜏(O–C–O–C), 𝜏(H–C–C–O)), and 445 cm−1 (𝛿(C–C–O), 𝜈(C–C), and 𝛿(C–O–C)). Similar vibration modes can be assigned to 3b and 3c. In the theoretical spectrum, the number of calculated wavenumbers is much higher, and it should be kept in mind that PED analysis cannot cover all of the contributions due to the mixture of modes.
The correlation coefficients for all three spectra are given in Tables S6–S8. As can be seen, the optimized structures describe the experimental wavenumbers well for all three derivatives. The values of R are 0.991 (3a), 0.998 (3b), and 0.996 (3c). This is an additional proof, besides the analysis of NMR spectra, that the optimized structures represent the investigated molecules well and that they can be used for further theoretical analysis.
3.5. UV–Vis spectra
The UV–vis spectra of obtained compounds were recorded in the region between 200 and 450 nm, while the electronic transitions were predicted for the structures optimized in the water at the B3LYP-D3BJ/6-311++G(d,p) level of theory. The experimental and theoretical spectra and the main contributions are given in Figures 5, S1, and Table S9.
Experimental (black) and theoretical (red, structures optimized at B3LYP-D3BJ/6-311++G(d,p) level of theory) UV–Vis spectrums of 3a (top), 3b (middle), 3c (below).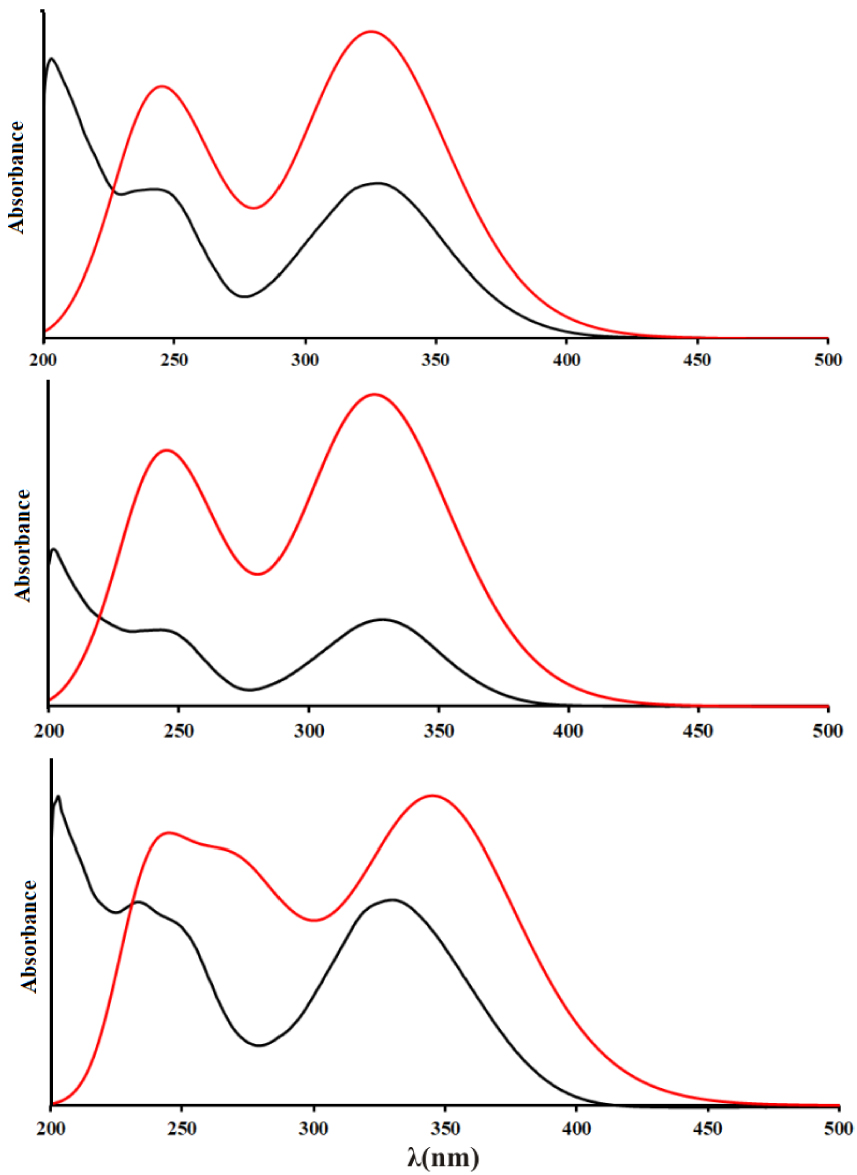
IC50 values (μM) of the investigated substance.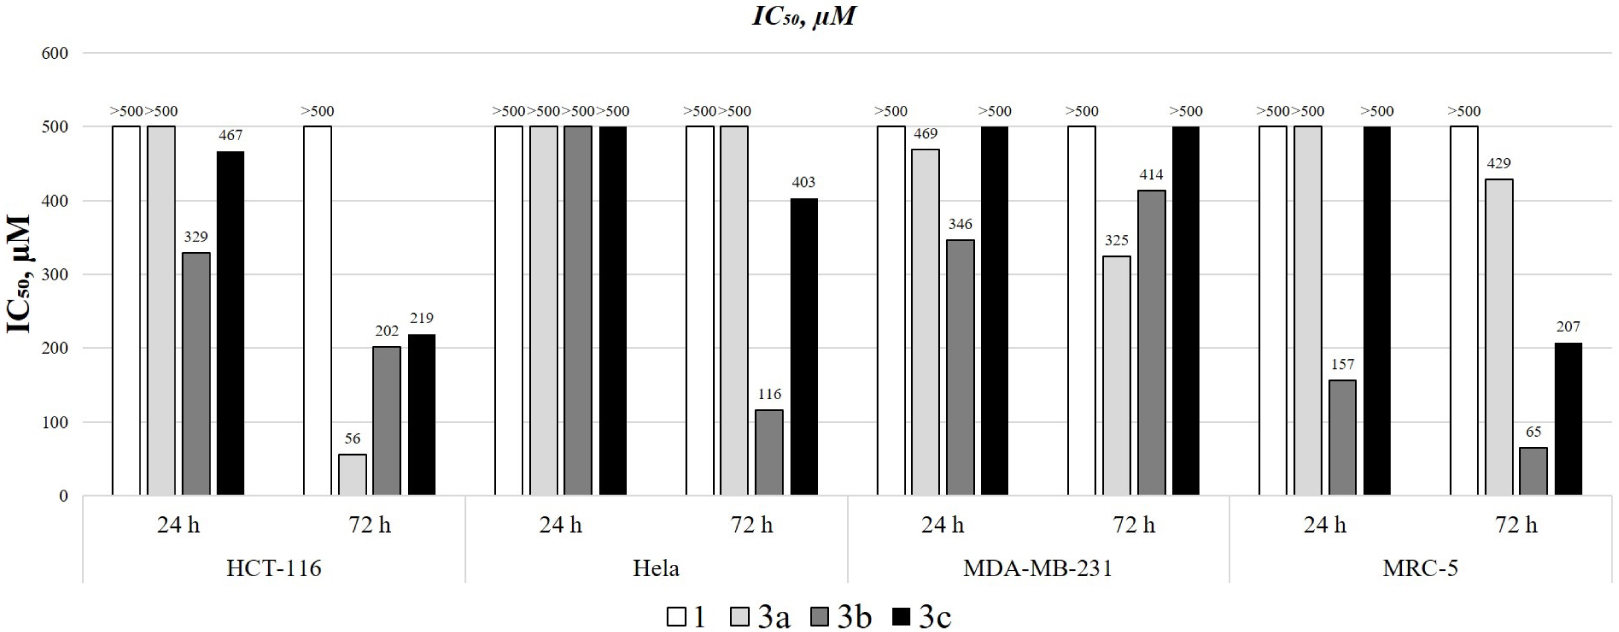
The theoretical spectra were calculated for the range between 220 and 450 nm. In the experimental spectrum of 3a, there are three wide peaks at 205, 249, and 332 nm, while in the theoretical spectrum the calculated electronic transitions are positioned at 239 and 337 nm. These values are well-reproduced bearing in mind that the electronic transitions were calculated for the molecules in polarizable continuum with a dielectric constant of water; therefore, the specific interactions with solvent molecule were not modeled. These transitions were assigned to HOMO-2→LUMO+1 and HOMO→LUMO, respectively. The relative intensities also follow the experimental results. The experimental/theoretical values in the spectrum of 3b also differ between 7 and 4 nm, which is acceptable taking into account all of the drawbacks of the applied solvent model. The same transitions are responsible for the peaks in the spectrum. Molecule 3c has a spectrum that is somehow different from the previous two because there is a shoulder present on the first peak which signifies the existence of additional transition. The experimental values for the peak maxima are 232, 249, and 332 nm, while in the predicted spectrum the maxima are positioned at 236, 269, and 349 nm. The middle value is assigned to the HOMO→LUMO+1 transition. In both spectra, the most intense transition is that at 349 nm, while the lowest intensity is for the middle peak. Again, these differences are negligible proving that the applied solvent model and level of theory for optimization reproduce the experimental results well.
The orbitals included in the transitions are depicted in Figure S1. As can be seen, all of the orbitals are delocalized over the whole structure, except for the HOMO orbital which is localized only over the substituent aromatic ring and pyrone moiety. These orbitals allow justification of the previously discussed reproduction of experimental results for electronic transitions. The obtained molecules do not possess a significant number of reactive positions that could form strong intermolecular interactions with solvent molecules which would alter the positions of electronic levels. One of the carbonyl groups of the coumarin core is already in a quasi-six-membered ring, while the other is contributing to all of the orbitals; therefore, the formation of hydrogen bonds would influence all of them. Also, the position of –OH groups does not influence the delocalization of orbitals; therefore, the spectra of obtained coumarin derivatives are very similar.
3.6. Cytotoxic activity
The cytotoxic activities of 4,7-dihydroxycoumarin derivatives and compound 1 were investigated toward HCT-116, MRC-5, HeLa, and MDA-MB-231 cell lines. The IC50 values and cell viability vs. concentration graphs are presented in Figures 6 and S2–S5. The results show that the viability of the cell was reduced in a dose- and time-dependent manner, expressing a stronger effect after 72 hours. Compound 1 didn’t show any activity toward investigated cell lines in the time interval of 24 and 72 hours. The highest resistance toward 4,7-dihydroxycoumarin derivatives was observed for the MDA-MB-231 cell line, as given in IC50 values that were higher than for the other cell lines. Compound 1 and 3c had IC50 values higher than 500 μM both after 24 and 72 hours. The IC50 values for 3a and 3b toward MDA-MB-231 were 469 and 346 (after 24 hours), and 325 and 414 μM (after 72 hours). For HeLa cells, none of the investigated derivatives showed any effect after 24 hours, but after 72 hours compounds 3b and 3c had IC50 values of 116 and 403 μM. The resistance of MDA-MB-231 cells is not surprising because of its metastatic origin. The most sensitive cell lines were HCT-116 and MRC-5. The viability of HCT-116 cells, derived from the primary tumor, was significantly reduced after 72 hours by 3a (IC50 = 56 μM), 3b (IC50 = 202 μM), and 3c (IC50 = 219 μM). On the other hand, MRC-5 cells are epithelial cells and thus very sensitive to the investigated derivatives. The reduction of their viability was not efficient after 24 hours, except for 3b (IC50 = 157 μM). After 72 hours, the IC50 values for 3a, 3b, and 3c were 429, 65, and 207 μM, respectively. In general, the obtained derivatives show only moderate activity that also depends on the position of the –OH group. The meta-derivative in this study proved to be the most active one probably because there are no intramolecular hydrogen bonds and steric hindrance that could prevent the formation of specific interactions with important proteins. The most selective derivative was 3a, as proven by high reduction of HCT-116 viability after 72 hours and low impact on MRC-5.
3.7. Antimicrobial activity
The results of in vitro antimicrobial activity of tested and control compounds against 13 strains of microorganisms, determined by the microdilution method, are presented in Table 3. MICs and MMCs values were in the range from 15.63 μg∕mL to >1000 μg∕mL with significant differences between species of microorganisms. The antibacterial activity of derivatives was moderate and partially selective, except in a few cases that are explained in the following paragraph.
The difference in sensitivity of G− and G+ bacteria toward tested substances was observed. The most sensitive microorganism was Bacillus subtilis ATCC 6633 (MIC 15.63 μg∕mL for 3b). The MIC value of 3b was lower than that for doxycycline. The highest resistances were demonstrated by Escherichia coli standard and clinical strain, and Staphylococcus aureus ATCC 25923 (MICs and MMCs were >1000 μg∕mL). Among all derivatives, compound 1 showed slightly higher activity especially toward Bacillus altitudinis, Bacillus pumilus, Bacillus cereus, and Pantoea agglomerans. In the previous studies performed on 4-hydroxycoumarin derivatives with chloroaniline and other molecules and their corresponding Pd(II)-complexes, the intensity of the antimicrobial action varied depending on the species of microorganism and the tested compound. The tested substances showed selective, moderate, or low antimicrobial activity [28, 40]. Some of the ligands showed better antibacterial activity than the corresponding complexes, against bacteria from the genus Bacillus [40]. In the study by Chin and coworkers, twenty 5,7-dihydroxycoumarin derivatives were tested for antibacterial activities [41]. These compounds showed a broad range of antimicrobial activity. Some coumarins showed mild (MIC 320– >640 μg∕mL), some moderate (MIC 160–639 μg∕mL), and some strong antibacterial activity (MIC 10–160 μg∕mL). Two compounds exhibited potent activity against Staphylococcus aureus with a MIC value of 2.5 μg∕mL. Therefore, the results from this study are in line with literature data, and further experiments are needed to verify the activity and reaction mechanism of 3b toward Bacillus subtilis.
Antimicrobial activity of tested compounds and positive controls
| Species | 1 | 3a | 3b | 3c | Doxycycline/ Fluconazole | |||||
|---|---|---|---|---|---|---|---|---|---|---|
| MIC1 | MMC2 | MIC | MMC | MIC | MMC | MIC | MMC | MIC | MMC | |
| Bacillus subtilis ATCC 6633 | 250 | 500 | 500 | 1000 | 15.63 | 500 | 500 | 1000 | 31.25 | 62.5 |
| Bacillus altitudinis | 125 | 500 | >1000 | >1000 | 500 | 1000 | >1000 | >1000 | <0.5 | <0.5 |
| Bacillus pumilus | 500 | 1000 | >1000 | >1000 | 500 | >1000 | >1000 | >1000 | <0.5 | <0.5 |
| Bacillus cereus | 500 | >1000 | 1000 | 1000 | >1000 | >1000 | >1000 | >1000 | <0.5 | 3.91 |
| Sarcina lutea | nt | nt | >1000 | >1000 | >1000 | >1000 | 500 | 500 | <0.5 | 7.81 |
| Staphylococcus aureus ATCC 25923 | >1000 | >1000 | >1000 | >1000 | >1000 | >1000 | >1000 | >1000 | 1.95 | 15.63 |
| Pseudomonas aeruginosa ATCC 27853 | 1000 | >1000 | 1000 | >1000 | 1000 | >1000 | 1000 | >1000 | 7.812 | 62.5 |
| Pseudomonas veronii | >1000 | >1000 | >1000 | >1000 | 500 | 1000 | 500 | 1000 | 0.5 | 7.81 |
| Proteus mirabilis ATCC 12453 | 1000 | >1000 | >1000 | >1000 | 1000 | >1000 | >1000 | >1000 | 125 | 125 |
| Escherichia coli ATCC 25922 | >1000 | >1000 | >1000 | >1000 | >1000 | >1000 | >1000 | >1000 | 0.976 | 3.906 |
| Escherichia coli | >1000 | >1000 | >1000 | >1000 | >1000 | >1000 | >1000 | >1000 | 1.953 | 3.906 |
| Pantoea agglomerans | 250 | 500 | >1000 | >1000 | >1000 | >1000 | 500 | 1000 | 0.5 | 7.81 |
| Candida albicans ATCC 10231 | >1000 | >1000 | 1000 | 1000 | >1000 | >1000 | >1000 | >1000 | 0.5 | 1.95 |
MIC values (μg∕mL)—mean inhibitory activity.
MMC values (μg∕mL)—mean microbicidal activity.
nt—not tested.
Predict an important thermodynamic parameter for most stable docking conformations
| Conf. | 𝛥Gbind | Ki (μM) | 𝛥Ginter | 𝛥Gvdw+hbond+desolv | 𝛥Gelec | 𝛥Gtotal | 𝛥Gtor | 𝛥Gunb |
|---|---|---|---|---|---|---|---|---|
| EGFR-3a | −8.4 | 0.7 | −10.2 | −10.1 | −0.1 | −1.6 | 1.8 | −1.6 |
| EGFR-3b | −8.6 | 0.6 | −10.4 | −10.1 | −0.3 | −1.2 | 1.8 | −1.2 |
| EGFR-3c | −8.3 | 0.8 | −10.1 | −10.0 | −0.1 | −1.2 | 1.8 | −1.2 |
3.8. Molecular docking
The results of thermodynamic parameters for the performed molecular docking study are given in Table 4. The values in Table 4 represent: the free energy of binding (𝛥Gbind), constant of inhibition (Ki), total internal energy (𝛥Gtotal), torsional free energy (𝛥Gtor), unbound system’s energy (𝛥Gunb), electrostatic energy (𝛥Gelec) energy of dispersion and repulsion (𝛥Gvdw), hydrogen-bond energy (𝛥Ghbond), and desolvation (𝛥Gdesolv) energy. By observing the obtained thermodynamic values, it is clear that the EGFR-3b (−8.6 kJ⋅mol−1, 0.6 μM) complex had the lowest predicted binding free energy (𝛥Gbind) and the lowest values of constant of inhibition (Ki) among three 4,7-dihydroxycoumarin derivatives, while the values for EGFR-3a and EGFR-3c complexes were −8.4 kJ⋅mol−1/0.7 μM and −8.3 kJ⋅mol−1/0.8 μM, respectively. Based on the obtained results, it can be concluded that the 3b compound showed the highest inhibitory activity toward the EGFR receptor, which explains the results of biological activity. All of the compounds have almost equal values for the sum of energy of dispersion and repulsion, hydrogen-bond energy, and desolvation energy, which is expected due to the similarity in structure. The torsional free energies are also equal. The most prominent differences are observed for the electrostatic energy probably because the –OH group and the rest of the 3b molecule do not form any kind of intramolecular bonds, which allows stronger interactions with neighboring amino acids.
According to the results of molecular docking simulation, newly synthesized compounds achieve strong EGFR inhibitory activity mainly through the conventional hydrogen bonds with the active site pocket of the receptor. The binding site and docking pose of the investigation compounds as well as the most significant interactions with amino acid residues are shown in Figure 7 and Table S10.
3D representation of the best docking positions of 3a, 3b, 3c into the EGFR binding pocket.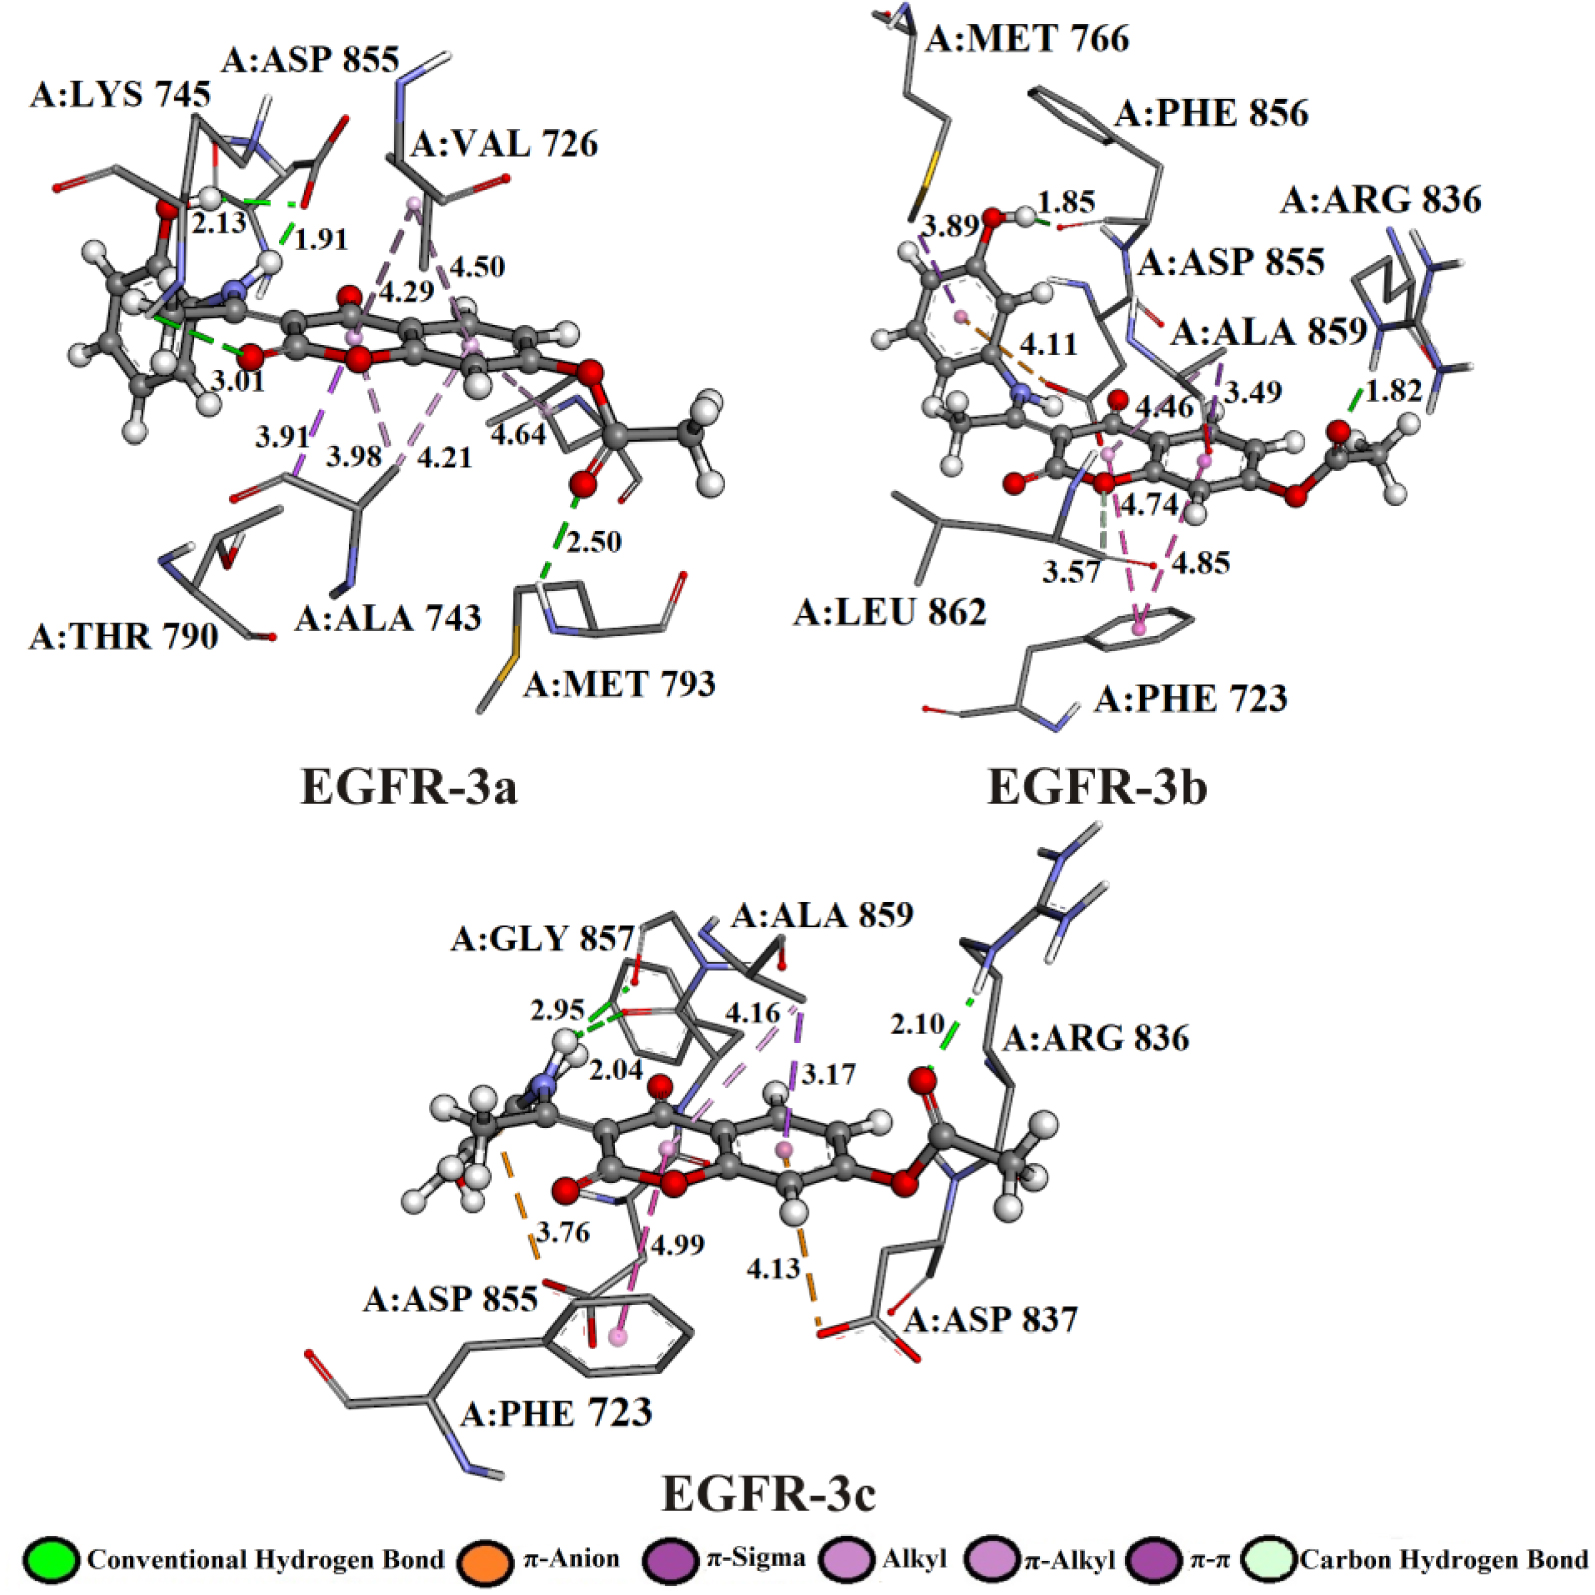
The hydrogen atom of the amino group (–NH2) of amino acids A:MET 793 and A:ARG 836 establishes hydrogen bonded with the oxygen of the carbonyl group of the investigated compounds: 3a (2.50 Å), 3b (1.82 Å), and 3c (2.10 Å). Amino acid A:ASP 855 established bifurcated geometry across oxygen atom with hydrogen atoms of –NH– (1.91 Å) and –OH (2.13 Å) groups of 3a. On the other hand, the hydrogen atom of –NH2 group of 3c formed bifurcated hydrogen bonding geometry with the oxygen atom of carbonyl groups of dipeptide A:PHE 856–A:GLY 857 (2.04 and 2.95 Å).
The affinity of investigated compounds to the EGFR receptor might also be accounted for some electrostatic contacts, such as π-cation interactions. The binding modes of 3b, 3c compounds were enhanced by electrostatic interaction formed between the partially negative oxygen atom of A:ASP 855 and the aromatic rings of 3b (4.11 Å) and 3c (3.76 Å) compounds. Residues in a hydrophobic pocket, A:PHE 723, A:VAL 726, A:ALA 743, A:THR 790, and A:ALA 859 were observed to provide stability support by forming π–π, π–sigma, and π–alkyl interactions due to the presence of aromatic rings. The complexes EGFR-3b and EGFR-3b show π–π interactions formed between the phenyl rings of 3b (3.57 and 4.85 Å), 3c (4.99 Å), and A:PHE 723. The 𝜎 electron cloud of residues A:THR 790 and A:ALA 859 formed π–𝜎 interactions with the aromatic rings of 3a (3.91 Å), 3b (3.49 Å), and 3c (3.17 Å), respectively.
4. Conclusion
The novel derivatives formed between 4,7-dihydroxycoumarin and aminophenols were synthesized and characterized by FT-IR, NMR, and UV–Vis spectroscopy. The crystallographic structure of (E)-3-(1-((3-hydroxyphenyl)amino)ethylidene)-2,4-dioxochroman-7-yl acetate (3a) was solved and used to verify the applicability of the used theoretical model for the optimization of structures. The obtained geometric parameters as well as experimental and theoretical FT-IR, NMR, UV–Vis spectra are in good mutual accordance with a large correlation coefficient (R) and low mean absolute error (MAE) values. In vitro, antimicrobial, and anticancer studies were performed on the investigated compounds. The highest activity was observed for (E)-3-(1-((3-hydroxyphenyl)amino)ethylidene)-2,4-dioxochroman-7-yl acetate (3b), especially toward HCT-116 (), HeLa (), and MRC-5 (). Good selectivity was determined for 3a toward HCT-116 (). Compound 3b also showed significant activity against Bacillus subtilis ATCC 6633 (MIC = 15.63 μg∕mL). From a biological point of view, these derivatives deserve attention for further deeper biological investigation. Due to the pronounced biological activity, a molecular docking study was conducted. The results of the molecular docking study indicated that compound 3b also had the highest inhibitory effect against the EGFR receptor. The essence of these studies is in the preliminary screening, which simply selects possible candidates for potential drugs.