


 CC-BY 4.0
1. Introduction
Globally, energy demand has been steadily increasing since 1970 due to the rapid growth of population and industrial and technological development, leading to increased use of fossil fuels, the environmental impact of which is now perceptible [1]. In recent years, interest in renewable energies has increased due to environmental concerns about global warming and air pollution and the increasing demands for energy worldwide. Among renewable energies, biomass is one of the most plentiful and well utilized source in the world. Biomass or bioenergy can be used to replace fossil fuels/chemicals, with the added bonus that crops, plants or trees can absorb CO2 from the atmosphere, reducing the greenhouse effect [2, 3]. One of the major concerns with regard to the development of sustainable land-based biomass energy production systems relate to a possible change in the arable land use. From this viewpoint, aquatic biomass offers the advantage over its terrestrial counterpart in that it does not compete with food crops for land usage [4].
This biomass focuses on the algal biomass, sometimes called thrid generation biomass. In this context, algae have particularly interesting potential. Like other biomasses, algae have a biochemical composition allowing applications in the food industry, the production of fuels (so-called third generation fuel), biochar, activated carbons, or molecules of interest for chemistry, pharmaceuticals, or pharmaceutical cosmetics [5, 6, 7]. Biochemical and thermochemical processes are used for converting red algae to biofuel and/or other products. Among these technologies, pyrolysis is a promising technology, as it is more favorable and economical for converting algal biomass into energy fuels [5, 8, 9].
The thermal decomposition in the absence of oxygen and at high temperatures (400–600 °C) results in liquid products (bio-oil or pyrolytic oil); carbon-rich solid residues (biochar); and gaseous products [5, 10, 11]. Bio-oil is a very promising biofuel and can be used as fuel for heating, power generation or combined heat and power generation, or as an intermediate feedstock to produce various chemicals and fuels. Biochar is also a useful product that can be used to amend the soil and to sequester soil carbon, bioenergy (high heating value), or the removal of contaminants from the environment [12, 13]. It can also be used as a precursor to produce activated carbon which is used in different domains. Here, the characteristics of the pyrolysis products depend on the experimental parameters: final temperature, the heating rate, residence time, type of pyrolysis reactor, and type of biomass used, etc. The effects of each factor are closely interconnected, which requires more knowledge of the operating conditions of the pyrolysis process to produce bio-oil and biochar with excellent fuel properties. Bae et al. [14] found that the pyrolysis of algae produced less bio-oil, with a maximum yield obtained at a lower temperature (500 °C) than that of the pyrolysis of lignocellulosic biomass. Their study on the pyrolysis of two brown algae (Undari pinnatifid and Laminaria japonica) gave yields of 39.5% by weight and 37.5% by weight of bio-oil, but with high water content (39% by weight and 43.6% by weight, respectively). The heating value of the bio-oils was relatively high after the separation of the aqueous phase (23.33 MJ/kg and 33.57 MJ/kg respectively). Similar results were obtained by Choi et al. [15] during the pyrolysis of Laminaria japonica in a fluidized bed reactor. A maximum bio-oil yield of 35.4% was obtained at a pyrolysis temperature of 425 °C with a water content of 70.7%.
Ly et al. [16] studied the rapid pyrolysis of S. japonica macroalgae in a fixed-bed reactor. The maximum yield of bio-oil obtained is 40.91% at a pyrolysis temperature of 350 °C and at a scanning speed of the carrier gas of 300 ml/min. Bio-oils obtained from pyrolysis of S. japonica had higher heating value values between 32.97 and 33.17 MJ/kg and higher pH values (5.48–6.16) than those of bio-oil derived from lignocellulosic biomass. The authors also found, based on the 13C NMR data, that the bio-oil produced at higher flush gas flow rates contained more aliphatic carbons and higher molecular weight aromatic compounds. The biochar from the pyrolysis of S. japonica had a high heating value and contained a high carbon content. The pyrolysis bio-oil contains a high nitrogen content and a high oxygen content, which decreases its stability. Therefore, the recovery process has been recommended for these bio-oils so that they can be widely used as a fuel source.
The composition of algae (proteins, lipids, and carbohydrates) is very different from that corresponding to lignocellulosic biomass (cellulose, hemicellulose, and lignin). Therefore, the composition of the liquids from the pyrolysis of the algae must be different from the composition corresponding to the lignocellulosic material. The absence of lignin would lead to liquids devoid of phenolic compounds, which are responsible for the polymerization reactions leading to the formation of undesirable compounds in bio-oils. Thus, algal bio-oils are more stable than oils obtained from terrestrial biomasses [17]. Also, the relatively high concentration of proteins and lipids in the algae would lead to a liquid that could be considered a source of valuable compounds. It is important to note that lipids are obtained from algae using traditional solvent extraction, which is time-consuming and risky [18]. In Argentina, algae are abundant in lagoons, lakes, and coastal areas [19]. Besides, algae are grown for the production of biodiesel [20].
The intermediate pyrolysis of aquatic biomass for the production of chemical feedstock and fuel has not been reported in the literature. In this study, red algal biomass is used for the production and characterization of bio-oil and biocoal from intermediate pyrolysis. The major challenge in the energy field is the search for a process for converting red algae into biofuel with excellent fuel properties. In addition, this study explores the product profiles in order to understand the products. The objective of this study was (i) to study the influence of experimental parameters on the pyrolysis of algal waste; (ii) determine the appropriate experimental parameters to achieve maximum organic oil yield; and (iii) characterize the bio-oil produced under appropriate pyrolysis conditions using elemental analysis, thermogravimetric analysis (TGA), FTIR, 1H-NMR, GC–MS. The use of chemical and physical characteristics has also been performed to study the properties of the biochar produced.
2. Materials and methods
2.1. Materials and samples preparation
The gelidium sesquipedale were collected in August of 2008 from Sidi Bouzid in El jadida, Morocco. Fresh samples were washed by distilled water and sun-dried for 7 days. The dried material was ground and sieved to obtain fragments of 500 μm in length. The characterizations of gelidium sesquipedale are given in Table 1 [21].
Fixed-bed pyrolysis system.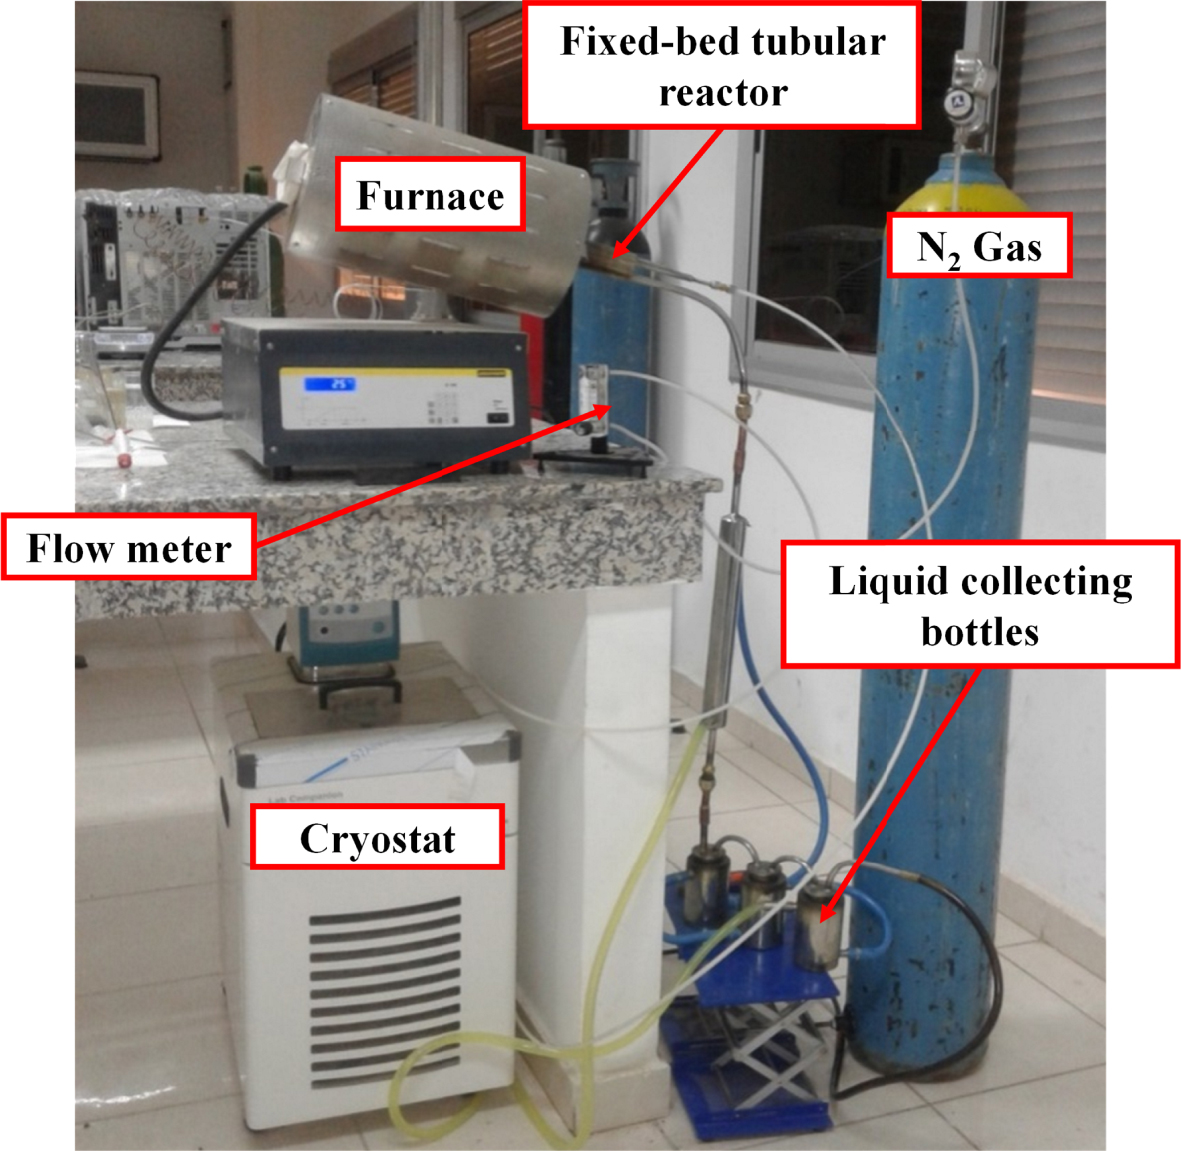
Proximate and ultimate analysis of red algae, bio-oil, and biochar
| Immediate analysis (wt%) | Red algae | Bio-oil | Biochar | |
| Moisture | 8.45 | 15.63 | 5.46 | |
| Volatile material | 70.60 | 86.44 | 26.39 | |
| Ash | 10.85 | 3.45 | 30.28 | |
| Fixed carbon | 18.55 | 10.11 | 43.33 | |
| Elementary analysis (wt%) | C | 26.67 | 44.52 | 46.35 |
| H | 3.84 | 5.09 | 2.76 | |
| N | 2.90 | 3.14 | 4.13 | |
| S | 0.89 | 1.25 | — | |
| O | 65.70 | 46.00 | 46.76 | |
| HHV (MJ/kg) | 15.18 | 20.11 | 22.89 | |
| % Atomic | H/C | 1.73 | 1.37 | 0.71 |
| O/C | 1.85 | 0.78 | 0.76 | |
| Empirical formula | CH1.73O1.85N0.093 | CH1.37O0.78N0.060 | CH0.71O0.76N0.076 | |
2.2. Experimental procedure
The intermediate pyrolysis experiments were performed in a fixed-bed tubular reactor. The pyrolysis system used in this study is shown in Figure 1. In a typical run, 10 g of raw material were charged in the reactor. The pyrolysis reactor was externally heated using an electric furnace equipped with an temperature controller to maintain the desired pyrolysis temperature.
The vapors produced were passed through a condenser at −10 °C, using a cryostat, for collection of the bio-oil in collecting bottles. Biochar produced was contained in the reactor and was collected after cooling down the system to ambient temperature conditions.
Process parameters were defined as:
- Heating rate: 15, 30 and 50 °C/min
- Pyrolysis temperature: The pyrolysis is carried out at 400 to 600 °C.
- Nitrogen flow: 150 ml/min
- The permanence time at the final temperature is 15 min.
Each run was repeated at least twice to validate the data, and the average values obtained for the variables were reported:
- Bio-oil yield (%) = bio-oil collected weight/ initial feedstock weight × 100
- Biochar yield (%) = Biochar weight/initial feedstock weight × 100
- Gas yield (%) = 100 − (bio-oil yield + biochar yield)
2.3. Characterization techniques
Proximate analysis was conducted using thermogravimetric analysis (METTLER TOLEDO-TGA/DSC 3+). The moisture content is determined by the mass loss after the sample is heated to 105 °C under N2. The volatile matter corresponds to the mass loss between 105 and 900 °C under N2. Fixed carbon is the solid combustible material that leads to the mass loss at 900 °C when the atmosphere is switched from N2 to air [22]. The residue left is the ash content. Ultimate analysis for C, H, N, and S content was performed using an elemental analyzer (vario MICRO cube V4.0.2). The H/C, O/C molar ratios, and empirical formula were calculated from the elemental composition. Higher heating value (HHV) of samples was experimentally measured using a bomb calorimeter (Model 1261, Parr Instruments) according to ASTM D 5865-04.
FTIR spectroscopic analyses were performed to determine the distribution of functional groups present in pyrolysis products (bio-oil and biochar). The FTIR spectra of the produced bio-oil and biochar were recorded using a Bruker Tensor 27 infrared spectrometer in the wavelength range of 400–4000 cm−1 with a resolution of 4 cm−1 and accumulation of 16 scans.
1H-NMR spectra were recorded on 600 MHz Bruker Spectro spin instruments. The bio-oil sample was diluted with CDCl3.
Gas Chromatography–Mass Spectrometry (Thermo Scientific ISQ Single Quadrupole) was used to analyze the bio-oil fraction. By comparing the recorded mass spectra of compounds with those given in the NIST2008 c2.0/Xcalibur data system library [10], provided by the instrument software, compound identification was done. Bio-oil was separated by silica capillary column, using helium as the carrier gas (1.2 ml/min). The injection volume was 1 mL using a 20:1 split ratio and an injector temperature of 260 °C. The GC temperature sequence was 70 °C start, hold 2 min, ramp at 10 °C/min to 300 °C and hold at 300 °C for 5 min.
The morphology of raw waste and its biochar was investigated by a Scanning Electron Microscope (Phenom Pro X). SEM was carried out using an electron acceleration of 15 kV. Images were taken at a magnification of 3000×.
3. Results and discussion
3.1. Characterization of red algal biomass
3.1.1. Proximate and ultimate analysis
The red algal sample contains 8.45% moisture, 10.85% ash, 18.55% fixed carbon and 70.60% volatile matter (Table 1). It may be noted that the red algal biomass was more appropriate for bio-oil production. Results of the ultimate analysis are also given in Table 1. It is important to note that the red algal sample has low sulfur and nitrogen content in comparison with the results published in the literature for other macroalgae [23, 24].
3.1.2. Thermogravimetric analysis of red algae
The thermogravimetry and mass loss rate plot of red algal biomass at heating rates of 10 °C/min is shown in Figure 2. In general, three distinct weight loss stages could be identified. The first stage occurred as the temperature increased from initial setting temperature to 150 °C, and this can be attributed to vaporization of the moisture attached on the surfaces of the samples. The second stage occurred as the temperature increased from 200 °C to 400 °C, this step corresponds to decomposition of the different biopolymer fractions, and can be attributed to the decomposition of carbohydrates and proteins. The third stage occurred from 400 °C to 800 °C. In this phase, the carbon containing compounds in the solid residues continuously are decomposed at a very slow rate [25]. A slight continued loss of weight is shown in the weight loss curve. A significant proportion of inorganic materials in kelps decompose at 700–800 °C, probably a consequence of the presence of metal carbonates. This is consistent with the results in the literature [25, 26]. From DTG curve, it is evident that de-volatilization takes place from 200 to 400 °C and decomposition happens from 400 to 600 °C. Therefore, the result of TGA/DTG curves shows that 400–600 °C range would be optimal for pyrolysis of red algae.
The TG and DTG curves of red algal biomass at 10 °C/min.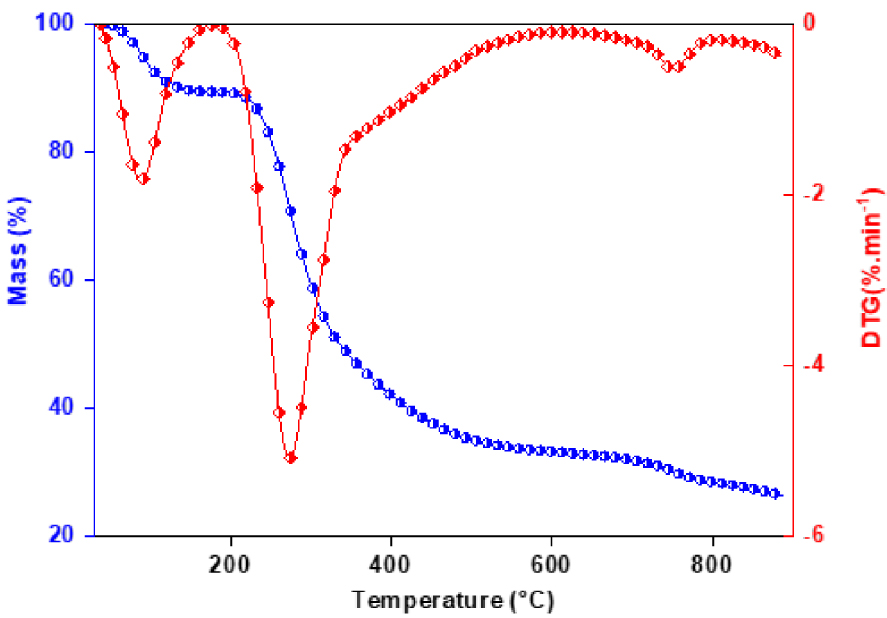
3.1.3. FTIR characterization of red algae
The FTIR spectrum (Figure 3) of the red macroalgae shows the presence of dense bands at 3320 cm−1 which are attributed to OH hydroxyl groups, mainly indicating the presence of alcohols, phenols and carboxylic acids (presence of polysaccharides and proteins) or bound to adsorbed water on the surface of macroalgae. The band appearing on the spectrum at 1640 cm−1 is attributed to the vibrations of C =O bonds or COO groups of polysaccharide acids. At 1527 cm−1, a band was observed in the FTIR spectrum, it was attributed to the elongation of C =C in phenolic groups. Thus, bands between 1320 and 1480 cm−1 could be attributed to the presence of oxygen groups, carbonyl groups, ethers, esters, alcohols, and phenolic groups [10]. A broad absorption band between 900 and 1200 cm−1 is attributed to C–C groups existing in esters and C–O groups in ethers, alcohols, and phenols.
FTIR spectra of red algal biomass.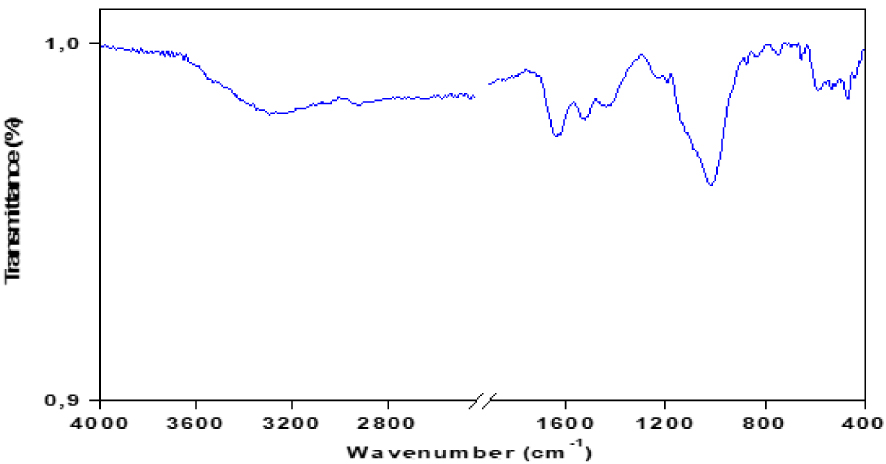
3.2. Effect of final temperature and heating rate on yields of pyrolysis products
The results of pyrolysis and distribution of products obtained at different temperatures with different heating rates are given in Table 2 and Figures 4, 5 and 6. The data given in the Table 2 were obtained from the experimental runs at different temperatures ranging from 400 °C to 600 °C with heating rates of 15, 30, 50 °C/min. It can be seen that temperature has a positive effect either sharply or slightly on product yield. According to the results, when temperature is increased from 400 to 450 °C, bio-oil yield increases from 40.21% to 43.68% at a heating rate of 15 °C/min, from 41.51% to 44.39% at a heating rate of 30 °C/min and from 42.04% to 45.02% at a heating rate of 50 °C/min. So, the highest liquid product yield (45.02%) was obtained at 450 °C with a heating rate of 50 °C/min. Beyond 450 °C, the bio-oil yields have decreased to 33.19%, 34.93%, and 35.52% at 600 °C at heating rates of 15, 30, 50 °C/min respectively. Overall, the product yields from pyrolysis of algal biomass obtained in the present study are similar to other studied algal species [26, 27, 28].
Effect of final pyrolysis temperature on product yields at a heating rate of 15 °C/min.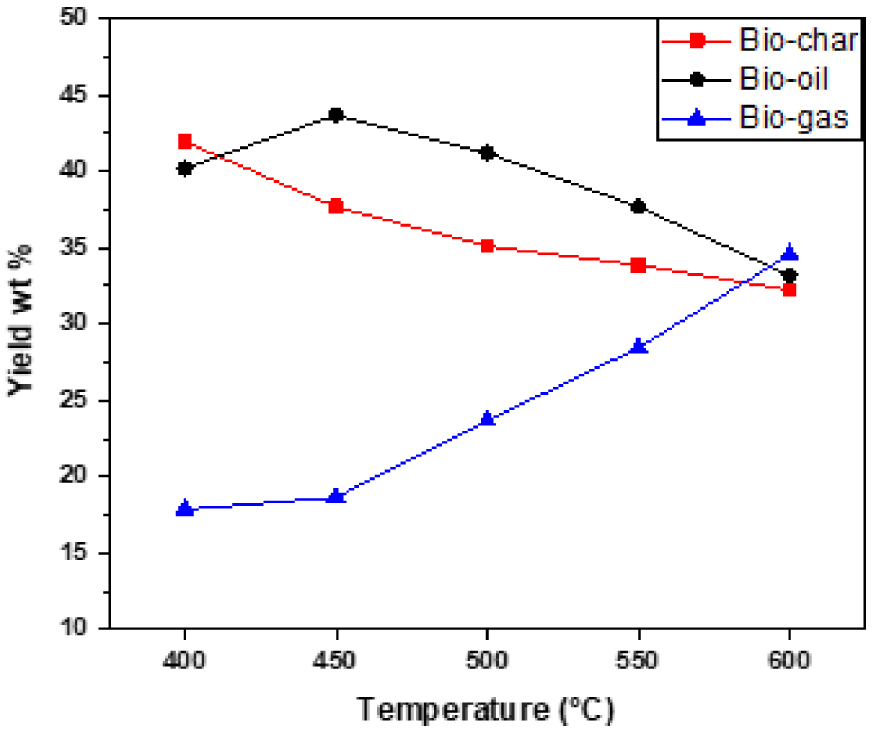
Effect of final pyrolysis temperature on product yields at a heating rate of 30 °C/min.
Effect of final pyrolysis temperature on product yields at a heating rate of 50 °C/min.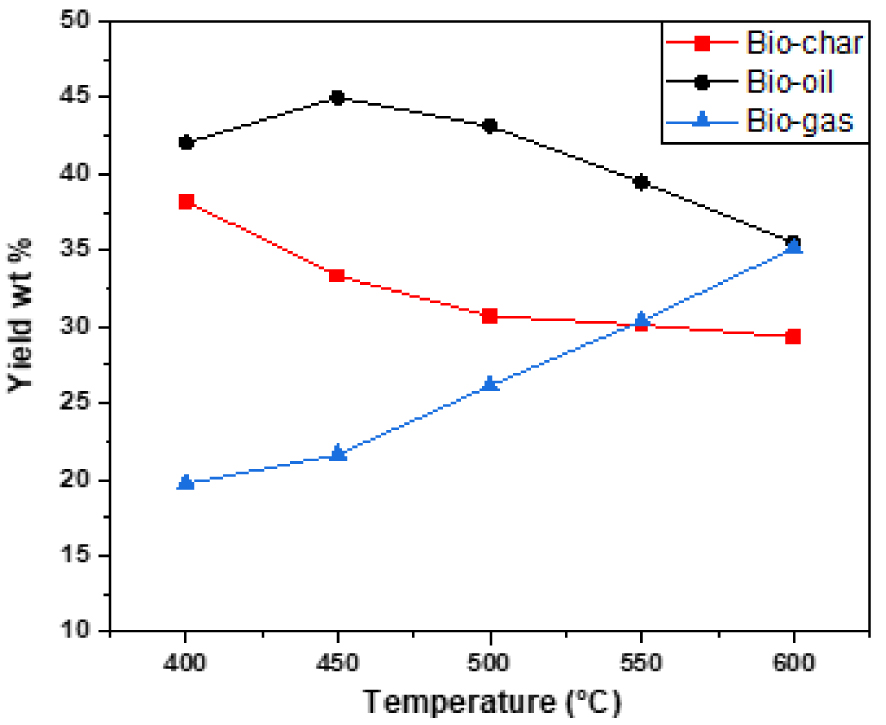
Distribution of products obtained by intermediate pyrolysis of red algal biomass at different temperatures and heating rates
| Temperature (°C) | 400 | 450 | 500 | 550 | 600 | |
|---|---|---|---|---|---|---|
| 15 °C/min | Biochar (%) | 41.94 | 37.67 | 35.12 | 33.86 | 32.24 |
| Bio-oil (%) | 40.21 | 43.68 | 41.2 | 37.69 | 33.19 | |
| Biogas (%) | 17.85 | 18.65 | 23.68 | 28.45 | 34.57 | |
| 30 °C/min | Biochar (%) | 39.99 | 35.51 | 33.14 | 31.51 | 30.81 |
| Bio-oil (%) | 41.51 | 44.39 | 42.68 | 38.3 | 34.93 | |
| Biogas (%) | 18.5 | 20.1 | 24.18 | 30.19 | 34.26 | |
| 50 °C/min | Biochar (%) | 38.23 | 33.34 | 30.71 | 30.13 | 29.33 |
| Bio-oil (%) | 42.04 | 45.02 | 43.15 | 39.47 | 35.52 | |
| Biogas (%) | 19.73 | 21.64 | 26.14 | 30.4 | 35.15 | |
The optimum conditions for the maximum production of bio-oils are obtained at a pyrolysis temperature of 450 °C with a heating rate of 50 °C/min. Under these conditions, yields of biochar, bio-oil, and biogas are 33.34%, 45.02%, and 21.64%, respectively. All our results can be analyzed as follows:
- At temperatures below 400–450 °C, low yields are attributed to incomplete conversion of organic matter. And at a temperature above 450 °C, the bio-oil cracking reaction leads to a low yield. The residence of the oils at high temperatures allows their cracking in small gas molecules. In the intermediate temperatures, there is a compromise between said secondary reactions and the final temperature, which leads to an optimum oil yield [25, 29]. For this, optimal yield of bio-oil has been obtained for temperatures between 450 and 500 °C.
- At low heating rates, the residence time of the oils in the mineral matrix is large; cracking remains low and the flow of locally produced gases is insufficient to drive organic molecules out of the grain of the algae. This leads to low oil yields. On the other hand, at very high heating rates, the residence time of the oils is shorter. The coking and cracking reactions of the oils are more important as the temperature is high, which leads to low yields. And in the intermediate heating rates, we can have a good compromise between the effects of the parameters mentioned above and we obtain an optimal oil yield.
Infrared bands observed in the FTIR spectra of bio-oil produced by pyrolysis of red algal biomass (T = 450 °C and 𝛽 = 10 °C⋅min−1)
| Band position (cm−1) | Allotment | Classification |
|---|---|---|
| 3200–3600 | O–H | Polymer O–H |
| 2850 and 2930 | C–H | Alkanes |
| 1700 | C =O | Ketones, aldehydes, lactones or carboxylic groups |
| 1600–1680 | C =C | Olefin |
| 1200–1350 | C–H | Aromatic |
| 1000–1200 | C–O | Alcohol, ester, and ether |
| 3150 | N–H | Heteroatom |
3.3. Bio-oil characterization
3.3.1. Elemental composition and ash content
The elemental compositions of the characterized bio-oil are listed in Table 1, and the molar composition of the analyzed bio-oil was CH1.37O0.78N0.060. The bio-oil has higher carbon contents and lower oxygen content than the original raw material and accordingly have higher heating values when compared with higher heating value of the raw material. As shown in Table 1, the higher heating values of bio-oils was higher than 20.11 MJ/kg, in comparison with a higher heating value (15.18 MJ/kg) of the raw material. The H/C ratio of bio-oil was less than that of the raw material. Further comparison of H/C ratio with conventional fuels indicates that the H/C ratios of the oils obtained in this study were between those of light and heavy petroleum products [30]. Carbon and oxygen contents from the ultimate analysis revealed that the bio-oil has lower carbon (44.52 wt%) and higher oxygen (46.00 wt%) compared to the value reported by Zhao et al. [31] (59.52 wt%-carbon; 30.27 wt%-oxygen).
3.3.2. FTIR characterization
The infrared analysis spectrum of pyrolysis bio-oil is shown in Figure 7 the most intense bands are reported in Table 3. The broad absorption band between 3200–3600 cm−1 corresponds to the hydrogen expansion vibrations of the hydroxyl groups O–H (of carboxyls, phenols or alcohols) and of the adsorbed water. It also corresponds to the O–H elongation vibration of polysaccharides and proteins. The FTIR spectrum shows absorption bands between 2850 and 2930 cm−1 resulting mainly from the C–H elongation vibrations of the aliphatic molecules. The absorption band at about 1710 cm−1 is characteristic of carbonyl groups such as saturated and aromatic aliphatic carboxylic acids, ketones, and esters. The fact that this band is much more intense in the bio-oil suggests an advanced degradation of macroalgae during pyrolysis as well as a formation of many compounds with carbonyl groups. The spectrum also shows a band at 1600–1680 cm−1 due to the extensional vibrations of the C =C bonds of the olefinic structure, the bands between 1000 and 1350 cm−1, and between 700 and 900 cm−1 are assigned to the vibration’s aromatic bonds. Absorbance peaks are observed at 1730–1150 cm−1, corresponding to the presence of heteroatom functions (N and O). Also, the acidic compounds are represented by the C–O elongation band observed at 1210–1320 cm−1 [31]. Other bands appear between 1000 and 1200 cm−1, due to the presence of alcohols, phenols, ethers, and esters.
FTIR spectra of bio-oil produced by pyrolysis of red algal biomass (T = 450 °C and 𝛽 = 10 °C∕min).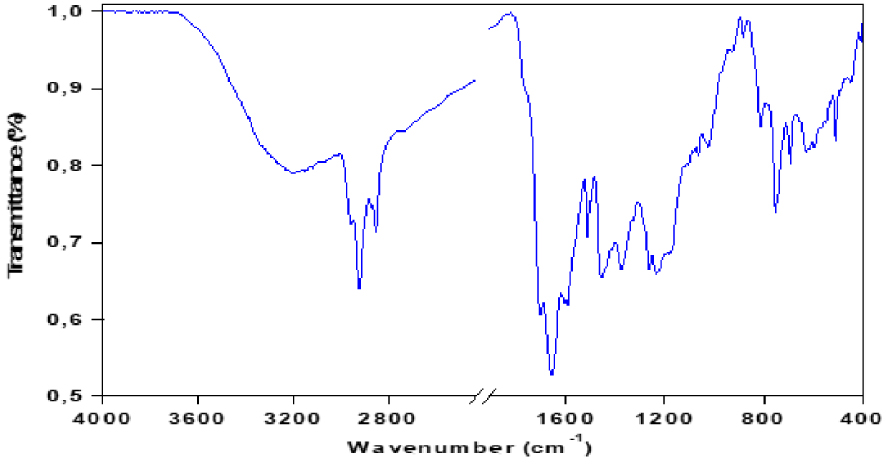
3.3.3. 1H-NMR characterization
1H-NMR spectra of red algal pyrolysis bio-oil was shown in Figure 8. 1H-NMR band assignments corresponding to structural features of red algal bio-oil are given in Table 4. According to this scheme, bands between 0.5 and 4.5 ppm were identified as aliphatics. The signal due to the oxygenated phenols, the 4.5–6 ppm range, is broadened. Resonances between 6 and 9 ppm were assigned to aromatic structures.
1H-NMR spectra of bio-oil produced by pyrolysis of red algal biomass (T = 450 °C and 𝛽 = 10 °C∕min).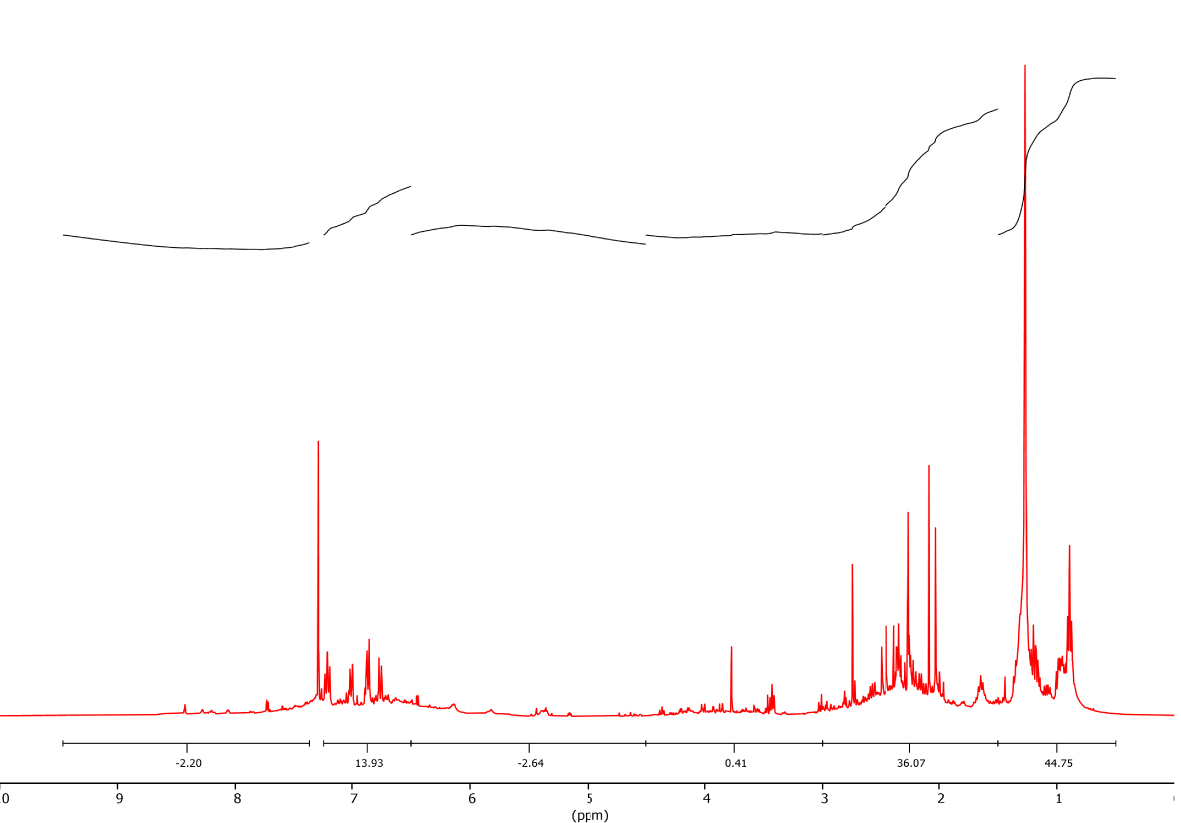
Nomenclature and chemical shifts of protons in 1H-NMR
| Chemical shift (ppm) | Nomenclature | Symbol | % in mass |
|---|---|---|---|
| 6.50–9.50 | Aromatic proton | HA | 16.13 |
| 4.5–6.5 | Olefinic proton | HO | 2.64 |
| 0.50–4.50 | Saturated proton (aliphatic) | HS | 81.23 |
| 3.00–4.50 | Proton on an 𝛼-saturated carbon of an aromatic ring | HS𝛼 | 0.41 |
| 1.50–3.00 | Proton on a carbon saturated in 𝛽 (–CH3) with 𝛽 or more (–CH2) of an aromatic cycle | HS𝛽 | 36.07 |
| 1.50–0.50 | Proton methyl (–CH3) on a carbon saturated with 𝛾 or more than one aromatic ring | HS𝛾 | 44.75 |
It is therefore possible to calculate the proton distributions (% calculated by integration) for the main classes of compounds in the pyrolysis bio-oil (Table 4). The region of the aliphatic protons between 0.5 and 4.5 ppm is divided into three regions: the region of protons methyl (–CH3) on a saturated carbon between 0.5–1.5 ppm contains 44.75%. The second region between 1.5 and 3.0 ppm reflecting the presence of the bonds (–CH2) which can be attached by naphthenes, this region contains 36.07% protons in the bio-oil. Between 3.0 and 4.5 ppm, the observed images are attributed to protons on a saturated carbon in an aromatic ring with an average value of 0.41%. The obtained bio-oil includes ∼81% aliphatic hydrocarbons and ∼16% aromatic hydrocarbons.
Boiling-point distribution of the bio-oil obtained by TGA
| Temperature (°C) | % Evaporated | |
|---|---|---|
| Light naphtha | 15.5–149 | 3.35 |
| Medium naphtha | 149–232 | 21.36 |
| Gas oil | 232–343 | 30.67 |
| Light vacuum gas oil LVGO | 343–371 | 5.99 |
| Heavy vacuum gas oil HVGO | 371–566 | 14.32 |
| Residuum | >566 | 22.31 |
Chemical composition of the bio-oil produced by pyrolysis of red algal biomass (T = 450 °C and 𝛽 = 50 °C⋅min−1)
| Retention time | Compounds | Area (%) |
|---|---|---|
| 4.48 | 2-Pyridinecarboxylic acid | 0.89 |
| 6.903 | Pyridine, 2-methyl- | 0.97 |
| 7.926 | Isoamyl cyanide | 0.60 |
| 8.65 | Ethylbenzene | 1.14 |
| 8.97 | o-Xylene | 0.57 |
| 10.433 | 2-Cyclopenten-1-one, 2-methyl- | 0.60 |
| 10.627 | Ethanone, 1-(2-furanyl)- | 2.06 |
| 11.356 | Pyridine, 2,5-dimethyl- | 0.91 |
| 13.503 | Phenol | 9.06 |
| 13.8 | mesitylene | 1.08 |
| 13.849 | Pyridine, 2,4,6-trimethyl- | 1.02 |
| 14.059 | Carbonic acid, 2-methoxyethyl phenyl ester | 0.56 |
| 14.122 | N, N’-di-t-butylethylenediamine | 1.77 |
| 14.336 | Pyridine, 2,3,6-trimethyl- | 1.46 |
| 14.856 | Benzene, 1,2,4-trimethyl- | 0.62 |
| 14.987 | Benzene, 1-propenyl | 0.83 |
| 15.445 | 2-Cyclopenten-1-one, 2,3-dimethyl- | 0.75 |
| 16.099 | Phenol, 2-methyl- | 2.48 |
| 16.179 | Bicyclo [3.1.1] hept-2-en-6-ol, 2,7,7-trimethyl-, acetate, [1S-(1, alpha, 5, alpha, 6, beta,)]- | 0.56 |
| 16.253 | Ethanone, 1-(1H-pyrrol-2-yl)- | 0.71 |
| 16.325 | 2-pyridinecarbonitrile | 0.66 |
| 16.502 | Cyclohexene, 1-methyl-4-[1-(tetrahydropyran-2-yloxy) ethyl]- | 1.51 |
| 16.854 | p-Cresol (4-methylphenol) | 11.93 |
| 16.97 | Imidazole, 2-cyano-4-methyl- | 1.10 |
| 17.045 | Phenol, 3-methyl- | 0.66 |
| 17.105 | Benzene, 1,2,3,4-tetramethyl- | 0.80 |
| 17.14 | 6-(Dimethylamino) fulvene | 0.80 |
| 17.255 | 2,5-Pyrrolidinedione, 1-methyl- | 2.92 |
| 17.715 | Benzofuran, 7-methyl- | 0.91 |
| 17.837 | Fumaric acid, ethyl 2-(2-methylenecyclopropyl) propyl ester | 1.22 |
| 17.877 | Benzofuran, 2-methyl- | 1.04 |
| 18.136 | mannosamine | 1.06 |
| 18.916 | Benzyl nitrile | 2.04 |
| 19.164 | 1H-Pyrrole-2-carbonitrile | 0.63 |
| 19.255 | Phenol, 2,5-dimethyl- | 3.87 |
| 19.366 | Benzene, 1,2,3,5-tetramethyl- | 1.00 |
| 19.436 | Cycloprop [a] indene, 1,1a, 6,6a-tetrahydro- | 0.83 |
| 19.531 | 3-aminophenyl, beta, -phenylpropionate | 1.42 |
| 19.68 | Pyridine, 4-propyl- | 0.59 |
| 19.858 | Phenol, 4-ethyl- | 2.01 |
| 19.915 | 1,3,5-Cycloheptatriene, 1-methoxy- | 1.37 |
| 20.391 | naphthalene | 1.31 |
| 20.895 | Nonane, 4,5-dimethyl- | 0.60 |
| 21.021 | Phenol, 2,3,5-trimethyl- | 0.62 |
| 21.146 | 1,4: 3,6-dianhydro-alpha-d-glucopyranose | 0.75 |
| 21.174 | Benzofuran, 4,7-dimethyl- | 0.69 |
| 21.409 | Benzofuran, 4,7-dimethyl- | 1.77 |
| 21.603 | p-Propargyloxytoluene | 0.59 |
| 21.785 | Phenol, 3-ethyl-5-methyl- | 0.94 |
| 21.893 | 1H-Pyrazole-5-carboxylic acid, 3-(1-methylethyl)- | 0.71 |
| 22.101 | 1-(2-Methylenecyclopentyl) -1-phenylethanol | 0.63 |
| 22.156 | Benzenepropanenitrile | 1.79 |
| 22.787 | 4 (1H)-quinazolinone | 1.41 |
| 22.976 | Benzaldehyde, 3-methoxy-4-(4-methylbenzyloxy)- | 0.58 |
| 23.115 | N-[2-Hydroxyethyl] succinimide | 0.77 |
| 23.49 | 2 (3H) -Furanone, 4,5-dihydro-5-methoxy-4-(2,3-dimethyl-2-buten-4-yl)- | 0.60 |
| 23.816 | Naphthalene, 1-methyl- | 1.17 |
| 23.919 | Tridecane | 0.71 |
| 24.317 | 1H-Inden-1-one, 2,3-dihydro-3,3-dimethyl- | 1.22 |
| 24.461 | Naphthalene, 1,2,3,4-tetrahydro-6,7-dimethyl- | 0.88 |
| 24.595 | Benzene, (3-chloro-1-methyl-1-propenyl) | 0.70 |
| 24.863 | 3-Buten-2-one, 3-methyl-4-phenyl- | 0.70 |
| 26.447 | 1H-Indole, 6-methyl- | 0.67 |
| 26.524 | 1-pentadecene | 0.98 |
| 26.735 | Tetradecane | 0.94 |
| 27.407 | Naphthalene, 2,3-dimethyl- | 0.56 |
| 27.47 | Naphthalene, 1,7-dimethyl- | 0.59 |
| 28.326 | 1H-Benzocycloheptene, 2,4a, 5,6,7,8,9,9a-octahydro-3,5,5-trimethyl-9-methylene-, (4aS-cis)- | 0.87 |
| 29.083 | cis - (-) - 2,4a, 5,6,9a-hexahydro-3,5,5,9-tetramethyl (1H) benzocycloheptene | 1.10 |
| 29.192 | 1-pentadecene | 0.99 |
| 29.391 | pentadecane | 1.97 |
| 29.668 | 1H-Benzocycloheptene, 2,4a, 5,6,7,8-hexahydro-3,5,5,9-tetramethyl-, (R)- | 1.93 |
| 31.713 | E-14-hexadecenal | 0.79 |
| 34.263 | heptadecane | 1.67 |
| 38.708 | Hexadecanenitrile | 0.76 |
3.3.4. Thermogravimetric analysis
Thermogravimetric analysis of the bio-oil obtained at 450 °C and heating rate of 50 °C/min was performed to evaluate its volatility. The results of the TG analysis are shown in Figure 9. The boiling-point distribution was described according to the terminology and classification proposed by Speight for petroleum products [32]. Results of the analysis are reported in Table 5. The evaporation behavior of the bio-oil shows that it is mainly constituted of a medium naphtha fraction and of gas oil. High-boiling-point fractions (b.p. > 343 °C) represent 42.62% mass fraction of the total bio-oil. On the other hand, the bio-oil has a small fraction of low-boiling-point constituents (3.35%). This observation might be explained by the bio-oil recovery procedure: low-boiling-point molecules are evaporated along with ethyl acetate, which is observed by GC–MS analysis of the bio-oil before and after evaporation [33]. While TG analysis is a useful tool to get insights on the distillation potential of the bio-oil, it should be kept in mind that not only the boiling points but also the chemical nature of the molecules is important for further upgrading steps. In the following section, we present the molecular composition of the bio-oil obtained by GC–MS analysis.
TGA/DTG curve of the bio-oil produced by intermediate pyrolysis of red algal biomass (T = 450 °C and 𝛽 = 50 °C∕min).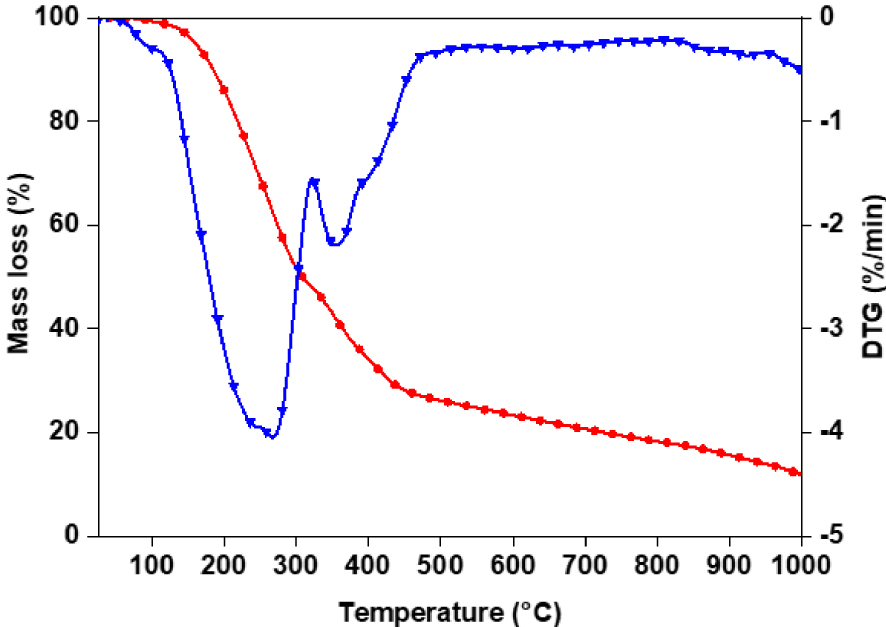
3.3.5. GC–MS characterization
The bio-oil obtained at optimum conditions (temperature of 450 °C with a heating rate of 50 °C/min) from the intermediate pyrolysis of red algal biomass was characterized by GC–MS for identification of its chemical composition. The composition of bio-oil from the intermediate pyrolysis of red algal biomass is of great interest because it is an important parameter for evaluating the potential of the bio-oil for combustion or further upgrading into fuels or chemicals. Figure 10 shows a chromatogram obtained by GC–MS analysis of the bio-oil from red algal pyrolysis and the compounds of the bio-oil are listed in Table 6. The volatile fraction of bio-oil produced from red algae is a complex mixture of over 200 compounds. When mass spectra were compared to library data, several classes of chemicals from 5 to 20 carbon atoms such as aliphatic and aromatic hydrocarbons, carboxylic acids, aldehydes, ketones, alcohols, esters and phenols were identified. We see clearly that our GC–MS data are very well aligned with the FTIR data since all classes of identified chemical compounds were first identified by FTIR. Phenol, p-cresol, catechol, indole, 2-methyl-phenol compounds were majorly found from pyrolysis of red algal biomass. These phenolic fragment derivatives could be derived from the thermal decomposition of proteins known as phenolic components in aquatic biomass. Different types of acids and alkanes were identified, and they were mainly transformed from the degradation of carbohydrates. Heterocyclic compounds nitrated in algae bio-oil, such as indoles and pyridines, were assumed to be derived from protein degradation.
Chromatogram of the GC–MS analysis of the bio-oil produced by pyrolysis of red algal biomass (T = 450 °C and 𝛽 = 50 °C∕min).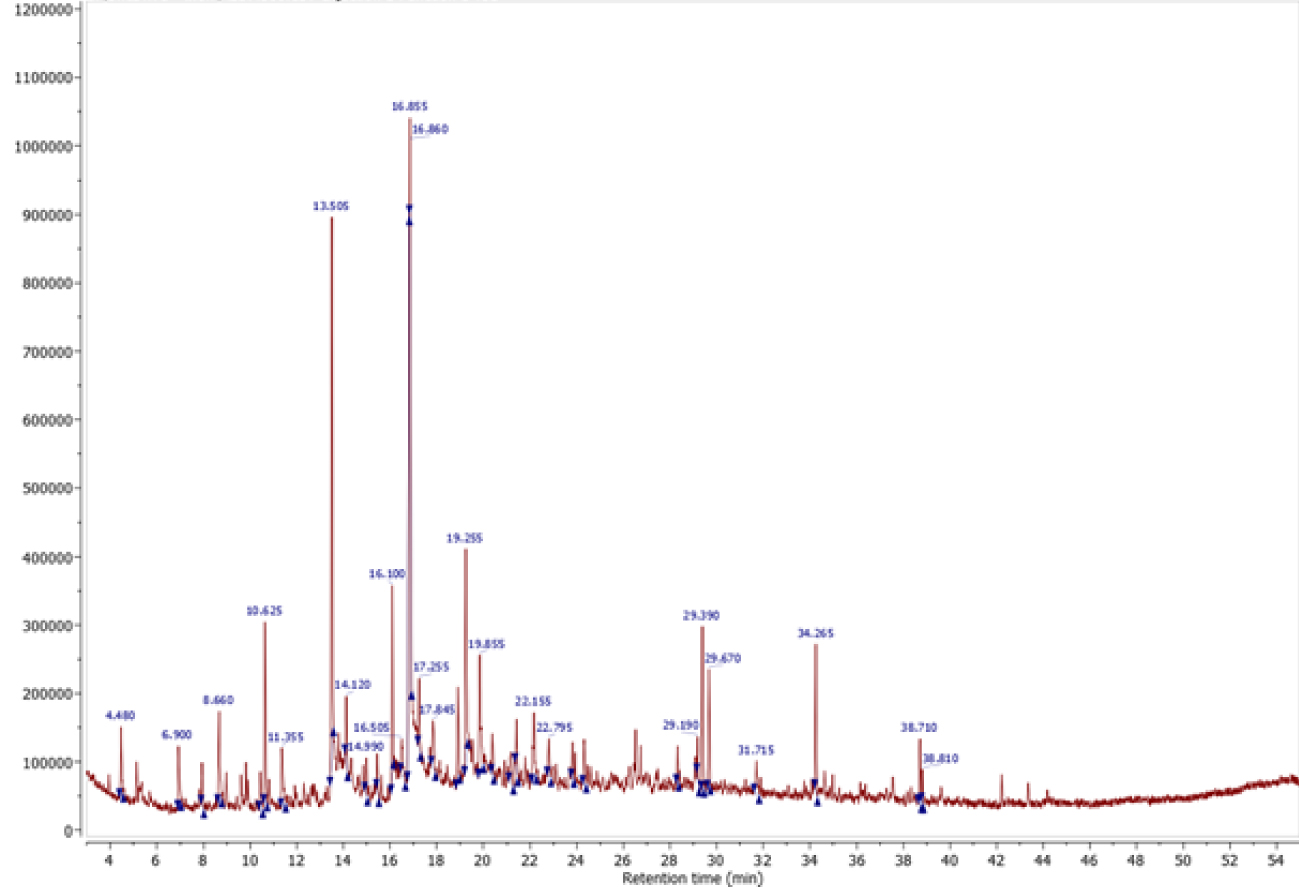
FTIR spectrum of biochar produced by intermediate pyrolysis of red algal biomass (T = 450 °C and 𝛽 = 50 °C∕min).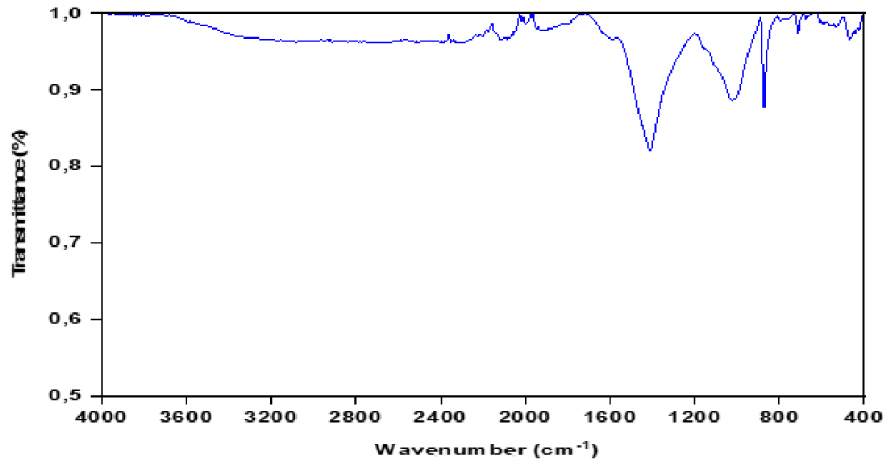
3.4. Biochar characterization
3.4.1. Elemental composition and ash content
Biochar obtained at optimum operating condition is characterized by various physicochemical and analytical methods. Table 2 shows the proximate and elemental composition of biochar. Comparing the C, H, O, and N content of biochar and its red algal biomass, it seems that biochar becomes carbonaceous, since the carbon content in biochar is higher than that in red algal biomass. It is also observed that significant variation occurs in C and O content as well as slight variation occurs in H, N and S content between red algal biomass and biochar. This demonstrates the removal of oxygen and other volatile components from red algal biomass during pyrolysis, which enhances the fixed carbon in biochar [34]. The pyrolysis process favors the higher carbon concentration in the biochar which, consequently, increases its energetic potential. HHV of biochar is 22.89 MJ/kg, which is higher than the red algal biomass (15.18 MJ/kg). The H/C and O/C values found in the biochar of red algal biomass are lower than the corresponding values for the raw biomass, demonstrating the effect of pyrolysis process in increasing the carbon content of the biochar. Other pyrolysis experimental studies have reported similar behavior in the ultimate macroalgae analysis [5, 10].
3.4.2. FTIR characterization
FTIR spectra of biochar (Figure 11) has shown the changes of the functional groups on the surfaces of the biochar produced from pyrolysis, indicating an efficient conversion of red algae under pyrolysis conditions (temperature of 450 °C and heating rate of 50 °C/min). Compared to the infrared spectra of the raw red algae in Section 3.1.3, the spectra of this biomass show that different oxygen-containing surface groups (C–O, C =O, –OH) and other groups (olefins and aromatic rings) are present. The O–H stretching vibrations at 3600–3100 cm−1 in the FTIR spectra of the produced biochar were nearly absent after the pyrolysis process, probably due to the dehydration of the red algal biomass together with the release of a large amount of water. The peak at 1414 cm−1 is representative of aromatic C =O and C =C functional groups. The peaks between 700 and 900 cm−1 were assigned to an aromatic C–H stretching vibration that indicates the presence of adjacent aromatic hydrogens in biochar [35]. The spectrum of the biochar obtained showed the disappearance of most of the bands and suggested that the biochar was mainly an aromatic polymer comprised mostly of carbon atoms.
SEM image of red algal biomass and its biochar produced by pyrolysis at T = 450 °C and 𝛽 = 50 °C∕min.
3.4.3. Scanning electron microscopy (SEM)
Scanning electron microscopy (SEM) was applied to characterize the porous surface structure of the biochar produced by intermediate pyrolysis of red algae. Figure 12 shows the SEM images of raw red algal biomass and its biochar. A comparison of the SEM micrographs of the raw algal biomass and its biochar allows interesting conclusions to be drawn about morphological changes after the pyrolysis step. As evident from these images, few pores were present on the surface of the raw material. However, the morphology of the biochar shows greater proportion of voids and higher porosity on its surface. This was attributed to the increased rate of decomposition and elimination of volatiles at higher pyrolysis temperatures, enhancing surface roughness, surface area, active sites, cracks, pores, and ultimately improving the adsorption and retention capacities of the biochar.
4. Conclusions
In this study, the potential of converting red algal biomass to bio-oil and biochar using intermediate pyrolysis was evaluated. The pyrolysis process of red algal biomass was performed at the temperatures of 400–600 °C and heating rate of 10–50 °C/min and the optimum condition for bio-oil formation is at 450 °C with a heating rate of 50 °C/min. It was found that the obtained bio-oil has higher heating value than the raw material. From a GC–MS analysis of bio-oil, the main compounds of the bio-oil are phenol, p-cresol, catechol, indole, and 2-methyl-phenol. The hydrocarbon groups were found to be in a range of medium naphtha fraction and of gas oil. Biochar analysis showed that both carbon and heating values increased, hydrogen and oxygen content decreased in comparison with raw material. This indicates an increase in the carbonaceous nature of the biochar, thus making their utilization as solid fuel a very attractive.