

Version française abrégée
Les dépôts atmosphériques acides de soufre et d'azote ont fortement augmenté en Europe entre 1960 et 1980. Depuis, les émissions de soufre ont été réduites de 70 % alors que les émissions d'azote sont constantes ou en légère augmentation [1,5]. L'étude de ces phénomènes en France a montré leur impact sur la santé des écosystèmes forestiers et aquatiques [9,10,16,17]. En forêt, l'acidification se traduit par une augmentation de [H+] et [Al3+] dans la solution de sol, la désaturation du complexe d'échange et le lessivage des cations basiques [19]. La convention de l'ONU sur la pollution atmosphérique transfrontière à longue distance (1979) a défini les charges critiques comme « l'estimation quantitative de l'exposition à un ou plusieurs polluants, en dessous de laquelle des effets néfastes significatifs sur des éléments sensibles précis de l'environnement n'apparaissent pas, en l'état actuel des connaissances » [11]. La France, en tant que pays signataire du dernier protocole (Göteborg, 1999), s'est engagée à calculer les charges critiques spécifiques à ses écosystèmes et à les fournir aux instances chargées de la coordination au niveau européen [13,14,18]. Ces données constituent un élément important dans la négociation sur la réduction des émissions de polluants. La présente étude vise à déterminer la sensibilité des écosystèmes de la France métropolitaine vis-à-vis des dépôts atmosphériques acides par le calcul des charges critiques en soufre et azote. Dans ce but, une nouvelle classification des écosystèmes est créée à partir de données géologiques, pédologiques et de végétation. L'altération, les dépôts atmosphériques et les prélèvements par la végétation sont déterminés et l'importance relative de ces paramètres est mise en évidence.
L'équation de calcul des charges critiques en soufre est la suivante [6] :
Les deux principales méthodes pour le calcul de la limite critique, ANCle,crit sont [6] :
- (1) [H+] et [Al3+] critiques dans l'eau de drainage
- (2) critique dans l'eau de drainage
Le drainage Q est déterminé en combinant les cartes des écosystèmes et des pluies efficaces, via une relation entre pluies efficaces et eau de drainage sur 12 stations du réseau français de surveillance des forêts (RENECOFOR) [12,21]. [H+]crit et [Al3+]crit sont fixés respectivement à 25 μequiv l−1 (pH = 4,6) et à 200 μequiv l−1 [3,13,16]. est fixé à 1,2 [12].
La première méthode utilise des concentrations critiques fixées de protons et d'aluminium et est donc essentiellement dépendante du drainage. La seconde méthode prend en compte un bilan de flux de cations en solution, qui limite la toxicité de l'aluminium à pH faible. Prenant en compte un effet tampon lié au milieu, la seconde méthode est utilisée à l'échelle nationale.
Les dépôts atmosphériques de cations basiques , corrigés des apports marins [4], ont été déterminés à partir de l'extrapolation de données de dépôts hors couvert forestier du réseau RENECOFOR [2] sur une grille de . Pour estimer les dépôts secs et humides sous couvert forestier, et en l'absence de données spatialisées, un coefficient a été appliqué aux dépôts hors couvert. Il est estimé à partir de mesures in situ [21] de pluviolessivats, qui sont ici considérés comme équivalents aux dépôts totaux sous couvert forestier. Les prélèvements par la végétation BCuptake et Nuptake sont calculés à partir des données de l'Inventaire forestier national sur la production de biomasse par les forêts [8] et du contenu de l'espèce dominante en cations et azote [12]. Le taux d'altération en cations basiques BCweath est calculé en appliquant le modèle numérique PROFILE [20] aux sols des Vosges, des Ardennes et de 12 stations du réseau RENECOFOR. Ces résultats sont ensuite extrapolés à l'ensemble des sols de la carte des sols de France, en se basant sur leur teneur en argile [12]. L'immobilisation d'azote est estimée à 150 equiv ha−1 an−1 pour les zones de plaine et à 300 equiv ha−1 an−1 pour les zones de montagne [15].
Les classifications d'écosystèmes existantes, essentiellement basées sur des données de végétation, manquent d'informations pédologiques et géologiques pour être appliquées au calcul des charges critiques [12]. La création d'une nouvelle classification a donc été nécessaire. La carte des sols et matériaux parentaux de l'INRA est regroupée en 31 types [7,12], puis croisée avec la carte de végétation potentielle. La carte résultante est ensuite croisée avec la carte d'occupation du sol [12]. Seuls les polygones forestiers ou de plus de 85 % de prairies sont conservés. Parmi les 241 types d'écosystèmes de la classification finale, cinq écosystèmes non calcaires et représentatifs des zones sensibles à l'acidification ont été choisis pour présenter le calcul des charges critiques (Tableau 1). Les charges critiques de soufre ont été calculées et cartographiées à l'échelle de la France (Fig. 1).
Description of the five selected ecosystems. Input data and critical loads for S and N for the five selected ecosystems. All fluxes are in equiv ha−1 yr−1
Description des cinq écosystèmes sélectionnés. Données d'entrée et charges critiques en S et N pour les cinq écosystèmes sélectionnés. Tous les flux sont exprimés en equiv ha−1 yr−1
| Ecosystem No. | 1 | 2 | 3 | 4 | 5 |
| Location | Massif Central | Massif Central | Paris Basin | Vosges Mountains | Landes |
| Bedrock | Volcanic rocks | Granite | Tertiary sands | Sandstone | Eolian sand |
| Soil | Andosol | Dystric cambisol | Podzoluvisol | Podzol | Podzol |
| Vegetation | Fagus sylvatica L. | Quercus humilis Miller | Carpinus betulus L. & Quercus | Fagus sylvatica L. | Pinus pinaster Aiton |
| Q (m yr−1) | 0.6 | 0.4 | 0.125 | 0.275 | 0.35 |
| 1011 | 1507 | 210 | 815 | 600 | |
| BCuptake | 320 | 319 | 171 | 697 | 500 |
| BCweath | 2000 | 250 | 30 | 30 | 30 |
| Ni | 300 | 150 | 150 | 150 | 150 |
| Nuptake | 346 | 139 | 152 | 755 | 423 |
| BCdep + BCweath − BCuptake | 2691 | 1438 | 69 | 148 | 130 |
| – ANCle,crit [Al/BC] | 4994 | 2688 | 155 | 335 | 321 |
| CLmax(S) with ANCle,crit [Al/BC] | 7685 | 4126 | 224 | 483 | 451 |
| CLmax(N) with ANCle,crit [Al/BC] | 8331 | 4415 | 526 | 1388 | 1024 |
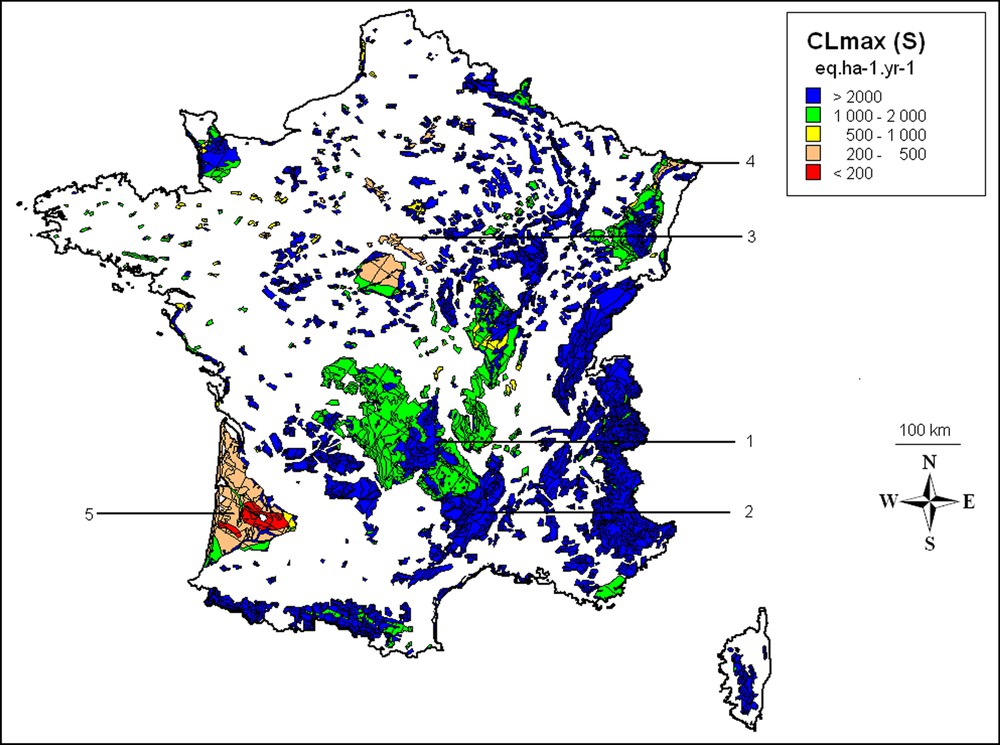
Critical loads of sulphur for French forest and grassland ecosystems. Location of the five selected sites.
Charges critiques de soufre pour les écosystèmes forestiers et prairiaux français. Localisation des cinq sites sélectionnés.
Le taux d'altération du sol est le premier indicateur du pouvoir tampon vis-à-vis de l'acidification. Selon les types de sol, l'altération produit 30 à 30 × 103 equiv ha−1 an−1. Les écosystèmes sur sols développés sur roches calcaires et volcaniques ont un pouvoir tampon élevé vis-à-vis de l'acidification (BCweath > 1500 equiv ha−1 an−1). Les autres écosystèmes (51,5 % de la surface étudiée) sont potentiellement sensibles à l'acidification. Les surfaces les plus sensibles (BCweath < 200 equiv ha−1 an−1) correspondent aux sables et grès acides (Tableau 1, sites 3, 4 et 5). Pour les granites (site 2), les schistes et les quartzites, BCweath est compris entre 200 et 500 equiv ha−1 an−1. Les formations détritiques ont des taux d'altération compris entre 500 et 1000 equiv⋅ha−1 an−1. Les dépôts atmosphériques de cations basiques nonmarins varient de 112 à 2181 equiv ha−1⋅an−1. Ils peuvent apporter un pouvoir tampon non négligeable sur des sols où l'altération est faible. Ce phénomène est important, au vu de nos résultats au sud du Massif central, dans les massifs cristallins des Alpes du Nord et sur les granites vosgiens. Les prélèvements par la végétation varient de 67 à 1222 equiv ha−1 an−1 pour les cations et de 57 à 1324 equiv ha−1 an−1 pour l'azote. De forts prélèvements de cations diminuent le pouvoir tampon du sol. Au contraire, les prélèvements d'azote diminuent l'impact acidifiant. BCuptake et Nuptake sont importants pour les espèces dominantes Pinus pinaster A., Picea excelsa L. pour les conifères, Fagus sylvatica L. ou le genre Quercus pour les feuillus. Les régions à forte productivité sont surtout le Sud-Ouest (côte atlantique), le Massif central et le Nord-Est de la France. L'influence du choix de l'espèce forestière n'est pas négligeable sur des sites sensibles à l'acidification.
Les charges critiques calculées sur les écosystèmes français mettent en évidence des zones considérées sensibles aux dépôts acidifiants de soufre et d'azote : Landes, schistes de Bretagne, Vendée et Normandie, formations détritiques en Sologne et Île-de-France, grès vosgiens, granites du Nord-Est du Massif central. Les zones de dépassement de charge critique sont déterminées par comparaison avec les données de dépôts atmosphériques acides [2]. Ces zones sont principalement : la côte atlantique (Landes et Pyrénées), les grès vosgiens et les schistes de Bretagne et de Normandie. Ce sont ces écosystèmes « sensibles », qui sont utilisés pour la modélisation dynamique de la réponse aux baisses de dépôts atmosphériques acidifiants.
1 Introduction
Between 1960 and 1980, long-range transboundary deposition of atmospheric acidifying pollutants (SO2, NOx, and NH3) has dramatically increased, following the rise of industrial activity, agriculture and traffic development in Europe. Since 1980, sulphur emissions have been reduced up to 70%, but nitrogen emissions are constant or slightly increasing [1,5]. Acid atmospheric deposition on soil induces the increase of [H+] and [Al3+] in soil solution and the leaching of base cations [19]. Toxicity of Al3+ at low pH is responsible for some ecosystem damage. In France, the effects of acidification on surface water [10,16] and forest [9,17] have been investigated since the 1980s, mainly in the Vosges Mountains and the Ardennes. Within the framework of the United Nations Economic Commission for Europe ‘Convention on Long-Range Transboundary Air Pollution’ (1979), 31 countries signed the 1999 Gothenburg protocol to reduce acidification and eutrophication by 2010. Since 1991, critical load maps are used as a basis for international negotiations on air pollution abatement strategies [6]. The critical load is “the quantitative estimate of an exposure to one or more pollutants below which significant harmful effects on specified sensitive elements of the environments do not occur according to the present knowledge” [11]. As a signatory country, France has provided critical load results to the European coordination centre database in 1995, 1999, and 2003 [13,14,18]. These data play an important part in the negotiation on pollutant emission reduction. Critical load input parameters were derived from a simplified ecosystem classification, which consisted of 31 types of forest ecosystems, and were mainly focused on the determination of weathering rates and acid neutralising capacity.
The present study aims at determining the ecosystem sensitivity against acid atmospheric deposition in metropolitan France. For this purpose, a new ecosystem classification was created from geological, pedological and vegetation parameters. Soil weathering rate, atmospheric deposition, and base-cation removal in vegetation are determined and their relative weight is discussed in the calculations of critical loads of sulphur and nitrogen.
2 Method
2.1 Critical-load calculation
Critical loads for sulphur (SO2) and nitrogen (NOx and NHx) are derived from a simplified steady-state mass balance (Eq. (1)) applied on the soil top-layer leachate flux [6]:
| (1) |
| (2) |
| (3) |
| (4) |
| (5) |
| (6) |
| (7) |
| (8) |
Subscript weath stands for weathering, le for leaching, *dep for total non-marine deposition, uptake for vegetation uptake, crit for critical. All fluxes are in equiv ha−1 yr−1. BC(base cations) = Mg2+ +Ca2+ + K++ Na2+; Mg2+ + Ca2+ + K+ + Na2+− Cl−. Nimm stands for nitrogen immobilisation.
2.1.1 Critical acid neutralising capacity determination
Two methods for critical ANCle,crit calculation are compared (Eq. (2)), assuming that HCO3,le and RCOOle can be neglected for forest soils [6]:
- (1) critical [H+] and [Al3+] in drainage water (Eq. (9)):
(9) - (2) critical ratio in drainage water (Eq. (10)):
(10)
The first method uses constant critical concentration of protons and aluminium and is essentially drainage-dependent. The second method takes into account the base-cation fluxes in soil solution, which decrease Al toxicity. In the present study, to integrate the ecosystem buffering capacity, the second method is used at the national scale.
2.1.2 Atmospheric non-marine deposition
Base-cation deposition, (Eq. (11)), has been determined at the national scale, using extrapolation of the RENECOFOR network data [2] on a 10 × 10 km grid. These deposition fluxes are determined from long-term bulk concentration measurements and interpolated long-term rainfall associated volumes. All relevant data have been sea-salt corrected, on the basis of the ratio between base cations and sodium, considering that Na deposition is 100% originating from sea salts (Eq. (12)). Marine cation deposition is not associated with an increase in buffering capacity, since their deposition is always accompanied with the strong acid anions Cl− and SO2−4 [4]. The concentration ratios in seawater used for sea-salt correction are: ; ; , and (g l−1/g l−1). Marine salinity is 35 g kg−1.
| (11) |
| (12) |
For forest ecosystems, total (wet + dry) deposition must be considered, because it represents a significant higher input to soils than the bulk ‘open-field’ deposition [16]. As a default value, throughfall deposition is considered as an estimation of total (wet + dry) deposition under forest cover. Since throughfall data are not available at the national scale [21], a coefficient is applied to the bulk deposition data from the RENECOFOR network, by calculating the ratio between bulk and throughfall deposition on long-term investigated sites [21]. This ratio depends on tree species and location of the site.
2.1.3 Base-cation and nitrogen vegetation uptake ( and )
Base-cation and nitrogen uptake (N and BCuptake) represent the net removal of elements by the vegetation (Eqs. (13) and (14)) on a long term. At the steady state, it is dependent on forest management. Because annual forest uptake data was not available, the method of the CCE guidance manual [6] was applied:
| (13) |
| (14) |
Biomassgrowth is determined using data on regional forest productivity and forest coverage [8]. [BC]biomass and [N]biomass is the natural content of base cations in the biomass, which depends on tree species [12,15].
2.1.4 Base-cation weathering rate
To approximate weathering fluxes, the PROFILE model [20] was applied on French soil conditions. It uses experimental kinetic laws to calculate mineral dissolution at the steady state, according to soil properties, in a multi-layer soil. Soil mineral composition was determined with normative calculations using the chemical composition of forest soils from the Vosges Mountains, the Ardennes and 12 sites from the RENECOFOR network, representative of the acid sensitive area [12]. From these results, a relationship between soil clay content and weathering rate was determined for the 20–40 cm horizon of these soils (Eq. (15)) [12]:
| (15) |
After calibration on 102 sites of the RENECOFOR network, weathering rates were thus extrapolated using the French soil clay content at the national scale [12].
2.1.5 Nitrogen immobilisation
Nitrogen immobilisation in the soils was set up for plain and mountain areas, respectively to 150 and 300 equiv ha−1 yr−1 [15], regarding French environmental conditions.
2.2 Ecosystem classification and choice of five representative sites
Existing ecosystem classifications, mainly based on vegetation data, are not adapted to critical-load calculation, which mostly depends on the soil buffering capacity [12]. To estimate critical loads, a new ecosystem classification, which combines soil, bedrock, and vegetation data must be defined at the national scale. The soil map, which represents 21 types of soils, was combined with the parent material map, composed of 31 types of bedrock, using a Geographic Information System [7,12]. Thirty-one combinations between soils and bedrocks were distinguished. A potential vegetation map (representing the steady-state long term vegetation cover), which is composed of 18 types of vegetation [12], is then overlaid with the soil-bedrock map. The resulting map is further combined with the current land use map. Forest polygons or polygons with more than 85% grassland, considered as ‘natural’ ecosystems, are finally kept. This new classification consists of 241 ecosystem types. The ‘natural ecosystem’ area represents 179 429 km2, i.e., 33% of the French territory. Among these types, in the present study, five different non-calcareous ecosystems were chosen to represent critical load calculation on French acid sensitive areas (Table 1). Site 1 presents high weathering and high non-marine base-cation atmospheric deposition. Site 2 is characterized by high non-marine base-cation deposition. Site 3 is characterized by low weathering rate, low drainage and low non-marine base-cation deposition. Site 4 exhibits low weathering rate, high non-marine base-cation deposition and high vegetation uptake. Site 5 is characterized by low weathering rate, high marine base-cation deposition, and high vegetation uptake.
3 Results and discussion
Results of the detailed calculation of critical loads for the five selected sites are described in Table 1. The critical loads for French forest and grassland ecosystem classification are presented in Fig. 1. According to the guidance manual [6], five sensitivity classes are defined: 0–200 equiv ha−1 yr−1; 200–500 equiv ha−1 yr−1; 500–1000 equiv ha−1 yr−1; 1000–2000 equiv ha−1 yr−1, and the less sensitive, class 5, is > 2000 equiv ha−1 yr−1.
3.1 Weathering rates (, Eq. (7))
For French soils, BCweath ranges between 30 and 30 ×103 equiv ha−1 yr−1. For calcareous ecosystems (46% of forests and grasslands), BCweath exceeds 2000 equiv ha−1 yr−1, because of the high percentage of calcium carbonate in soils. With such a natural buffering capacity, these sites are not sensitive to acidification. Volcanic soils developed on basalt (Table 1, site 1), granodiorite, gabbro or diorite (2.5% of the studied area) present also high weathering rates (1500–2000 equiv ha−1 yr−1). The presence of apatite (> 1%), of volcanic glasses, and the high percent of anorthite (> 25%) in the volcanic soils explain their efficient buffering capacity against acidification. The other ecosystems are more sensitive to acidification: 51.5% of the French forests and grasslands, i.e., 92 405 km2. The most sensitive ecosystems (BCweath < 200 equiv ha−1 yr−1) are located on acid sands, Tertiary sands and sandstone (Table 1, sites 3, 4, and 5), with a high percentage of unweathered minerals (80–95% of quartz). BCweath ranges between 200 and 500 equiv ha−1 yr−1 on granite (Table 1, site 2), schists or quartzites. High concentrations of orthose (K-feldspar), Na or Ca plagioclases, and traces of other minerals (such as apatite) slightly increase the base-cation weathering rate. Detrital formations in the central part of France present intermediate weathering rate (500–1000 equiv ha−1 yr−1). BCweath is the first indicator of soil buffering capacity against acidification in the long term.
3.2 Base-cation atmospheric deposition (, Eq. (7))
For French ecosystems, ranges between 112 equiv ha−1 yr−1 and 2181 equiv ha−1 yr−1. In the hard acid sedimentary and metamorphic rocks of the Alps, the granite of the Massif Central (Table 1, site 2) and the Vosges Mountains (Table 1, site 4), atmospheric deposition represents more than 80% of the base-cation input in the mass balance. In the Vosges mountains, (800–1500 equiv ha−1 yr−1) mostly originates long-range transport of emissions from the nearby industrial areas in France and Germany. In these areas, the increase of sulphur deposition is often accompanied with an increase of base-cation deposition, which contributes to the soil buffering capacity [17]. In the southern part of the Massif Central and the Alp mountains, Ca is supposed to originate the calcareous dust from the close Mediterranean ecosystems and the high Ca concentrations in the Saharan air masses [2]. In the central part of France (Table 1, site 3), low atmospheric base-cation deposition does not increase the buffering capacity of poor weathered soils.
3.3 Vegetation uptake (, Eq. (7))
BCuptake ranges between 67 and 1222 equiv ha−1⋅yr−1. Nuptake ranges between 57 and 1324 equiv ha−1⋅yr−1. High removal of base cations and nitrogen (Table 1, site 4 and 5) has to do with the important biomass productivity of beech forests (Fagus sylvatica L.) in northeastern France and pine forests (Pinus pinaster Aiton) in the coastal Atlantic area. At the national scale, species associated with high BCuptake are Pinus pinaster Aiton, Picea excelsa L. (for coniferous), Fagus sylvatica L. and the Quercus genus (for deciduous trees). On the opposite, grasslands, marshes, and other non-forest areas exhibit low productivity. It is important to notice that, in the long-term, the flux of element uptake must only be considered for harvested forests. On the other sites, at steady state, uptake by vegetation tends towards zero, i.e. uptake theoretically equals deposition by inner forest cycle. The influence of tree species and forest management on ecosystem sensitivity to acidification is therefore not negligible on acid sensitive sites.
3.4 French critical load map (Fig. 1)
The most sensitive areas to S deposition (CLmax(S) < 1000 equiv ha−1 yr−1) are located in the Landes forest and marshes, schists of Brittany and Normandy, detrital formations and Tertiary sands in Centre-North of France, sandstone in the Vosges mountains and granite in the Northeast of the Massif Central. The areas where critical loads are rather low (1000 < CLmax(S) < 2000 equiv ha−1 yr−1) are located in the granitic region of the Massif Central and the Vosges mountains, in the metamorphic bedrocks of the Alps and the Pyrenees. The critical load of the nitrogen map [18] reflects the same sensitive areas, mainly in the Landes forest, in Brittany, in the Centre-North of France and in the Vosges Mountains. The Massif Central, the Ardennes, and the Vosges Mountains are less sensitive to acid deposition by comparison with the previous maps of critical loads [13,14], because the high non-marine atmospheric deposition of base cations has been taken into account. On the other hand, the maritime area is now more sensitive, because atmospheric inputs are mostly originating marine salts.
3.5 Exceedances
The current open-field deposition of sulphur () in France ranges between 200 and 750 equiv ha−1 yr−1 [2]. As already explained, throughfall base-cation deposition data were used for critical load calculation. In the same way, to calculate the exceedances of critical loads, throughfall S deposition data should ideally be considered. Nevertheless, because these data are lacking, no throughfall deposition map can be used. Thus, as a first approximation, the difference between current sulphur open-field deposition and critical load of sulphur can be reasonably calculated. The highest exceedances are estimated for the Atlantic coast (Landes and Atlantic Pyrenees), the sandstones in the Vosges Mountains, the schist of Brittany and Normandy. Other areas, where exceedances may occur are granite in the North of the Massif Central (Limousin and Beaujolais), and in the Vosges mountains. However, one must keep in mind that these data must be considered as the minima exceedances, since the considered sulphur deposition is underestimated.
4 Conclusion
A new French ecosystem classification was set up to calculate critical loads. It reflects the large diversity of French soils, bedrock types, and vegetation. Two hundred and forty-one ecosystem types have been defined for the French territory.
Critical load values were calculated by taking into account the base cations fluxes for critical limit calculation in leachate water. Weathering rate controls the soil-buffering capacity against acidification. Soils with high weathering rate, developed on calcareous or volcanic rocks, are protected against acidification. On the other hand, poor weathered soils are the most sensitive to acidification: sandstones in the Vosges Mountains, aeolian sands in the Landes of Gascogne, acid granite and schist in Brittany, Vendée, and Normandy, detrital formations and Tertiary sands in the central part of France. Nevertheless, one important result of this study is that the high atmospheric deposition of non-marine cations on sensitive areas increases the ecosystem-buffering capacity. In the Vosges Mountains, the crystalline part of the Alp Mountains and the Southeast of the Massif Central, base-cation atmospheric deposition produces 80% of the total input of base cations to the soil.
Nowadays, atmospheric deposition of sulphur is decreasing, while nitrogen deposition is rather constant. Areas where acid deposition exceeds or has exceeded critical load will begin to recover. Nevertheless, non-marine base-cation atmospheric deposition, which originates pollution, will also reduce along with the sites buffering capacity. On these sites, the recovery time will thus depend on the ecosystem properties (soil, bedrock, vegetation, climate), but also on the atmospheric deposition trends. The next step of this study will therefore be a dynamic modelling [18] to predict recovery times for acidified ecosystems, taking all the fluxes into account.
Acknowledgments
The authors particularly thank the ADEME (‘Agence de l'environnement et de la maîtrise de l’énergie', France) for supporting our works and the RENECOFOR/ONF Staff for providing open-field atmospheric deposition data.