

1 Introduction
The Australian plate is subducting under the Pacific plate at the Vanuatu trench since the Middle Miocene [4]. This plate presents a series of parallel submarine ridges (Fig. 1) including the main island of New Caledonia, and the Loyalty ridge. Cluzel et al. [7] propose that the latter could represent a volcanic arc active before the obduction of ophiolithes onto New Caledonia. It includes a series of Oligocene volcanic seamounts and guyots [20] and four uplifted islands, Ouvéa, Lifou, Maré and Walpole, from northwest to southeast. These islands are thought to be of volcanic origin, but the nature of their basement is still unknown [20], although one outcrop of alkaline Miocene basalt is reported in the middle of Maré [1,18]. The four islands are topped with coral and lagoon-type limestone formations developed during the subsidence of the underlying volcanoes. Coral formations stricto-sensu form cliffs and terraces at the border of the islands, while their inner part consists of non-cohesive lagoon-type biomicrites [5,18]. Walpole is thought to be only a remnant of a larger atoll.
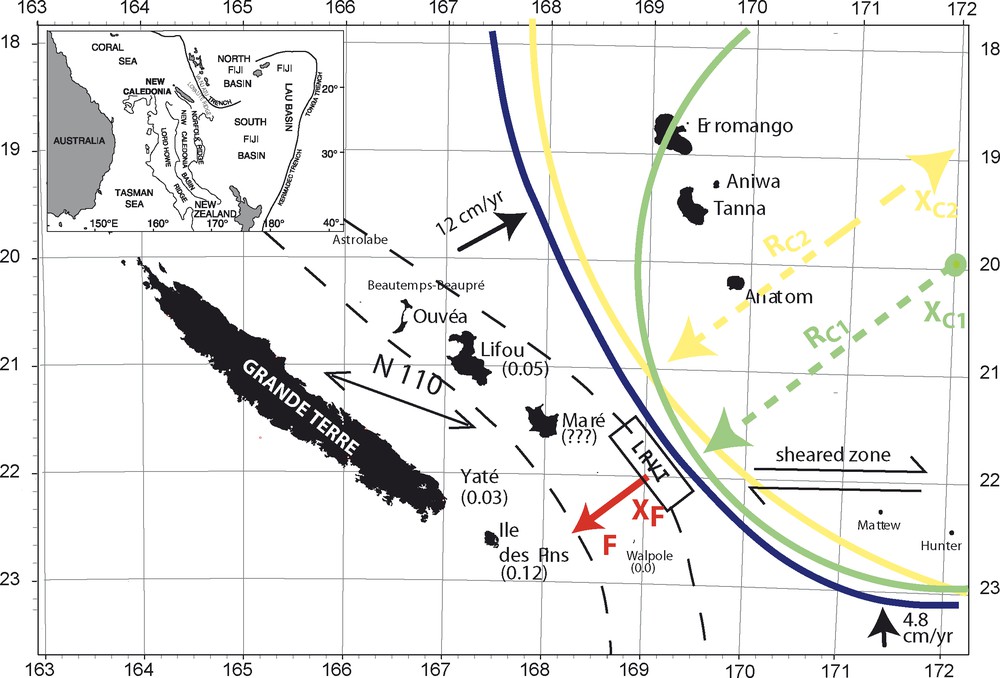
General geological setting. Tectonic setting (main figure) and localization of the study area (inset). The long dashed lines define the extension of the Loyalty ridge. The axis of the Vanuatu trench is in blue. The convergence rates along the trench are indicated by the heavy arrows (after Calmant et al., [3]). The mean N110 orientation (equivalent to ) recorded in the Loyalty Islands is also displayed. The present-day uplift rates are indicated between parentheses (in mm/yr); they are not known in Maré. The box labelled LRVT is the area of the begining collision between the Loyalty ridge and the Vanuatu trench (Monzier et al., [20]). The two circles and used to fit the trench shape are indicated in green and yellow, respectively. The positions of their centers ( and ) and their radii ( and ) are also indicated. The localized force used to model the collision is displayed in red.
Fig. 1. Contexte géologigue général. Contexte tectonique (figure principale) et localisation de la zone d’étude (en insertion). Les pointillés longs définissent l’extension de la ride des Loyauté. L’axe de la fosse des Vanuatu est en bleu. Les taux de convergence le long de la fosse sont indiqués par les flèches épaisses (d’après Calmant et al., [3]). L’orientation moyenne N110 (équivalente à ) mesurée dans les îles Loyauté est également représentée. Les taux de soulèvement actuels en mm/an sont indiqués entre parenthèses ; ils ne pas connus pour Maré. La boîte notée LRVT est la zone de collision commençant entre la ride des Loyauté et la fosse des Vanuatu (Monzier at al., [20]). Les deux cercles et utilisés pour schématiser la fosse sont indiqués en vert et en jaune. Les positions de leurs centres ( et ) et leurs rayons ( et ) sont également indiqués. La force ponctuelle utilisée pour modéliser la collision est représentée en rouge.
These islands are uplifted to an approximately 130-m altitude during their motion toward the Vanuatu trench. This has been interpreted by Dubois et al. [9,10] as the result of their advance on the elastic bulge developing on the Australian subducting plate before its bending toward the Vanuatu trench. Ouvéa is uplifted at a 40-m altitude in its western part, while its eastern part is still an atoll at sea level. The top of the elastic bulge is located between Lifou and Maré, which culminate at 100 m and 130 m, respectively, while Walpole lies at a 70-m altitude on the trenchward flank of the bulge.
Convergence along the Vanuatu subduction zone is constrained by focal mechanisms of earthquakes and by GPS measurements between the islands of Vanuatu, the Loyalty Islands and the Grande Terre, which is the main island of New Caledonia [3,21]. The convergence rate is 12 cm/yr northward of Ouvéa, Lifou and Maré, and only 4.8 cm/yr along the southern arc. The change of convergence style occurs 100 km southeast of Maré, at the S latitude and is associated in the back-arc with the westward motion of the Mattews-Hunter block (Fig. 1) marked by a senestrial strike-slip seismicity [17]. The deformation recorded in the marine sediments of the back-arc led Monzier et al. [20] to propose that the collision between the Vanuatu arc and the Loyalty ridge occurred 300 000 yr ago.
Measurements of the fissure networks developed inside the limestone material of these islands were one of the topics of the SAGE project (2002–2005) devoted to an assessment of the water management policy in the Loyalty Islands [16]. This project was funded by the New Caledonian Province of Loyalty Islands (PLI), the University of New Caledonia (UNC) and IRD. A fracturation study has been undertaken in Lifou, Ouvéa and Maré Islands, based on teledetection and field studies [13]. As fissures, faults or joints can hardly be observed in the inner part of the islands, since they are largely covered by forests and due to the non-cohesive nature of their superficial layer, this work provides a unique opportunity to compare linear structures deduced from teledetection with the tectonics and geodynamics of this active region.
It is now currently admitted [23] that the oceanic lithosphere can be modeled as an elastic beam (or plate) on which seamounts and subduction zones are acting as loads. This model has been extended by including plasticity (e.g., [19]) and the earth sphericity (e.g., [12]). Thus, the present work will use the fissure network deduced from teledetection to constrain the mechanical state of the Australian lithosphere, assuming that it behaves as a thin elastic plate submitted to various loads and forces.
This article is organized as follows. The data gathered from aerial, satellite and field trips are first presented and analyzed. Then, an elastic 3D model around a circular trench accounting for the curvature of the trench is derived. It includes a vertical deflection under loads distributed along the trench axis and a localized force, corresponding to the ongoing collision of the Loyalty ridge with the Vanuatu subduction zone. Finally, the resulting stress distributions are compared to the fracture data observed in the Loyalty Islands.
2 Field data
The fracturation study involved interpretation of SPOT3 and SPOT4 images, of ENVISAT radar images [13] and of aerial photographs available at the Direction de la topographie et des transports terrestres (DI3T) of New Caledonia, which provide a coverage of the islands on a scale of approximately 1/10 000. An extensive field campaign in 2002 and numerous shorter field trips during our hydrological measurement campaigns in Lifou allowed us to check that the lineaments present on the various images were also observed at the outcrop on the coral formations bordering the islands.
However, due to the extensive dissolution of fracture walls induced by rainwater in the tropical climate, fault slip measurements were impossible. Moreover, displacement observations on coral terraces may be misleading, due to the numerous collapses of caves formed by mixing corrosion near the coast [24] and possible reworking of rock blocks by hurricanes. Due to the dense vegetal cover inside the islands, fractures are hardly observed except inside quarries, where the lagoon-type biomicrite, extensively dissolved, recristallized and partly dolomitized generally presents a non-cohesive facies [18]. Hence, fractures or discontinuities can be hardly observed in the inner part of the island.
Owing to the great difficulty of observing fractures and fracture displacements in these islands, it was concluded that it was better to work only with the lineaments observed by teledetection. These lineaments were termed as fractures, altough they may represent joints, faults or any kind of linear structure. Preliminary and final versions of the fracture maps have been published by Maurizot and Lafoy [18] and Huaman [13], respectively.
In the original maps, each fracture was replaced by the segment joining its two extremities, and the segment orientations were measured in degrees with the standard trigonometric convention (Fig. 2 a). Orientation histograms in length of these maps were built (Fig. 2b).
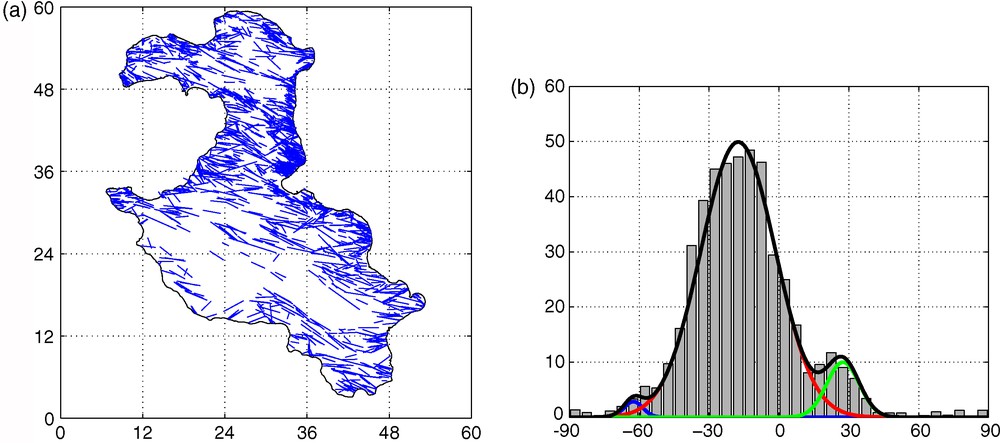
Fracture map in the Lifou island: (a) each recorded fracture is represented by an end-to-end segment; (b) decomposition of the length-weighted orientation histogram.
Fig. 2. Carte de fracturation dans l’île de Lifou : (a) chaque fracture est représentée par le segment qui joint ses extrémités ; (b) décomposition de l’histogramme des orientations, pondéré en longueur.
Because of the presence of two local maxima around the main one (Fig. 2), the fractures were decomposed into three families F1, F2 and F3 fitted by Gaussian distributions:
| (1) |
The fracture density expressed in meter of fracture traces per square kilometer and per degree, the average angle and the standard deviation for the three families F1, F2 and F3, and the three islands
Tableau 1 Densité ki, exprimée en mètre, de traces de fracture par kilomètre carré et par degré, angle moyen mi et écart-type si pour les trois familles F1, F2 et F3, et pour les trois îles. Les trois dernières lignes correspondent aux moyennes générales
| Parameters | () | () | |
| Ouvéa | |||
| F1 | 7.0 | −60 | 6 |
| F2 | 47.7 | −15 | 19 |
| F3 | 20.1 | 8 | |
| Lifou | |||
| F1 | 2.9 | −62.5 | 4 |
| F2 | 49.9 | −17.5 | 16 |
| F3 | 10.0 | 7 | |
| Maré | |||
| F1 | 4.9 | −65 | 6 |
| F2 | 51.7 | −20 | 17 |
| F3 | 15.0 | 10 | |
| Average | |||
| F1 | 4.0 | −64 | 6 |
| F2 | 50.4 | −19 | 16.5 |
| F3 | 12.4 | 8 |
The same analysis was performed for Maré and Ouvéa with similar overall results (Table 1). varies slightly, since it is equal to , and for Ouvéa, Lifou and Maré, respectively. The values of remain of the same order of magnitude, since the orientations are distributed in a rather symmetric way around the mean orientation within an angle of . Even the intensities of fracturation for the three families, quantified by in (1), are remarkably stable. The overall average direction is equal to .
However, the length histogram of Ouvéa is qualitatively different from that of Fig. 2 b; roughly speaking, the orientations are uniformly distributed between and with a superposed peak at .
The fracture orientations deduced from this analysis should be compared to those usually recorded in this region. Lagabrielle et al. [15], and Chardon and Chevillotte [6] compiled previous tectonic studies on Grande Terre and its region; Lafoy et al. [14] and Flamand et al. [11] studied submarine deformation. The first obvious discontinuity direction is that of the Loyalty ridge (), which is also recorded as an extensive fault direction along Grande Terre, and does not fit any of the observed fracture orientations. However, the direction corresponds well to that of the trench in the area and is recorded as a secondary fracture orientation in Grande Terre. Lafoy et al. [14] reported a WSW–ENE trend in the submarine Loyalty ridge interpreted as a recent left lateral strike-slip motion, which could be similar to our orientation. The direction was recorded as an extensional one by Flamand et al. [11] in the submarine terraces bordering the Caledonian lagoon.
The present state of stress in the area is known from focal mechanisms of earthquakes which are mainly located in the bending zone of the Australian plate. As expected on a bending plate, these mechanisms are extensive with the principal extension axis pointing toward the trench [17,21]. The Loyalty Islands are largely aseismic except for the surroundings of Walpole, near the collision zone, where several seismic swarms, reaching , have been recorded and for which no focal mechanism has been published so far [22]. Thus, the major fracture orientation of the Loyalty Islands () cannot be considered as an ubiquitous discontinuity direction for the region. This leads us to compare the results of some elastic beam models with these fracture patterns.
The tectonic situation can be simplified as follows. The Loyalty Islands are located in the immediate neighbourhood of a subduction zone which can be approximated by circles (Fig. 1). Moreover, the relative velocity between the two plates almost vanishes at the latitude S. This suggests that the first stages of the collision between the Loyalty ridge and the Vanuatu trench zone (LRVT in Fig. 1) induce a stress distribution that is modeled here as a single force. This force represents the integration ot the stress distribution over the whole LRVT zone. It is assumed to be applied at the middle of the LRVT zone, at S, E. The cases of a radial (perpendicular to the trench axis) and of an east–west force are considered. The radial force corresponds to the assumption that no shear stress can be transmitted at the trench, while the east–west force corresponds to the strike slip decoupling motion inferred in the back-arc domain by Monzier et al. [20] and Lafoy et al. [14] (see Fig. 1).
This simplified image of the real situation is illustrated by Fig. 1. The Vanuatu subduction zone is replaced by a circle of center and radius . The Australian and the Pacific plates correspond to the regions outside and inside this circle, respectively. The stresses due to this particular situation are caused partly by the vertical deflection of the elastic Australian plate at the Vanuatu subduction zone, and partly because of the force .
3 Theory
Basically, the theoretical model considers an elastic thin plate submitted to a load at the subduction zone schematized by a circle and to an horizontal force caused by the collision between the Loyalty ridge and the Vanuatu trench zone.
3.1 Deformation of a lithospheric plate surrounding a circular ocean
Consider the vertical deflection W of a lithospheric plate of thickness h under a vertical load which surrounds a circular hole of radius as depicted in Fig. 1. The load can be decomposed into the weight of the plate (where is the density of the plate and g the acceleration of gravity) and the hydrostatic force exerted by water, whose density is . This generalizes the one-dimensional calculations given by Turcotte and Schubert [23]. The characteristic length is called the flexural parameter:
| (2) |
Let us introduce the dimensionless lengths r and :
| (3) |
| (4) |
| (5) |
| (6) |
The stresses at the upper surface of the plate can be derived from this solution and made dimensionless by the characteristic stress :
| (7) |
3.2 Deformation of a lithospheric plate under an horizontal localized force
Consider now a localized horizontal force applied onto the plate along a vertical segment of two-dimensional coordinates as illustrated in Fig. 1. Let be the force exerted per unit length. It is more convenient to introduce other units of length , and force . The stresses verify:
| (8) |
3.3 Superposition of the two solutions
When the deflection and the point force are superposed, the dimensionless resulting stress can be defined as:
| (9a) |
| (9b) |
4 Comparison with fracturation data
4.1 Altitudes of the Loyalty Islands
The Vanuatu subduction zone (Fig. 1) can be approximated by a circle in two opposite ways. The circle approximates the southern part of the zone and it does not represent well the northern part of the zone. provides an approximation to the whole subduction zone, but it is much less precise south of S. These two circles are characterized by the longitude and latitude of their center, and by their radius, namely ( E, S; km) and ( E, S; km).
Systematic applications of (6) were made with C1, C2 and km. The main physical parameters are: Pa, , kg m−3, kg m−3. The local force is not taken into account. For a given value of , is chosen in order to minimize the norm of the difference between W and the observed altitudes of the four Loyalty Islands taken from Dubois et al. [10].
Fig. 3 shows that for C2 the elevations of the four islands can be virtually fitted by any of the elastic profiles. Since the reef westwards of Beautemps Beaupré does not show any uplift, a value of ranging between 50 and 70 km should be adopted for C2. Basically, the same conclusions hold for C1, which is not shown here. These values are very similar to the one found by Dubois et al. [10], i.e. km, which corresponds to an elastic thickness of 22 km. According to these authors, this elastic thickness is lower than the 28-km thickness expected for the 50-Myr age of the oceanic lithosphere deduced from magnetic anomalies, but is consistent with a thermal age of 25 Myr deduced from the mean depth of the Loyalty basin. Burov and Diament [2], using a larger data set, showed in their Fig. 1 that the elastic thickness of a 50-Myr-old oceanic lithosphere should be around 34 km, when deduced from deformations at trenches or at fracture zones only, i.e., if seamounts possibly associated with thermal effects are discarded. A 25-Myr oceanic lithosphere is generally too young to enter in subduction and, therefore, there is no trench data for its elastic thickness. These remarks reinforce the hypotheses of Dubois et al. [10] that the Loyalty basin lithosphere has been rejuvenated by the thermal events associated with the emplacement of the Loyalty ridge seamounts.

The dimensional altitude of the Loyalty Islands as a function of the distance to the center of the circle . is equal to: 50 (dash-dot), 70 (solid), 100 (broken), 140 (dotted). The dots correspond to the four Loyalty Islands: from left to right: Beautemps Beaupré, Ouvéa, Lifou and Maré.
Fig. 3. Altitude (m) des îles Loyauté en fonction de la distance au centre du cercle . est égal à 50 (trait mixte), 70 (trait continu), 100 (trait brisé), 140 (trait pointillé). Les symboles correspondent aux quatre îles Loyauté ; de gauche à droite : Beautemps Beaupré, Ouvéa, Lifou et Maré.
4.2 Stress intensities and orientations
The values of the maximal compression and extension denoted by and , respectively, were calculated by superposing the two elementary solutions. In addition to the previous parameters, the force orientation and its intensity (i.e., ) were systematically studied. The force was chosen to be either radial or east–west. plays the role of an adjustable parameter in order to orient the direction of perpendicular to the average fracture direction .
When comparing modeled stresses and actual fracture sets observed in the islands, it should be kept in mind that: (i) at the outrop, these discontinuities appear as craks or joints with centimetric or no offset; and (ii) superficial (low confining pressure) deformation only is observed, since the thickness of the limestones may be estimated at less than 200 m. Therefore, crack opening is assumed to occur under tension only, as it is well suited to near surface deformation. This implies that fractures are parallel to the compression direction in Fig. 4.
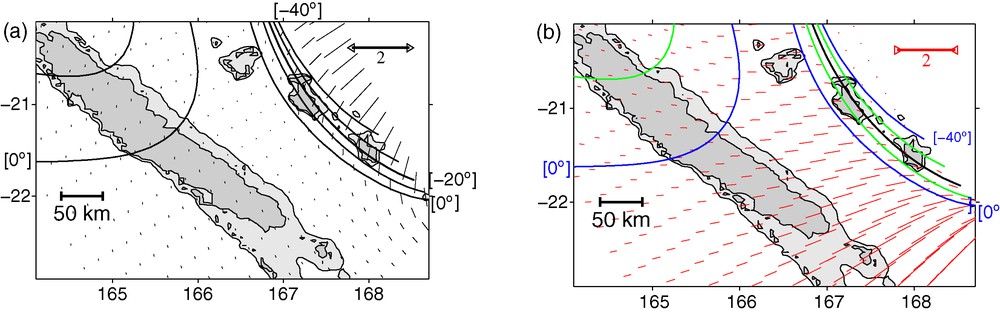
The maximal extension (a) and compression (b) for the superposed fields for the circle . The data are the principal components of the dimensionless stress tensor in (9a), for a radial force, applied at ( E, S). Data are for km, km, km, . The lines correspond to isodirections of the perpendicular to the largest extension (i.e., parallel to the fracturation): . The thick black line (in b) corresponds to which is close to the average found for the three Loyalty Islands. The stress scale is indicated by the bar in the top-right corners; 1 corresponds to 68 MPa.
Fig. 4. Extension maximale (a) et compression maximale (b) pour les champs superposés pour le cercle . Les résultats sont les composantes principales du tenseur des contraintes adimensionnel dans (9a), pour une force radiale appliquée en ( E, S). Les résultats correspondent à km, km, km, . Les lignes correspondent aux isodirections de la perpendiculaire à l’extension maximale (c’est-à-dire parallèle à la fracturation): . La ligne noire épaisse (en b) correspond à , ce qui est proche de la moyenne obtenue pour les trois îles Loyauté. L’échelle des contraintes est indiquée par la barre dans les coins supérieurs droits ; 1 correspond à 68 MPa.
The systematic results can be summarized as follows. For , the influence of and of the direction of on the directions and intensities of the stresses is weak. Moreover, the stress directions hardly vary over the islands and this would imply a very well defined fracture direction.
Another possible criterion is the relative intensity of and . In order that rupture occurs preferentially perpendicular to the extensive stress, should be comparable to . This is generally not true for C1.
The results for C2 are very different. The influence of on the directions and intensities of the stresses is strong for a radial force and much weaker for an east–west force. The influence of the direction of the force is stronger for km than for 70 km. These stronger influences are probably due to the fact that is closer to the islands than .
A remarkable combination of parameters was found for C2 and it is displayed in Fig. 4, where the unit for the dimensionless stresses is 68 MPa. is perpendicular to over Maré and Lifou and the angle variations over these islands are very large when compared to those obtained for the other combinations of parameters. This is in good agreement with the observed orientations in these two islands which are mostly ranging between and (Fig. 2). Moreover, is of the order of .
Because of its linear shape, Ouvéa is a special case and Fig. 4 a predicts that the fractures should be oriented east–west, i.e., with an angle equal to 0. It is interesting to recall that the Ouvéa length histogram presents an almost uniform distribution between and with a peak at . However, is significantly larger than over Ouvéa.
Moreover, the small drift of the average fracture direction between the three islands, which goes from to from Ouvéa to Maré, can be easily accounted for by the respective situation of these islands with respect to the isodirections of the stresses.
A last important remark is that before the collision of the Loyalty ridge started, Lifou and Maré should have been shifted westward by about 30 km. They were only submitted to the stress regime induced by the subduction of the Australian lithosphere. This should have induced an extensive stress regime associated with the aperture of joints directed parallel to the subduction zone, i.e., nearly , which corresponds to one of the minor lobes of the fracture distributions (see Table 1).
5 Concluding remarks
A partially analytical study has been carried out in order to relate the fracturation observed on the Loyalty Islands to the deformation of the Australian lithosphere due to its subduction. A novel solution is given to subduction around a circular plate in terms of Bessel functions. A classical point force solution is superposed to it.
The altitudes of the Loyalty Islands and the observed fracture orientations are in agreement with the solution presented here. Moreover, the order of magnitude of stress intensities are in the range of acceptable values. Finally, this solution implies a large dispersion of fracture orientations which is indeed observed and which could be hardly accounted by with a single tectonic phase with well-defined stress orientations. Indeed, the model presented here may not be the unique solution to explain the fracture distribution observed in the Loyalty Islands. In particular, if the orientation is a major anisotropy direction of the basement of the islands, it may be reactivated by a large class of tectonic events. Until now, this direction has never been proposed for the Loyalty ridge, although it is known as a recent tectonic direction in Grande Terre [11]. The model is consistent with the thin elastic plate theory currently admitted for the oceanic lithosphere and it is able to reproduce the observations. This model does not require any refinement of the rheological profile of the lithosphere. However, a good fit of the fracturation data cannot be obtained without a force describing the interaction between the Loyalty ridge and the Vanuatu trench. This implies that the collision involves the whole lithosphere thickness and is not restricted to the superficial sediment layer.
In the future, the stress orientations computed from this model will be compared with the drainage directions in the karstified Loyalty Islands. In addition, stress intensities could help to assess seismic hazards. This would probably require a numerical study which would take into account the real shape of the subduction zone.
Acknowledgments
Most computations were performed at CINES (subsidized by the MENESR). This work was also partly supported by PNRH, which is gratefully acknowledged. Dominique Cluzel is also thanked for his participation in the field work and for valuable discussions.