

1 Introduction
Gravity measurements are used for two types of applications: measurements of the static gravity field, mainly for gravity anomaly mapping (Masson et al., 1999), and measurements of the time variable gravity field with time-lapse or continuous measurements. In the past, measurements of the time variable gravity field were mainly dedicated to large-scale geophysical studies such as global geodynamics (Rosat and Lambert, 2009), postglacial rebound (Mémin et al., 2011) or mechanical characteristics of the Earth and the study of tides (Llubes et al., 2008). These measurements required superconducting gravimeters. These high precision relative gravimeters are generally installed in permanent observatories and are not transportable. Some studies dedicated to volcanic processes (Ballu et al., 2003; Bonvalot et al., 2008) and tectonic deformation (Francis et al., 2004; Mouyen et al., 2009; Van Camp et al., 2011) used less precise absolute and/or relative gravimeters designed for fieldwork. Until recently, all of these studies were considered as polluted by the hydrological signal, which varies significantly from one season to the next (variations can reach several tenths of μgals), even if the interest of hydrological contribution in gravity time series to hydrology studies has been highlighted as early as 1977 (Lambert and Beaumont, 1977; Longuevergne et al., 2009). Mainly due to the increasing quality of field instruments that now have precisions higher than 5 μgal, this point of view has been recently reversed. Roughly, storage changes equivalent to a 10 cm full water layer is equivalent to 4 μgal, which is measurable by available field instruments. Now, it is generally believed that gravity data can add valuable information to hydrology studies (Becker et al., 2010; Llovel et al., 2010; Longuevergne et al., 2010; Naujoks et al., 2007). Time-lapse microgravity surveys dedicated to hydrological studies are however few. They have been mainly performed in the a priori more favorable context of relatively flat topography and sparse vegetation, as illustrated by the projects carried out in recent years on the Larzac plateau (Jacob et al., 2010) and in the Sahel (Pfeffer et al., 2011). On the Larzac plateau, Jacob et al. (2010) combined time-lapse microgravity surveying with absolute gravity measurements to investigate water storage changes in a karst aquifer of a 100 km2 area. High and low gravity amplitude zones characterize the karst system, demonstrating spatially variable storage behaviour. Geomorphologic considerations are invoked to explain the location of the preferential zones of water storage. In the Sahel, using absolute gravity measurements, Pfeffer et al. (2011) modeled the effect of the local water storage changes using in situ measurements of the water table, soil moisture and pondwater level. The adjustment of these observations to residual ground gravity helped to constrain the specific yield of the aquifer.
The aim of the present study is to evaluate the potential of time-lapse microgravity surveying to detect a relevant hydrological signal in gravity data in the much less favorable context of a mountainous watershed covered by forests and to understand and discuss the new information that the gravity data can provide about the behaviour of such a catchment. This study is focused on the Strengbach catchment in the French Vosges Mountains.
2 The Strengbach catchment
The small (0.8 km2) Strengbach forested catchment area is located on the eastern side of the Vosges massif in northeastern France (Fig. 1). It was established in 1986 for assessing the effects of acid rain on a forested ecosystem (Dambrine et al., 1998; El Gh’mari, 1995; Probst et al., 1990, 1995). It is now an experimental basin recognized as observatory (Hydro-Geochemical Observatory of the Environment, http://ohge.u-strabg.fr), and, in the past 10 years, it has been largely involved in the study and characterization of hydro-geochemical mechanisms in forested ecosystems, especially by using the geochemistry of major and trace elements, as well as various isotopic systems (B, Ca, Li, Sr, Nd, Pb, U-Th) (Aubert et al., 2002; Cenki-Tok et al., 2009; Chabaux et al., 2005; Cividini et al., 2010; Lemarchand et al., 2010; Rihs et al., 2011; Riotte and Chabaux, 1999; Stille et al., 2006; Viville et al., 2012).
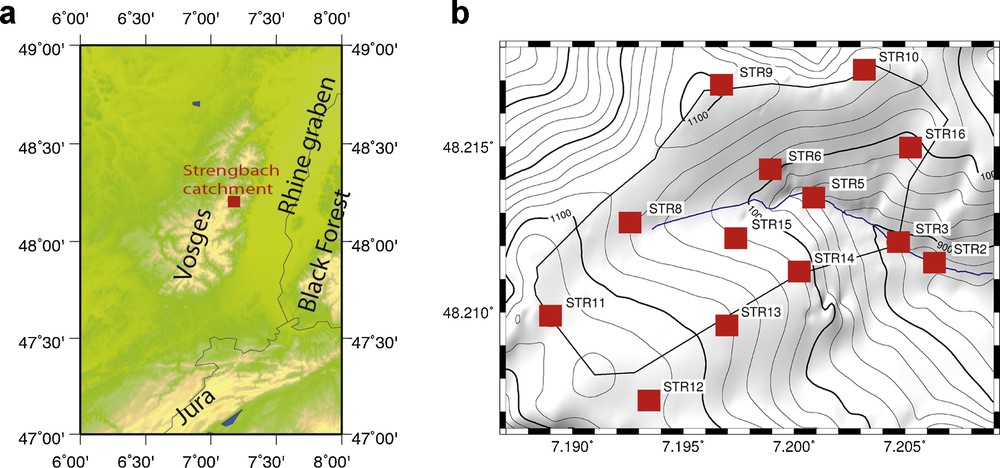
a: location of the Strengbach catchment; b: Strengbach catchment topography and gravity measurement locations.
a : localisation du bassin versant du Strengbach ; b : topographie du bassin versant du Strengbach et position des points de mesure.
The topography of the Strengbach catchment ranges from 883 to 1146 m above sea level (Probst et al., 1990). The mean slope of the catchment is 15°. In most of the catchment, up to 1 m thick acidic soils overly a < 10 m thick saprolite and a Ca-poor granitic Hercynian bedrock (322 ± 2 Ma (Boutin et al., 1995)). The bedrock underwent an increasing grade of hydrothermal alteration 180 Ma ago (Fichter et al., 1998) from the northern part of the watershed to the southern part. Soils are acidic, coarse-textured and composed generally of approximately 60% sand, with two main soil types in the watershed: brown acidic soils on the south-facing slope where the granite has undergone the more intense hydrothermal alteration and ochreous podzolic soils on the north-facing slope where the granite is less affected by the hydrothermal weathering (Fichter et al., 1998). The thickness of the granitic saprolite varies between 1 and 9 m, with generally greater thicknesses on the southern slope (El Gh’Mari, 1995). Norwegian spruce covers approximately 65% of the catchment area, with mixed beech (mainly located on the southern slope) and silver fir taking up the rest. A small area of banded gneiss occupies the northern ridge. In summary, at first sight the Strengbach catchment can be considered a relatively homogeneous watershed in terms of bedrock, soil and vegetation cover; however, upon closer examination, the watershed is marked by systematic differences in its geological, soil and vegetation characteristics between its northern and southern parts.
The Strengbach catchment is marked by a temperate oceanic-mountainous climate. The mean annual precipitation is 1360 mm (range 896–1713 mm) spread evenly throughout the year. However, the precipitation is not homogeneous but is distributed along a SW-NE gradient. The southwestern and the northeastern zones of the catchment collect ∼10% more and ∼10% less, respectively, than the mean catchment value (Viville and Ambroise, 1994). The mean annual runoff is 814 mm (range 525–1147 mm) with high flow in the cold season and lowest water levels at the end of the summer. The evaporation is most likely also variable from one slope to the other. Effectively, the vegetation cover and the sunshine radiation of the two slopes are different. Spruces mainly cover the northern slope, while beeches cover the southern slope. The development of the beech stand on the southern slope is late in comparison to the spruce stand on the northern slope. Consequently, the evaporation by the trees (transpiration) begins earlier and is much more important on the northern slope than on the southern slope, especially during spring time (Najjar and Biron, 1995).
The mean water transit time of the subsurface water in this fractured granitic catchment is estimated to be approximately 38.5 months, which suggests that the volume in the aquifer, expressed as a water depth, is 2.4 m (Viville et al., 2006). There must be a notable thickness (> 45 m) of fractured bedrock present to store this volume of water in the aquifer. A water-saturated area, mainly located at the bottom of the catchment and connected to the stream, plays an active hydrological role both from hydrological and geochemical points of view (Idir et al., 1999; Ladouche et al., 2001; Viville et al., 2010). Its spatial extension is related to the hydrological state of the catchment.
For the work undertaken in this study, the retained period (17 February 2011 until the 8 June 2011) was one of the most pronounced spring droughts observed since the beginning of the measurements in 1986. Indeed, the rainfall during this period was 213 mm, which represents only half of the average normal value (mean value for the last 20 yr = 436 mm for the same period of time). In addition, the snow cover was thin and disappeared in February. Consequently, the runoff, Q, for this period was only 78 mm, while the mean runoff was 350 mm (the average for the last 20 yr for the same time period).
For the studied period, we assume that the actual evaporation AE is equal to the potential evaporation PE for this forested catchment. Even if this spring drought is relatively marked, the effects on the soils and on the vegetation are less pronounced. Indeed at this altitude in the Vosges Mountains, the vegetation growth, and therefore the transpiration, mainly starts early May. This fact is clearly shown by recent unpublished data of the soil water content and the soil water tension recorded at a plot scale located at the upper part of the south-facing slope. The soil water pressure measurements indicate that the water suction begins to increase at the end of April for the 0.05 m deep probe and at the beginning of May for the deepest probes. At the end of May, the 0.05 m deep probe reaches a 1 bar value while the 0.16 and 0.42 m deep probes reach a 0.5 bar value and the deepest (0.76 and 1.16 m) probes show weak variations (less than 0.2 bar). So it is clear that only the superficial layer is relatively affected by the drought while the deeper layers are not. Therefore there is enough water available in the soil to supply the required amount of transpiration to the vegetation, and thus that there is no major water stress during the studied period. Consequently, for the considered period, AE can be assumed to be equal to PE. The PE was calculated using the Penman formula from the data provided by the automatic weather station located on the site and was equal to 183 mm (17th February 2011 until the 8th June 2011). The following hydrological balance equation can be written:
In this case, the variation of storage is negative, indicating a continuous drainage of the aquifer, as shown by the discharge recession curve (Fig. 2). In term of gravity variation, –48 mm is equivalent to a gravity decrease of ∼2 μgal. While this gravity decrease is limited in amplitude at the scale of the catchment as a whole, we will show that internal water redistribution might be able to generate a much more important signal.
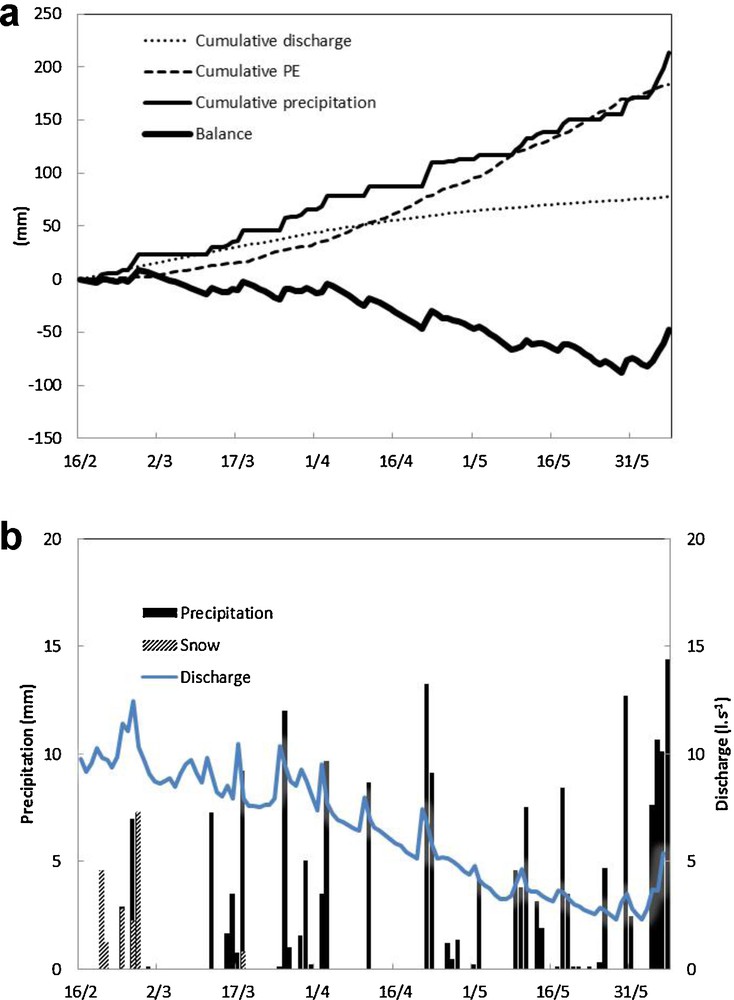
Water balance components for the period of measurements (17th February to 8th June). Top: cumulative values of precipitation, evapotranspiration obtained by the Penman formula, runoff at the outlet and water balance. Bottom: daily values of precipitation (grey for snow) and of discharge at the outlet.
Bilan hydrologique pour la période de mesures (17 février au 8 juin). Haut : valeurs cumulées (précipitations, évapotranspiration -formule de Penman-, écoulement à l’exutoire et bilan). Bas : valeurs quotidiennes de précipitations (sous forme de neige en hachuré) et de débit à l’exutoire.
3 Survey setup and data processing
3.1 The gravity network (Fig. 1)
We use a CG-5 Scintrex Autograv System relative gravimeter. It is a terrestrial gravimeter that needs to be operated on a network. The network consists of:
- • the gravimetric observatory of J9, close to Strasbourg, where the gravimeter is resting between the campaigns in a very favourable environment (no microseismic noise, no thermal disturbance…). For this experiment, we consider that J9 has a constant value of the gravity;
- • a secondary base located close to the outlet of the catchment (called STR2);
- • three sites along the river, in the bottom of the catchment (STR2, STR3, STR5);
- • six sites on the side slopes (STR6, STR8, STR13, STR14, STR15, STR16);
- • four sites on the ridges at the top of the catchment (STR9, STR10, STR11, STR12).
Most of the sites are set up on hard rock. Stations are mounted by drilling a small hole in the rock, where the CG5 tripod is rigorously installed in the same manner for every site. The CG5 tripod height is kept constant at every station by the use of a brass ring that maintains one tripod foot at a fixed height. This method keeps the CG5 gravity sensor at a fixed position with respect to the surface at each measurement station for all surveys. We make the hypothesis that no vertical movement occurs between the measurements and therefore no height corrections are needed.
The measurements are performed following the same sketch at each campaign: The loop starts and ends at J9. An intermediate base (STR2) is measured when arriving at the catchment and twice during the measurements. This allows us to check the drift of the gravimeter during the day. With this same goal in mind, the site STR8 is also measured twice.
3.2 Measurements
The CG-5 sensor is a fused quartz spring and mass system, surrounded by capacitor plates. Both monitor the mass movements due to gravity changes and counteract the gravity-induced movement, through a voltage feedback, to bring it to the null position. The voltage feedback is converted to a digital signal and processed to return a gravity value. These sensor and electronic designs allow the feedback voltage to cover a range of 8000 mgals without resetting. Consequently, measurements can be made with the same instrument configuration even when large changes in elevation exist between sites. Nevertheless, this instrument must be carefully operated in the field to obtain accurate measurements, particularly during transit between sites. When not in use, the instrument is set to take repeated measurements (cycling) on a stable ground. This enables the sensor to be continuously brought to its null position, thus minimizing its deformation.
The measurement acquisition at each site is performed by repeating 90-second long measurements, the duration for which the device reaches its best sensitivity (Merlet et al., 2008). Stability is reached when values oscillate within 5 μgal and the sensor temperature is constant between each measurement. Sensor temperature changes are monitored and accommodated through a compensation signal. Yet, there is some correlation between sensor temperature stability and gravity readings. We thus prefer to wait for the temperature to stabilize before ending the measurement. If these conditions are not satisfied after ten measurements, the described scheme is repeated. For most of the sites, values are stable before the tenth measurement. In the worst case, twenty measurements are needed. This occurs sometimes in STR2 after the long drive from J9 or in STR10, which is not settled on the rock but on a tree stump. To make the conditions better for measurement acquisition and to enhance the stability of the measurements, the gravimeter is protected from the wind by a plastic box that surrounds it. In addition, an umbrella protects it from solar rays, which can significantly change the tripod tilt by warming the tripod. The gravimeter must be held horizontally (0 ± 10 arcsec) during the measurement acquisition. The umbrella also limits large temperature variations.
3.3 Processing
According to the hydrological purpose of this study, the relative gravity data are first corrected from concurrent effects that would bias the analysis of the gravity changes in terms of local groundwater redistribution. These effects are those of solid earth tide and of ocean tide loading. They imply changes of several hundreds and few tens of μgal in the same day, respectively. Solid earth tides effects are directly corrected during the measurements with a built-in software. The ocean tide loading effect is removed using the continuous gravity time series recorded by the superconducting gravimeter in J9. Indeed, at the time scale of a gravity survey (10 to 12 h) and once corrected from solid earth tides effects, the superconducting gravity time series mainly represents the gravity changes due to ocean tide loading. J9 and the other stations of the network are not located in the same area, so that there are differences in the ocean tide loading effect between J9 and the Strengbach sites. Using the FES 2004 (Letellier, 2004; Lyard et al., 2006) ocean tide model, this difference is found to be lower than 0.4 μgal and is thus assumed to be negligible in comparison with the CG-5 accuracy (∼5 μgal). The pressure correction is neglected considering that the pressure variations are small during the course of the measurements.
Then the gravity measurements must be corrected from the instrumental drift of the CG-5, which is due to the creep of the fused quartz spring. The drift indeed implies changes of gravity without geophysical meaning, thus it must be removed. The drift adjustment is performed using the least squares method described by Hwang et al. (2002) for the gravity measurements that are repeated at J9, STR2 and STR8. For these short time scales, the best fits are usually obtained with a linear rather than quadratic drift.
Once the tide and instrumental drift effects have been removed, the gravity residuals measured from one survey to another can be interpreted as the consequences of local water redistribution.
Mean errors for each station are given in Table 1. The best measurements are obtained at STR2 (mean error: 4.9 μgal) because this site was used as a secondary base. The maximum mean error is observed at STR10 (mean error: 9.2 μgal). Due to the lack of bedrock at this location, the site was set up on a large tree stump, which could explain the higher mean error. Except for the site STR10, the uncertainties are largely smaller than the observed gravity variations, allowing the discussion of these variations in terms of hydrological properties.
Erreur moyenne pour chaque station.
| Station | Mean RMS (in μgals) |
| STR2 | 4.9 |
| STR3 | 6.5 |
| STR5 | 6.5 |
| STR16 | 6.9 |
| STR6 | 7.8 |
| STR15 | 8.1 |
| STR14 | 8.0 |
| STR8 | 7.4 |
| STR9 | 8.4 |
| STR10 | 9.3 |
| STR11 | 9.1 |
| STR12 | 8.9 |
| STR13 | 8.2 |
4 Results and discussion
Fig. 3 shows the temporal gravity variations obtained at each site from 17th February to 8th June. The mean value for each site has been subtracted from the temporal gravity values from each site. Using such an approach, we do not need to fix an arbitrary reference date. Gravity changes relative to J9 are large, with a maximum variation obtained for STR5 on 1st June with a difference of 55 μgal relative to the 17th February value. Interestingly, variations from one site to the next in a single measurement campaign are smaller. From 17th February to 3rd March, the mean value increases. Later, from 3rd March to the end of April (29th April), the trend is negative. The last period is more erratic, with large variations from one campaign to the next, but with an overall upward trend. The highest values are observed on the first of June.
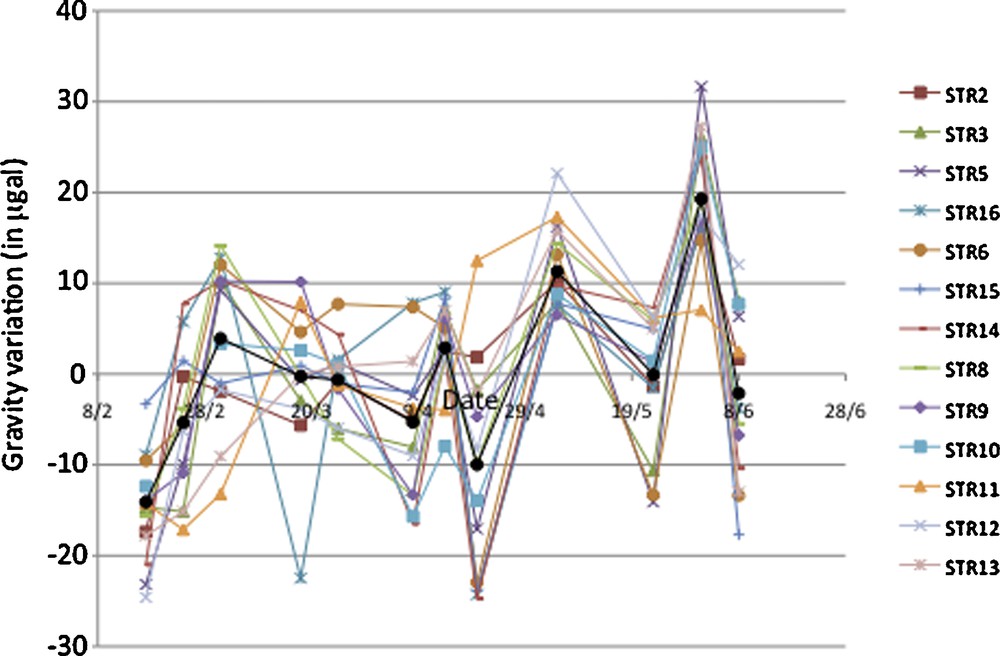
Temporal variation of gravity. For each site, the mean value of the 12 measurements (first: 1st February, last: 8th June) has been subtracted. The black line indicates the mean value for all the stations at each campaign.
Variation temporelle de la pesanteur. Pour chaque site, la valeur moyenne des 12 mesures (du 1er février au 8 juin) a été soustraite. La ligne noire indique la valeur moyenne de toutes les stations pour chaque campagne.
These erratic variations could result from the existence of a large-scale process that affects the gravity of the entire site. As of yet, no such process has been identified. They can also result from temporal gravity variation at J9. For example, if the gravity of the sites of the Strengbach network is increasing, it may be because it is less decreasing as compared to Strasbourg. This could result from the difference of rainfall between Strasbourg and the Vosges Mountains. The alternative that we favor is that gravity variations are affected by some errors due to the distance between J9 and the Strengbach catchment (approximately 80 km, partly on mountain roads). During this long transfer, the gravimeter is shaken and the stability of the drift is less well controlled. For this reason, the gravity values calculated at the Strengbach site are difficult to interpret. Knowledge of the absolute gravity directly within the Strengbach watershed could avoid this problem. Therefore, only the relative variations of the signal will be interpreted in the following analysis. To do this for each campaign, we subtract from each value the mean value of the 13 sites for the considered campaign. The result is shown on Fig. 4. In this figure, we have shifted the curves to better observe the trends. The difference in gravity in Fig. 4 varies between sites X and Y from time t1 to time t2 if there is a relative gravity change in X and Y from time t1 to time t2. For example, if the gravity is lower at site X than at site Y at time t1 and t2, and if the difference increases, this means that the gravity has decreased at X relative to Y. This allows one to investigate the storage spatial variability within the catchment. In this figure, we can observe the relative position of one site to another and the trend of the variation at each site over the study period. A global view can be gained from the trend: if the trend for one site is negative, then gravity is decreasing more than the mean of the sites. Conversely, if the trend is positive, then the site has an increase in gravity relative to the other sites. Several groups of sites show similar trends.
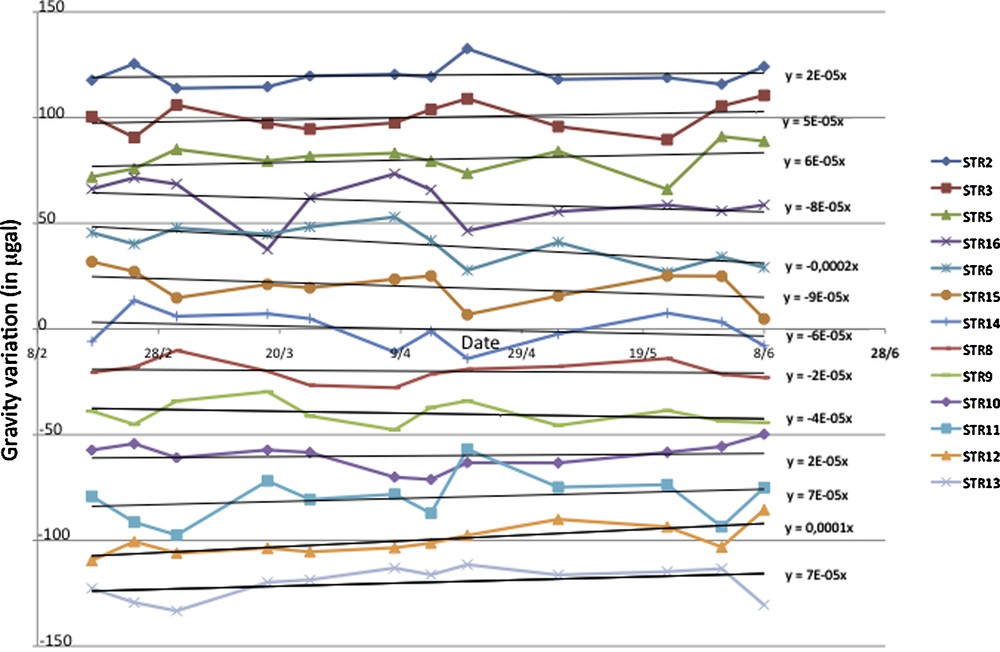
Relative spatial and temporal variation of gravity. This is the same as Fig. 3 minus the mean value of the 13 sites for each campaign. The curves have been shifted vertically for easier reading.
Variations relatives temporelles et spatiales de la pesanteur. Identique à la Fig. 3, mais en soustrayant la valeur moyenne des 13 sites pour chaque campagne. Les courbes ont été décalées verticalement pour une lecture plus facile.
Sites with negative values (STR9, STR8, STR16, STR6, STR15, STR14) are located on the northern part of the basin (northern slope and bottom of the southern slope). The largest negative values are obtained for sites located more or less at the same altitude, i.e., at the medium altitude of the catchment. Maximum positive values are obtained at STR13, STR12 and STR11 at the top of the southern part of the basin. Smaller positive values are observed in the bottom of the catchment, along the river (STR2, STR3, STR5) and at STR10. We will not discuss this last site much because of the suspicions explained above. The differences between the three groups are significant for almost all measurements made during the measurement period. Clearly, these data show that the relative gravity variations within the watershed are spatially correlated. The value of the trend for the different catchment sites can be divided geographically (Fig. 5). This indicates common behavior for sites closely located in the catchment.
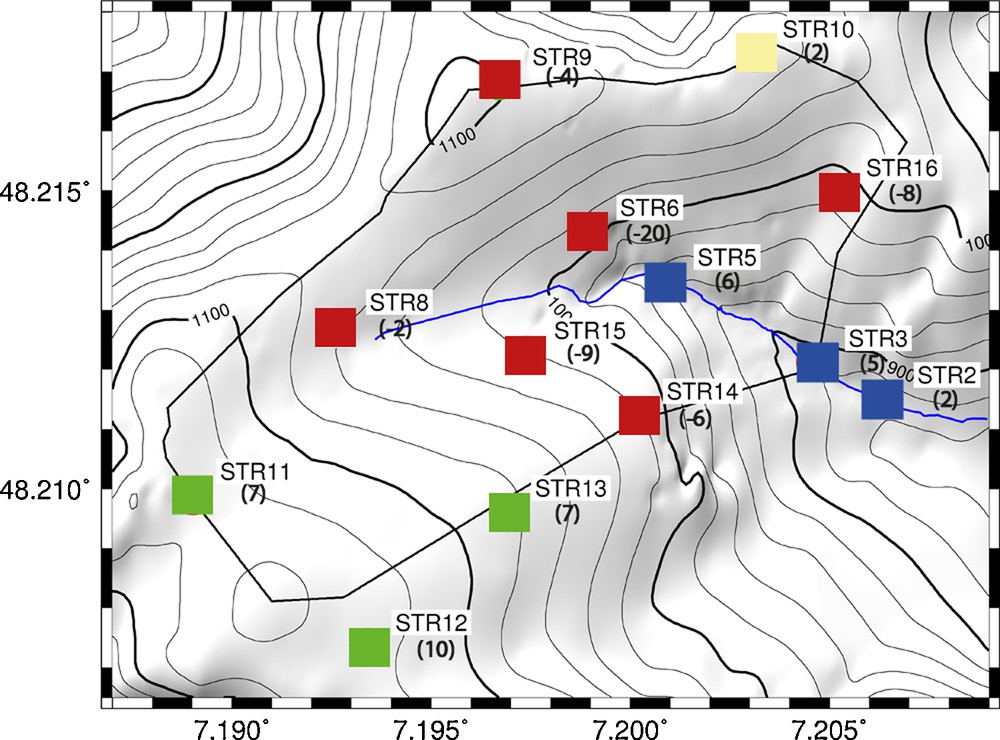
Value of the trends computed in Fig. 4. A clear spatial correlation is observed (see text for details). Sites with negative values (STR9, STR8, STR16, STR6, STR15, STR14) are located on the northern part of the basin and plotted in red. Maximum positive values are obtained at STR13, STR12 and STR11 at the top of the southern part of the basin are plotted in green. Sites with the smaller positive values are observed in the bottom of the catchment, along the river (STR2, STR3, STR5) and plotted in blue.
Valeurs des tendances calculées sur la Fig. 4. Une claire corrélation spatiale est observée (voir texte pour détails). Les sites avec des valeurs négatives (STR9, STR8, STR16, STR6, STR15, STR14) sont localisés dans la partie nord du bassin et représentés en rouge. Les valeurs positives les plus élevées sont obtenues à STR13, STR12 et STR11, au sommet de la partie sud du bassin, et représentées en vert. Les sites avec une faible valeur positive sont observés au fond du bassin, le long de la rivière (STR2, STR3 et STR5) et sont représentés en bleu.
It is also clear that some sites have smooth variations (i.e., in Fig. 4, they correspond approximately to a straight line), while other sites seem to have a more erratic behavior. In the first category, we can include sites STR10, STR12, STR13, and sites STR16, STR6, STR15, STR14 can be included in the second group. For this second group, we notice a large change (decrease) in April, which is correlated with a dry and hot period. We propose, once again, that these behaviours are related to local properties of the sites.
We are not able to explain in detail all the gravity observations due to the lack of precise hydrologic and geologic data for all of the sites. This does not allow us to make a precise hydrological model. Nevertheless some of the observations can be related to the spatial characteristics of the catchment that are already well known. The three southern sites (STR11, STR12, STR13) are in a zone where water transfer is most likely fast, implying that there is only a small amount of water storage in the upper part of the bedrock. This could explain why the variations are relatively smooth. Considering that the other sites undergo drainage of the aquifer during this period (and consequently an absolute gravity decrease), it is not surprising that these three sites with low absolute gravity variations show a positive trend, i.e., a relative increase in gravity compared to the other sites of the catchment. The sites in the valley are most likely saturated with water during the whole experiment. For this reason, they do not show large gravity changes but rather have a small flat trend. If the other parts of the catchment show a negative slope, i.e., a larger decrease in gravity, it is because the water content decreases quickly due to one or several of the causes mentioned above (soils, vegetation, evaporation, seepage, and others).
Moreover, we must take into account the topography, which strongly affects the results. Fig. 6 shows the effect on gravity of adding a 1 cm layer of water everywhere. For flat topography, the effect is an additional 0.419 μgal of gravity everywhere. This corresponds to the plateau effect. In the catchment, it is much more complicated. Much water is added above the valley to the sides of the catchment, decreasing the valley gravity by 0.2 μgal. Conversely, on the ridges, most of the water acts to increase gravity, resulting in increases greater than 0.419 μgal. In the Strengbach catchment, the maximum value reaches 0.7 μgal. Clearly topographic effects amplify the gravimetric effect of water compared to previous hydrogravimetric studies in flat areas, such as in the Larzac (Jacob et al., 2010) or in the Sahel (Pfeffer et al., 2011). Such topographic effects alone cannot account for the gravity variations observed at the Strengbach catchment. The observed gravity measurements therefore contain relevant information about the hydrological functioning of the watershed.
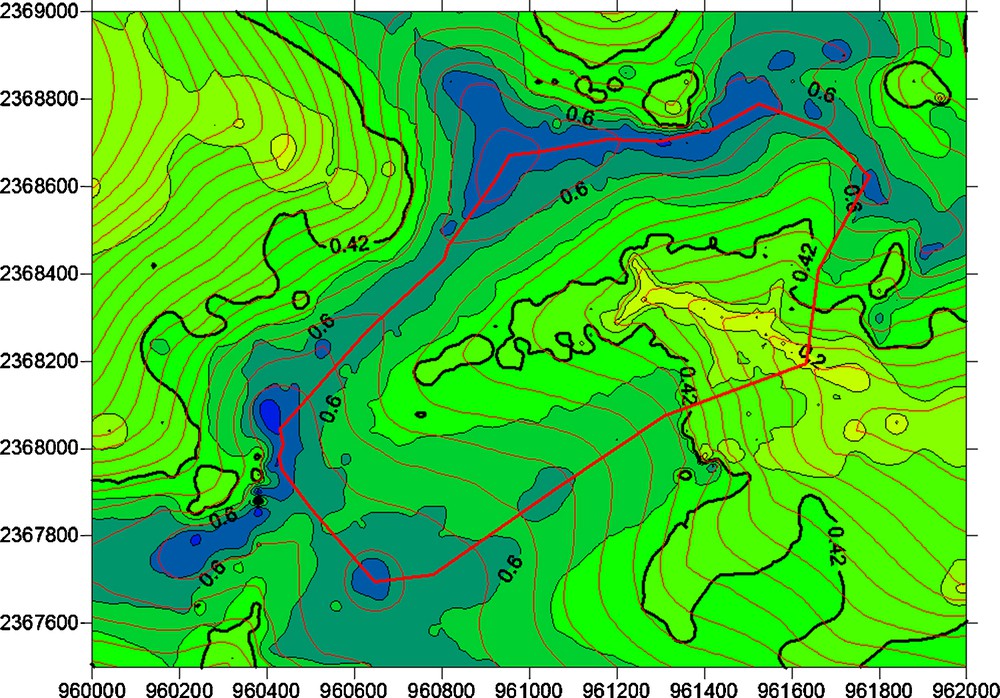
Gravity effect due to a uniform layer of one centimeter of water draped over the topography in μGal (highest values along the crests in blue, lowest values along the valleys in light green). A bold black line underlines the 0.42 μGal value, which is the standard value obtained for a perfectly flat topography. The topography is represented by the thin red contours. The bold red line indicates the Strengbach catchment.
Effet sur la pesanteur d’une couche uniforme d’un centimètre d’eau drapée sur la topographie en μGal (valeurs les plus élevées le long des crêtes en bleu, des valeurs plus faibles le long des vallées en vert clair). La ligne en noir et en gras souligne la valeur de 0,42 μGal, qui est la valeur standard obtenue sans topographie. La topographie est représentée par les contours rouges minces. La ligne en rouge et en gras indique les limites du bassin versant du Strengbach.
5 Conclusion
This initial gravity experiment in the Strengbach catchment clearly indicates that it is possible to link temporal and spatial gravity variations to the spatial characteristics of the catchment. Some of the observations can be related to the spatial characteristics of the catchment that are already well known. Gravity is a useful tool in obtaining information about the water transfer properties throughout the catchment. In order to obtain a higher level of detail, several improvements have to be made in the measurement strategy. First, the existence of a continuous reference gravity measurement within the watershed would be very beneficial. This could be performed by installing a superconducting gravimeter in situ. This reference is needed:
- • to avoid the problems associated with transferring the relative gravimeter from the absolute base to the catchment, and;
- • to allow for a continuous monitoring of the gravity at one site to complement the other measures.
Second, denser temporal and spatial measurements could be very useful.
A precise interpretation of the gravity variations in the Strengbach watershed would require a precise knowledge of the water fluxes at the surface and underground, which is not available today. Conversely, more accurate data and longer time series of gravity variations might be used to constrain the hydrological model of the watershed. Several parameters, such as local heterogeneities in terms of the bedrock (type of soil, porosity, thickness of saprolite), vegetation cover (which could influence the PE) as well as meteorological effects (different rainfall/throughfalls), have been identified that influence the water fluxes and water pathways. In the future, more precise gravity measurements would help to reveal the role and impact of these parameters on water circulation at the catchment scale.
Acknowledgements
The measurements have been performed using a gravimeter paid by the REALISE network. The article was improved by the constructive comments of Laurent Longuevergne, Ghislain de Marsilly (Associate Editor) and an anonymous reviewer.