

1 Introduction
The terrestrial Earth surface has the remarkable ability to maintain an almost continuous cover of regolith (defined here as the layer of unconsolidated material that includes mobile soil and non-mobile, weathered saprolite). The regolith layer is the interface between the atmosphere, biosphere and lithosphere, and is sensitive to changes in all three systems. Spatial analysis of the Global Soil Regions map (NRSC, 2005) shows that 94% of the terrestrial land surface is covered with unconsolidated soil and regolith, while the remaining land cover comprises water, glaciers, rock debris, dunes, or salt flats. This regolith cover is maintained in the face of permanent removal by erosion, the long-term-rates of which vary globally by three orders of magnitude (Montgomery, 2007). In order to maintain this mantle over time in spite of disturbance (e.g. climatic change), the regolith that is removed by erosion at the surface must be permanently replaced and rejuvenated by production from below (Fig. 1a). Hence, a mechanism is in place that balances regolith removal by erosion with its production through weathering of bedrock, and this mechanism operates across a wide range of erosion rates.

Principles of soil production and weathering. A. Concepts of steady state soil production and denudation. The denudation rate (D) reflects the sum of physical erosion (E) and chemical weathering (W) within regolith, and is balanced by regolith production at steady state. B. The soil production function predicts a maximum soil production rate (SPmax) under thin or infinitely thin soils, and an inverse relationship between soil thickness and soil production. This function is commonly shown with either an exponential form (black line) or a humped form (grey line), whereby soil is produced fastest under a critical thickness (Hc) (Heimsath et al., 1997; Wilkinson and Humphreys, 2005). Erosion rates that exceed the maximum predicted soil production rate (shown for both function forms) should result in the thinning of soils to zero, and the emergence of exposed bedrock. This is illustrated with arrows to the right that correspond to the SPmax for the empirical function. C. Numerical models predict weathering rates and intensity should decrease as erosion exceeds a critical rate, and regolith residence times decrease (Ferrier and Kirchner, 2008; Gabet, 2007).
Production du sol et altération: principes. A. Production du sol et altération: concepts. Le taux de dénudation (D) est la somme du taux d’érosion physique (E) et du taux d’altération chimique dans le sol (W) et est compensé, à l’état stationnaire, par le taux de production du sol (SP). B. La fonction de production du sol prédit l’existence d’un maximum pour le taux de production du sol (SPmax) dans le cas de sols fins ou infiniment fins, ainsi qu’une relation négative entre l’épaisseur du sol et son taux de production. Cette fonction est en général présentée comme étant de forme exponentielle (ligne noire) ou en cloche (ligne grise), pour laquelle le sol est produit le plus rapidement à une épaisseur critique (Hc ; Heimsath et al., 1997;Wilkinson et Humphreys, 2005). Si les taux d’érosion dépassent le maximum prédit pour le taux de production du sol (visible ici pour les deux types de fonction), alors l’épaisseur du sol est progressivement réduite à zéro, et la roche-mère affleure. Ceci est illustré pour la cas de la fonction exponentielle à l’aide des flèches sur la droite du diagramme. C. Les modèles numériques prédisent que les taux et les intensités d’altération décroissent si le taux d’érosion dépasse un certain seuil, auquel cas le temps de résidence du sol décroît aussi (Ferrier et Kirchner, 2008; Gabet, 2007).
Can the relationships between regolith production, erosion and weathering help to sustain regolith and soils, or are there limits to the feedbacks between these processes? This question is critical to our understanding of how landscapes evolve, and much theoretical and empirical evidence exists that regolith cannot and is not produced infinitely fast. For example, empirical and conceptual models that relate the rates of soil production to soil thickness (e.g., Heimsath et al., 1997) suggest that the presence of soil is conditioned by a maximum erosion rate. When erosion rates exceed this threshold, the affected landscape should lose its continuous soil and regolith mantle (Fig. 1b).
Soils and regolith formation is enabled when rock weathers chemically. Chemical weathering, here defined as the chemical mass loss by primary mineral dissolution, and export of this mass in the dissolved form, is widely recognized to increase with the landscape erosion rate (Riebe et al., 2004; West et al., 2005). This relationship can be explained by two processes: (1) erosion continually rejuvenates the landscape to supply fresh weatherable minerals from below to the surface weathering zone, thus enhancing weathering fluxes; and (2) weathering reactions alter rock to sustain physical processes of soil production and erosion. These expectations have lended long-lasting support to a much-cited paradigm that high active mountain belts are the most important sites of chemical weathering and associated CO2 drawdown (Berner and Berner, 1997; Edmond and Huh, 1997; Hilley and Porder, 2008; Raymo and Ruddiman, 1992).
The weathering-erosion relationship may not increase infinitely, however. The loss of soil cover at high erosion rates (Heimsath et al., 2012; Norton et al., 2010) may be complemented by declining chemical weathering fluxes. Numerical models based on weathering kinetics predict that increases in erosion rates beyond a certain limit result in reduced weathering intensities and rates (Ferrier and Kirchner, 2008; Gabet, 2007; Gabet and Mudd, 2009; Hilley et al., 2010). As erosion rates increase, the benefits of increased mineral supply to weathering rates are overcome as soil and regolith residence times decrease. In such a case erosion rates outpace the time required to decompose minerals (Fig. 1c). This prediction was confirmed with recent observations of reduced weathering intensity in steep mountainous soils (Dixon et al., 2012).
From these concepts we can pose the hypothesis that the presence of regolith is a prerequisite for chemical weathering. Furthermore, if regolith production is limited by rapid erosion, the associated chemical weathering should also have an upper limit. This notion stands in contradiction with the paradigm that rapidly eroding mountains drive global weathering. We do not repeat the discussion of the geomorphological perspectives of weathering and resulting CO2 drawdown that has been recently reviewed (Goudie and Viles, 2012). Instead, we design a test of the limit hypothesis. Such a test requires knowing soil production rates and concomitant regolith weathering rates over a wide range of denudation rates. Given that weathering might also take place through processes other than regolith formation (e.g., in bedrock fractures or floodplains), a test is needed to infer whether these limits are also reflected in landscape-wide patterns. To do so we make use of four rich data sets. We compile from (1) soil production rates measured by cosmogenic nuclides; and (2) associated regolith weathering rates by chemical mass balances from actively eroding terrains. We compare how the rates of soil production are reflected at the watershed scale by comparing them to (3) catchment-wide denudation rates from cosmogenic nuclides in river sediment and also from denudation rates from river loads. Lastly, we (4) compare how regolith weathering rates are reflected at the watershed scale by comparing them to river silicate dissolved loads. We use statistical limits to our data sets to show that the rates of regolith production are restricted by a globally valid ‘speed limit’, and that this limit is also reflected in global weathering rates.
2 Approach
2.1 Conceptual model
Here, we adopt a geomorphology-based conceptual model of soil and regolith on hillslopes (Fig. 1a). Soil is the mobile mantle of material that is produced in situ from underlying intact parent material, while regolith is the layer of unconsolidated material that includes mobile soil and non-mobile, weathered saprolite. Soil production (SP) occurs by the mechanical disruption of underlying parent material while regolith production proceeds by the propagation rate of the bedrock weathering front. Denudational mass loss (D) is the sum of both chemical processes of weathering (W) and physical processes of erosion and soil transport (E). In this article we express the rates of these processes in units of mass flux (t km−2 yr−1). The soil residence time, and characteristic timescale of denudation, is calculated as the ratio of the soil production rate and soil thickness. This timescale typically ranges from 103 to 105 years. Our analysis holds for hillslopes that are actively eroding over this time scale.
While soil production is typically treated explicitly as a biologic or mechanical process, the production of regolith from unweathered bedrock is a chemical one. When mobile soil overlies bedrock directly, then regolith and soil production are concurrent; however, at many locations, regolith profiles extend as deep saprolites far beneath the mobile soil layer. Much of the weathering flux in these settings is typically derived from within saprolites and the weathering front at the base of regolith (Fig. 1a).
2.2 Rates of soil production and denudation
We present a new compilation of 288 local soil production rates from measurements of in situ-produced cosmogenic nuclides in soils and bedrock. These nuclides measure denudational removal by both surface erosion and weathering. The integration timescale of denudation rate measurements typically ranges from 103 to 105 years, which is convenient as it is similar to the soil residence time (section 2.1). These long integration time scales tend to average out short-term fluctuations; thus the measurements are insensitive to recent perturbations (von Blanckenburg, 2005). If soil thickness is maintained in some steady state over the integration time of the measurement, then soil denudation is balanced by soil production, and denudation rates from single soil pits are identical to local soil production rates (Heimsath et al., 1997).
As discussed in Dixon et al. (2009a, b), these 10Be-derived rates do not capture all denudational fluxes, because some of the chemical mass lost may occur in saprolites beneath the shallow depths of nuclide production. Hence, these cosmogenic-derived rates best reflect only surface denudation and production within soils. They can be corrected to calculate total denudation rates if saprolite weathering is quantified (Dixon et al., 2009a).
The denudation concept for cosmogenic nuclides differs from the principle that is used in U-series isotope measurements in regolith and saprolite. In that method, ages are obtained that typically decrease with depth (Chabaux et al., 2003). This relationship is interpreted to directly reflect the advance rate of the weathering front, and that measure is independent of the rate of denudation (Dosseto et al., 2012).
2.3 Rates of catchment-wide denudation
Measurements of cosmogenic nuclides in quartz from the bedload of rivers yield spatially averaged denudation rates. These measurements integrate denudation processes within a watershed (Bierman and Steig, 1996; Granger and Riebe, 2007; von Blanckenburg, 2005). The spatial scale over which this method can be applied ranges from that of a small mountain creek to that of a large river basin. The time scale of the measurement is also 103 to 105 years. We use the compilation of Portenga and Bierman (2011), which includes 1200 measurements of cosmogenic 10Be in quartz sand from globally distributed rivers, to explore the distribution of global, catchment-scale denudation rates.
Catchment-wide denudation rates from cosmogenic nuclide concentrations do not allow us to readily distinguish between physical erosion and chemical weathering. We can compare these rates by those obtained from river loads. The sum of sediment yield and the dissolved yield in rivers of known discharge derives the catchment's total denudation rate. This rate integrates over the duration of the river load gauging campaign. We use the compilation of Milliman and Farnsworth (2011) to explore river-based total denudation rates.
2.4 Rates and intensity of chemical weathering of regolith
The concentrations of a refractory element (e.g. Zr) measured within regolith and bedrock yields a simple quantification of the chemical weathering extent of a weathered product, such as soil, relative to its parent material. Riebe et al. (2003) termed this the chemical depletion fraction (CDF = 1–[Zr]parent/[Zr]product). The CDF can be used to quantify the fractional mass loss during conversion of unweathered bedrock to saprolite (CDFsap) or soil (CDFtotal), or from saprolite to soil (CDFsoil). Using a known soil production rate (SP), as determined locally from cosmogenic nuclides, the soil chemical weathering rate (Wsoil) is calculated as the product of the CDFsoil and SP. The total weathering rate (W) can be calculated as the sum of the soil (Wsoil) and saprolite (Wsap) components, or as the product of CDFtotal and the total denudation rate. The erosion rate (E) is then equal to the difference between the denudation and weathering rates. We compiled weathering and erosion rates from 122 soil samples from which both soil production rates, based on cosmogenic nuclides, and CDFtotal from Zr-based mass balances were available.
2.5 Rates and intensity of catchment-wide weathering
To test whether regolith-derived weathering rates are valid at the catchment scale, we compile published data of riverine dissolved and sediment fluxes where solute concentrations were corrected for non-silicate contributions (Gaillardet et al., 1999b). These data are carefully corrected for atmospheric inputs by the authors, and, where possible, also for non-silicate (e.g. carbonate) weathering fluxes. When divided by catchment area, these fluxes yield weathering rates (W, in t km−2 yr−1). We use the ratio of the dissolved flux to total solid flux to determine a total catchment-wide silicate weathering CDF.
3 Results and discussion
3.1 Relationship between physical erosion and chemical weathering
We first analyse how chemical weathering varies with physical erosion. Similar analyses have been presented before, and were either limited to soil data (Riebe et al., 2004), river loads (Dupré et al., 2003), or did not distinguish between both types of data sets (West et al., 2005). These previous studies noted that while weathering and erosion are correlated, the correlation is non-linear (Gabet and Mudd, 2009; West et al., 2005). Here we carefully separate regolith-based data and data derived from river loads (Fig. 2). We note that the regolith-based data is derived primarily for felsic lithologies, while river-based data integrates across a variety of rock types. A number of important observations can be made from the comparison of these data sets:
- • regolith erosion data show an upper limit, which river-based erosion data exceed by nearly two orders of magnitude;
- • regolith-based weathering rates tend to increase with erosion rates. However, only the lowest subset of river-based weathering rates fall within the weathering-erosion array defined by regolith data;
- • as erosion rates increase, weathering rates from rivers approach the same limit achieved by regolith at much lower erosion rates.
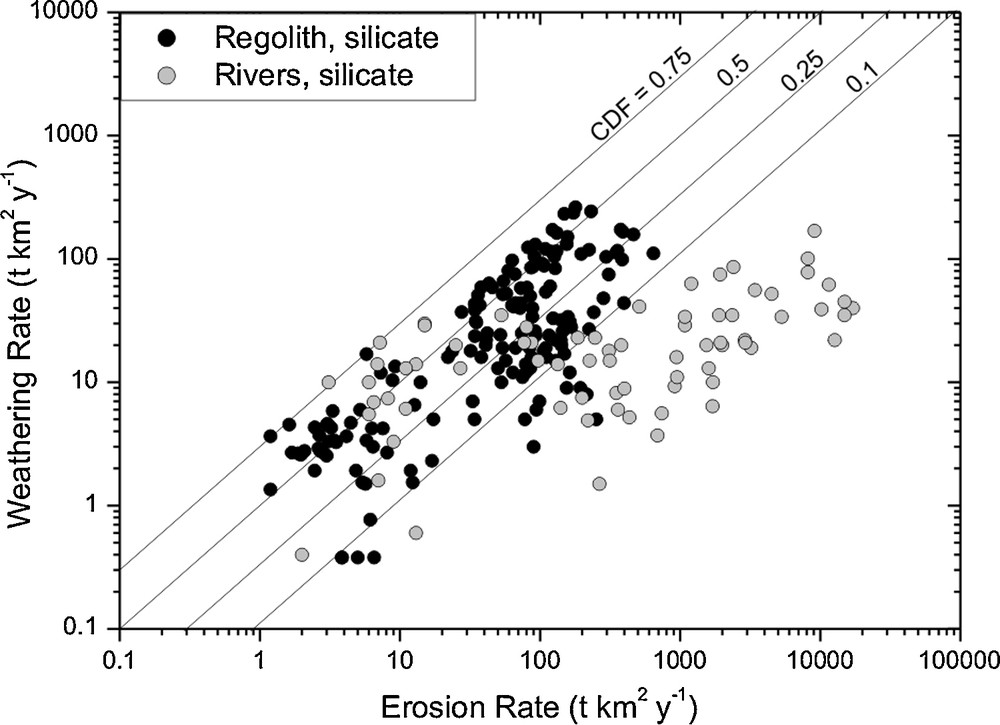
Chemical weathering rate vs. erosion rate for regolith and rivers. Data for regolith are derived from cosmogenic nuclides CDF (the ratio of chemical weathering to total denudation, an index of weathering intensity), measured on soils developed on felsic crystalline bedrocks. Data for rivers are derived from suspended and dissolved loads, and relate to rivers draining felsic crystalline rocks, various sedimentary rocks and volcanics. The river weathering rates were obtained from dissolved loads corrected for atmospheric inputs (e.g. using Cl− in precipitation) and for carbonate dissolution. Data sources are listed in Table 1. The comparison of weathering rates between the two data sets shows that river-based weathering rates do not exceed regolith weathering even at very high erosion rates. CDF isolines are shown for reference. Note that most soils feature a maximum possible CDF of 0.5 to 0.1. Note also that rivers from high-erosion rate mountain belts yield CDFs < 0.1, testifying to lower degrees of weathering.
Taux d’altération chimique vs. taux d’érosion pour les régolithes et les rivières. Les données sur les sols ont été obtenues à partir des isotopes cosmogéniques et de la fraction d’appauvrissement chimique CDF (rapport entre le taux d’altération chimique et le taux de dénudation, qui quantifie l’intensité d’altération) mesurés sur des sols développés sur des roches-mères cristallines felsiques. Les données sur les rivières ont été obtenues sur des rivières drainant des roches cristallines felsiques, des roches sédimentaires variées et des roches volcaniques, présentées dans des études qui rapportent aussi des estimations de charge sédimentaire en suspension. Ces données reflètent les charges dissoutes totales, corrigées des apports atmosphériques (par exemple en utilisant Cl− dans les précipitations) et carbonatés. Les sources des données sont présentées dans le Tableau 1. La comparaison des taux d’altération entre les deux jeux de données montre que les taux d’érosion basés sur la charge dissoute des rivières ne dépassent pas ceux obtenus sur les sols, même pour des taux d’érosion très élevés. Les droites de CDF constant sont indiquées. Il est à noter que la plupart des sols montrent des valeurs de CDF comprises entre 0,5 et 0,1. Les rivières drainant des chaînes de montagnes à forts taux d’érosion ont des CDF < 0,1, ce qui indique des intensités d’altération plus faibles.
There are clear differences in regolith and river data, all of which cannot be addressed with a rough global compilation we have here. However, importantly, the limit in weathering seen in regolith matches weathering limits from rivers draining much more rapidly eroding terrain. To explore whether the limits we see are globally valid, or whether they are artefacts of the different time scales of these two methods, we further explore the statistical limits to these regolith and river based data sets.
3.2 Rates of soil production and denudation
Global soil production rates from our new compilation range from 1 to 1300 t km−2 yr−1 (Table 1, Fig. 3a), and their distribution peaks at a median of 70 t km−2 yr−1 (equivalent to 27 mm ky−1). By comparison, a median SP of 17 mm ky−1 was compiled by Montgomery (2007). We interpret the median SP of 70 t km−2 yr−1 as representing the closest estimate for the mean global denudation rate of soil-mantled landscapes.
Résumé des taux de dénudation, de production de sol, et d’altération chimique qui viennent des compilations globales.
| Mean | Median | P95% | Max | N | |
| Soil production rates | |||||
| Soil Production (all)a | 120 | 71 | 450 | 1300 | 288 |
| Soil Production without steep San Gab Mtnsb | 100 | 67 | 320 | 620 | 273 |
| Denudation rates | |||||
| Catchment-wide from cosm. nuclidesc | 520 | 115 | 2200 | 11 800 | 1209 |
| Catchment-wide from river loadsd | 710 | 89 | 2760 | 56 520 | 372 |
| Silicate weathering rates | |||||
| Felsic soil from cosm. nuclides and CDFe | 40 | 20 | 151 | 263 | 172 |
| River dissolved felsicf and sedimentaryg | 18 | 13 | 63 | 101 | 146 |
| River dissolved volcanich | 69 | 41 | 222 | 500 | 180 |
| River dissolved volcanic without Philippinesi | 41 | 31 | 106 | 225 | 101 |
| Total weathering rates | |||||
| River dissolved global all lithologiesj | 99 | 44 | 490 | 1090 | 372 |
a Soil production rates are from multiple sources (Burke et al., 2009; Cox et al., 2009; Dixon et al., 2009a, 2009b; Ferrier et al., 2011; Heimsath et al., 2001a, 2006, 2012, 1999, 2001b; Meyer et al., 2010; Norton et al., 2010; Owen et al., 2011; Riebe et al., 2003, 2004; Riggins et al., 2011; Small et al., 1999; von Blanckenburg et al., 2004; Wilkinson and Humphreys, 2005). We converted rates presented in length per time units to t km−2 yr−1 by using the same density the authors used to calculate their cosmogenic nuclide attenuation depth. When authors did not report this density, we use a value of 2.6 g cm−3. We compile denudation rates as calculated by the original authors, with no further adjustment standardization for nuclide production rates or AMS standards. Soil production rates in the San Gabriel Mountains (Heimsath et al., 2012) were converted to t km−2 yr−1 by using a soil density of 2.2 g cm−3. Compilation includes steep (average slope > 30°) samples of Heimsath et al. (2012).
b Same as (2) but omitting SP from steep (average slope > 30°) samples of Heimsath et al. (2012).
c Catchment D was obtained from a recent compilation of cosmogenic 10Be concentrations in river sediment (Portenga and Bierman, 2011). We converted reported length-per-time denudation rates into t km−2 yr−1 using a bedrock density of 2.6 g cm−3.
d Catchment D was obtained by summing weathering rate and erosion rate in the global compilation of Milliman and Farnsworth (2011).
e Soil weathering rates are compiled from studies where both soil production rates and a CDF based on Zr concentrations in bedrock and regolith are reported (Burke et al., 2009, 2007; Dixon et al., 2012, 2009a; Ferrier et al., 2012; Norton and von Blanckenburg, 2010; Riebe et al., 2004). Soil production rates from Dixon et al. (2012) were modelled from soil thicknesses presented in Heimsath et al. (2012).
f Weathering rates calculated from the dissolved loads of rivers from felsic crystalline (magmatic and metamorphic) lithologies. Rates from Millot et al. (2002) are corrected for atmospheric and non-silicate weathering contributions (e.g., carbonate). The remaining reflect the total dissolved loads corrected for atmospheric contributions (e.g. using Cl in precipitation), but not corrected for non-silicate weathering contributions (Edmond and Huh, 1997; Hosein et al., 2004; McDowell and Asbury, 1994; Millot et al., 2002; Schaller et al., 2001; Zakharova et al., 2005). Hence, these data represent an upper estimate of silicate fluxes from felsic lithologies.
g Silicate weathering rates reflect the total dissolved loads corrected for atmospheric contributions (e.g. using Cl in precipitation) minus the contribution by carbonate weathering. Correction methods used by the individual authors typically rely on ratios of Ca-Na and Mg-Na (Gaillardet et al., 1999b). Data are from multiple sources (Carey et al., 2006; Gabet et al., 2010; Gaillardet et al., 1997, 1999b; Gibbs, 1967; Goldsmith et al., 2008; Grove, 1972; Guyot et al., 1996; Hartmann and Moosdorf, 2011; Jacobson and Blum, 2003; Jacobson et al., 2003; Li et al., 1984; Lyons et al., 2005; Moquet et al., 2011; Mortatti and Probst, 2003; Qin et al., 2006; Schaller et al., 2001; Wolff-Boenisch et al., 2009).
h Silicate weathering fluxes from volcanic lithologies, corrected for atmospheric and, where possible, for hydrothermal inputs (Gaillardet et al., 2011). Data are from multiple sources (Dessert et al., 2001, 2009; Gaillardet et al., 2011; Goldsmith et al., 2010, 2008; Hartmann and Moosdorf, 2011; Jones et al., 2010; Louvat and Allègre, 1998; Louvat et al., 2008; Lyons et al., 2005; Pokrovsky et al., 2005; Schopka et al., 2011).
i Same as (h) but omitting the 79 samples from the Philippines that were heavily weighted in the volcanic dataset due to their large number (Schopka et al., 2011). Some of these rivers drain unconsolidated volcanic ash.
j Total weathering rates across all lithologies from a global data base of river suspended and dissolved loads (Milliman and Farnsworth, 2011). Data are uncorrected for atmospheric contributions.
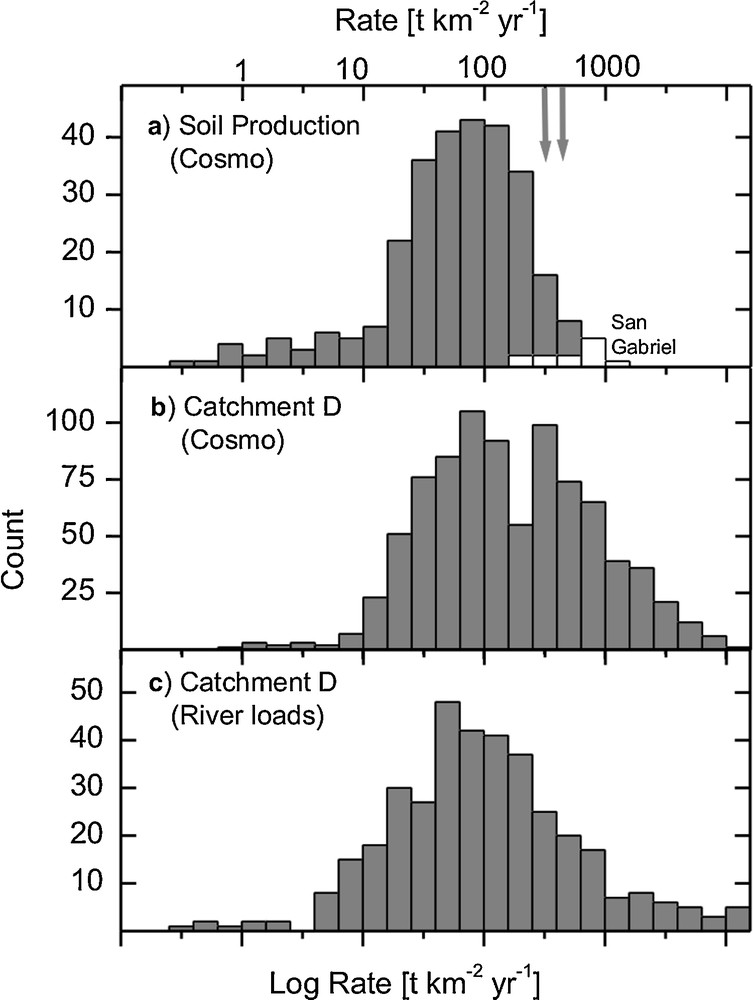
Histograms of globally distributed denudation and soil production rates (log10 based, in t km−2 yr−1). (a) Soil production rates from globally distributed soils (grey, data sources as in Table 1) and the steep slopes of the San Gabriel mountains (white, Heimsath et al., 2012). (b) Catchment-wide denudation from cosmogenic nuclides in river sediment (Portenga and Bierman, 2011). (c) Catchment-wide denudation rates from a compilation of global river loads (Milliman and Farnsworth, 2011). Grey arrows in panel (a) show the possible range of the 95% soil production speed limit (320 to 450 t km−2 yr−1). This limit is exceeded in river basins from high mountains (panels b and c) through fast erosion processes beyond the soil formation threshold. The median soil production rate of 70 t km−2 yr−1 is reflected by the peak in the distribution of both sets of river data, showing the prevalence of soil-mantled hillslopes in these catchments.
Histogrammes de distribution globale des taux de dénudation et de production de sol (échelle logarithmique de base 10, en t km–2 an–1). (a) Taux de production de sol pour la plupart des sols (en gris, sources des données présentées dans le Tableau 1) et pour les pentes abruptes des montagnes San Gabriel (en blanc, Heimsath et al., 2012). (b) Taux de dénudation à l’échelle du bassin versant, déterminés à partir des isotopes cosmogéniques dans les sédiments de rivières (Portenga and Bierman, 2011). (c) Taux de dénudation à l’échelle du bassin versant, obtenus à partir d’une compilation globale des charges sédimentaires et dissoutes des rivières (Milliman and Farnsworth, 2011). Les flèches grises dans le panneau (a) indiquent la fourchette possible pour la valeur des 95 % de la limite du taux de production de sol (320 à 450 t km–2 an–1). Cette limite est dépassée dans des bassins versants drainant des chaînes de montagnes (panneaux b et c), à cause des processus d’érosion rapides dont les taux dépassent celui maximum de formation de sol. Le taux médian de production de sol, de 70 t km–2 an–1, est mis en évidence par un pic dans les deux distributions de données issues des rivières, ce qui montre la prépondérance des versants recouverts d’un sol dans ces bassins.
By comparison, millennial-scale, catchment-averaged denudation rates from the compilation of Portenga and Bierman (2011) range from ca. 5 to 11,800 t km−2 yr−1 (Table 1, Fig. 3b). The basins included in this compilation cover an area of 1.22 × 10⁷ km2. But, since this sum contains several nested catchments, the global coverage represents only a small fraction of the global drainage area of 9.8 × 10⁷ km2 (Milliman and Farnsworth, 2011). The bimodality of the cosmogenic nuclide-derived rates can be used to identify two distinct geomorphic regimes, as we discuss in the next section. A rough peak in the distribution is visible at ∼80 t km−2 yr−1, and a second maximum at ca. 320 t km−2 yr−1.
A similar picture for decadal-scale catchment denudation rates result from the analysis of river loads (Milliman and Farnsworth, 2011). Even though these rates extend to as high as 57,000 t km−2 yr−1 (Table 1), their median value is similar to that of the cosmogenic nuclide data (Fig. 3c).
3.3 Limits to soil production
The 70 t km−2 yr−1 median of compiled rates of soil production (Fig. 3a) is reflected as one mode in global catchment denudation rates (Fig. 3b). This peak represents the products of soil erosion in river sediment. The second mode visible in the catchment data, with a peak in its distribution at 320 t km−2 yr−1, can be attributed to a different geomorphic regime. This is one of active mountains, where the dominant transport process has transitioned from soil creep to threshold-slope driven landsliding (DiBiase et al., 2010), and where erosion is likely sufficiently rapid that a continuous soil cover does not prevail. Such a transition is consistent with concepts and data that suggest that soils thin with increasing denudation (Furbish and Fagherazzi, 2001; Heimsath et al., 1997), and that soil cannot be maintained locally when erosion exceeds some critical rate (Fig. 1b). To characterize this transition, we use the 95% cumulative distribution of SP to represent a global “speed limit” to soil production (SPlimit). While any statistical limit could perhaps be chosen as the benchmark, we regard this 95% definition as a meaningful characterization of global fluxes, as it encompasses the bulk of the global data while still allowing for maximum values from extreme settings. This SPlimit is 450 t km−2 yr−1; equivalent to 170 mm ky−1 (Table 1).
The hypothesis that, regardless of its actual value, a single, globally uniform SPlimit is valid for all geomorphic and climatic settings deserves to be challenged. Obviously, a statistical limit defined by the 95% distribution is strongly dependent on the choice of sampling locations, and might therefore not be representative at the global scale. We note that, for example, nearly 20% of the compiled rates come from a single study in the San Gabriel Mountains (Heimsath et al., 2012). Heimsath et al. (2012) report that regolith at this location is thin and discontinuous, and erosion processes range from soil creep to landsliding. Twelve of these samples are from regions with average slopes exceeding 30° and do not follow a consistent soil production function with more slowly eroding soils. Considering the overrepresentation of this extreme setting within our data set compared to their global distribution within soil mantled terrains, we believe that our defined 95% SPlimit is conservatively high. For example, if the 12 outlier samples from steep regions in the San Gabriels were excluded, the median, maximum, and 95% limit would be 66 t km−2 yr−1, 620 t km−2 yr−1; and 320 t km−2 yr−1, respectively (Table 1). However, we include these rates because they likely represent an important landscape at the threshold of soil cover.
A possible test for the hypothesis is offered by measuring soil production at extreme, steep settings in high, active mountains where catchment-wide rates are beyond our proposed SPlimit. If a universal value for SPlimit is valid, then measured SP would not exceed this SPlimit, despite catchment-wide rates that reflect rapid erosion. To our knowledge, two studies have been performed that allow such a test. In the first, soil-mantled hillslopes were measured in the steep Swiss Central Alps, where catchment-wide denudation rates range from 200 to 1200 t km−2 yr−1 (Norton et al., 2010). Soils sampled from 20 to 35° slopes had an average soil thickness of 50 cm. Measured soil production rates were relatively constant across basins, even those undergoing rapid erosion, and ranged between 60 and 270 t km−2 yr−1 (Fig. 4). This work suggested that even in a fast-eroding mountain belt, steep locations that are soil-covered are relatively slowly eroding. A different picture was obtained in the San Gabriel Mountains (Heimsath et al., 2012), as already discussed, where SP was measured in thin (0 to 30 cm), coarse-grained soils at a similar range of slope gradients (12 to 38°). Here, the authors reported soil production rates within catchments where average denudation had a similar range to the Alps (Fig. 4). Out of the measured 57 rates, 11 exceed the catchment denudation rate measured at these sites, and reach 1300 t km−2 yr−1. Hence only the Alps setting suggested a fixed limit to the rate of soil production. We have no conclusive explanation for these contrasting results. The thickness of Alpine soils was on average higher, but not significantly enough to explain the large difference in soil production rates (e.g., as would be predicted in Fig. 1b). For the San Gabriel case, it is possible that in such landslide-prone settings, the temporal steady state necessary to infer a matched rate of soil production is lacking; however, this is difficult to test for.

Comparison of soil production rates with associated denudation rates in catchments in high, steep mountain belts. Two studies allow direct comparison between denudation rates of local soils and their rapidly eroding catchment averages: the Central Alps (grey squares, Goms, Switzerland; Norton et al., 2010) and the San Gabriel Mountains, California (white diamonds; Heimsath et al., 2012). San Gabriel catchment rates were taken from Fig. 4b in Heimsath et al. (2012). The diagonal black line is the 1:1 line. Alpine soils are produced slower than the average catchments erode (suggesting a second, non-soil derived erosion processes contributing to river sediments), while some soil samples from the San Gabriel Mountains show SP exceeding the corresponding catchment rate.
Comparaison des taux de production de sol avec les taux de dénudation associés, dans les hautes chaînes de montagnes aux reliefs escarpés. Deux études permettent de faire une comparaison directe entre les taux de dénudation à l’échelle du sol et les taux de dénudation à l’échelle du bassin versant : les Alpes centrales (carrés gris, Goms, en Suisse ; Norton et al., 2010) et les montagnes San Gabriel, en Californie (diamants blancs; Heimsath et al., 2012). Les taux à l’échelle du bassin versant pour les montagnes San Gabriel proviennent de la Fig. 4b de Heimsath et al. (2012). La diagonale noire est l’équiligne. Les sols alpins sont produits plus lentement que les bassins versants correspondants ne s’érodent (ce qui suggère l’existence d’un autre processus d’érosion fournissant des sédiments aux rivières, mais n’ayant pas lieu dans les sols), alors que les sols des montagnes San Gabriel ont des taux de production de sol qui dépassent les taux de dénudation à l’échelle du bassin versant.
Despite the inability of these two studies to identify a single global speed limit to soil production, the existence of soil production functions (Fig. 1b) at sites as diverse as slowly eroding arid deserts (Owen et al., 2011), hilly grasslands (Dixon et al., 2009b; Heimsath et al., 1999, 2001a, 2006), forests (Heimsath et al., 2001a), and mountainous slopes (Heimsath et al., 2012) suggest that site-specific limits for soil production exist. These limits may locally be modulated by rock strength or climate (e.g., Pelletier and Rasmussen, 2009). Furthermore, a critical finding at both settings detailed above is that the extent of soil cover decreases with increasing catchment-wide denudation rates. This correlation demonstrates the threshold character of soil cover in mountainous environments. Therefore, there is clear evidence that as erosion rates increase – regardless of whether patches of soil can keep pace locally with the catchment average – these soils become increasingly isolated as the land surface transitions to a bedrock mantle.
3.4 Limits to regolith production
Do these soil production limits translate directly to limits for regolith production, including saprolite? Though soils comprise only the upper portion of the regolith profile, the observation that the percentage of outcropping bedrock increases with catchment erosion rate (Heimsath et al., 2012; Norton et al., 2010) indicates that the thresholds for soil production apply to the entire regolith profile. It has been suggested that the inverse relationship between soil thickness and soil production (Fig. 1b) can also be extended to regolith production, such that the thickness of the weathering layer decreases with increasing erosion rates. However, evidence for a whole regolith-production function has only been shown very broadly when comparing a few regolith thicknesses globally (Hilley et al., 2010; Pelletier and Rasmussen, 2009). Dixon et al. (2012) found in the San Gabriel Mountains of California that as erosion rates increase in soil-mantled terrain, deeply weathered saprolite layers are lost. At sites where denudation rates exceed ∼250 t km−2 yr−1, soils directly overly bedrock. This rate therefore represents the local speed limit to saprolite formation, which is lower than the limit to soil production found by Heimsath et al. (2012) for these sites. This study indicates that at sufficiently high erosion rates, the bedrock weathering front occurs at the boundary of soil production. Therefore the upper limits to soil production apply to the entire regolith profile and are the same as the limits for regolith production.
Lastly, we compare these soil production rates to rates measured by uranium series isotope compositions. Unlike cosmogenic nuclides, profiles of U-series isotopes in the regolith profile yield the rate at which regolith is produced from bedrock. They therefore record the propagation rate of the weathering front. In a recent compilation of these rates, Dosseto et al. (2012) found that regolith production rates in soil mantled landscapes fall within the middle of the range of 10Be-derived erosion rates and soil production rates determined by a previous compilation (Montgomery, 2007). This compilation, though limited, would appear to confirm that regolith and soil production rates are similar.
3.5 Rates and limits of chemical weathering
If regolith and soil have limits to their formation, do global data indicate limits to their associated weathering fluxes? We compiled weathering rates from 172 locations from which both soil production rates based on cosmogenic nuclides and CDFtotal from Zr-based mass balances were available (Fig. 5a, Table 1). In this regolith-derived database, weathering rates integrate across the entire regolith profile, although only a subset use corrected denudation rates following Dixon et al. (2009). These rates display a median of 20 t km−2 yr−1, a maximum of 263 t km−2 yr−1, and a 95% limit Wlimit of 151 t km−2 yr−1.

Histograms of globally distributed weathering rates (log10 based, in t km−2 yr−1). a: Soil weathering from cosmogenic nuclides and CDF in felsic crystalline lithologies; b, c: Catchment-wide weathering rates from river dissolved loads, corrected for atmospheric inputs. Dissolved loads from sedimentary lithologies (panel b) are corrected for non-silicic inputs. Fluxes from volcanic lithologies (panel c) are dominated by the large number of data from the Philippine Islands (Schopka et al., 2011). This data is shown in white as most of the Philippine catchments with weathering rates > 200 t km−2 yr−1 are from rivers draining unconsolidated pyroclastic deposits from the eruption of Mt. Pinatuba in 1991 (H. Schopka, pers. comm). Data in panel d comprises total dissolved fluxes averaging all lithologies and uncorrected for atmospheric inputs. Data sources in a to c are provided in Table 1. Data in panel d is from Milliman and Farnsworth (2011). The grey arrow shows the position of the 151 t km−2 yr−1 weathering speed limit derived from regolith weathering. All lithologies obey this limit, except for some Philippine rivers and rivers draining chemical sediment that were not corrected for atmospheric inputs from Milliman and Farnsworth (2011, panel d).
Histogrammes de distribution globale des taux d’altération (échelle logarithmique de base 10, en t km–2 an–1). a : taux d’altération dans les sols développés sur roches-mères cristallines felsiques, obtenus à partir des isotopes cosmogéniques et des CDF ; b, c : taux d’altération à l’échelle du bassin versant, obtenus à partir des charges dissoutes des rivières, corrigées des apports atmosphériques. Les charges dissoutes des rivières drainant des roches sédimentaires (panneau b) sont corrigées des apports non siliciques. Les flux provenant des régions volcaniques (panneau c) sont dominés par un grand nombre de données sur les Philippines (Schopka et al., 2011). Ces données sont présentées en blanc car la plupart d’entre elles indiquent des taux d’altération supérieurs à 200 t km–2 an–1, dus au fait que ces rivières drainent des dépôts pyroclastiques meubles, issus de l’éruption du Mont Pinatubo en 1991 (H. Schopka, comm. pers.). Les données présentées dans le panneau d sont des flux dissous totaux, non corrigés des apports atmosphériques, et incluent toutes les roches-mères. Les sources de données pour les panneaux a à c sont présentées dans le Tableau 1. Les données du panneau d proviennent de Milliman et Farnsworth (2011). La flèche grise indique la position de la limite de vitesse de l’altération à 151 t km–2 an–1, déterminée à partir de l’altération des sols. Toutes les lithologies respectent cette limitation de vitesse, sauf dans le cas de certaines rivières aux Philippines et dans le cas des rivières drainant des sédiments chimiques, dont les charges dissoutes n’ont pas été corrigées des apports atmosphériques (panneau d, Milliman et Farnsworth, 2011).
The hypothesis that silicate weathering is capped by an upper limit is best tested in high mountain belts with rapid erosion rates where Wlimit is likely to be encountered. Alpine soils weather at rates much lower than Wlimit, at 5 to 60 t km−2 yr−1 (Norton and von Blanckenburg, 2010). The fastest soil-based weathering rates come from the Mexican Jalisco Highlands (up to 170 t km−2 yr−1; Riebe et al., 2004), the southern Sierra Nevada, USA (up to 170 t km−2 yr−1; Dixon et al., 2009b), and the San Gabriel Mountains, USA (up to 260 t km−2 yr−1; Dixon et al., 2012) although the last are not based directly on 10Be measurements but instead modeled from soil thicknesses. These rates comprise the upper 5% of the weathering rate distribution, thus defining the 95% Wlimit.
When compiling the silicate weathering proportion from 146 globally distributed rivers we obtain similar values as those from soils, despite integrating across different geomorphic regimes. Specifically, silicate fluxes from catchments that erode even orders of magnitude faster than SPlimit do not exceed those observed in upland soils (Figs. 1 and 5). (Fig. 5b, Table 1). The median W is 13 t km−2 yr−1, which is close to the median rate measured in soils. The maximum is 101 t km−2 yr−1, and the 95% distribution is 63 t km−2 yr−1. These upper values are less than those measured in regolith, likely due to the fact that river fluxes integrate across lowlands, where weathering fluxes are overall lower than in the upland areas in which regolith weathering studies have typically been done. The difference might also be due to lithologic differences, in that the rivers data contains the higher abundance of recycled sediment (see section 3.7). We note that total weathering fluxes that include both silicate and carbonate components (compiled by Milliman and Farnsworth, 2011) have been reported as high as 1090 t km−2 yr−1. However, over 97% of the global area for which these total river loads are compiled (Milliman and Farnsworth, 2010) weathers at rates lower than the speed limits for soils and silicate weathering defined here. This observation stands despite the fact that Wlimit for regolith is defined primarily within granitic sites, while river loads integrate across multiple rock types. We discuss the role of lithology further in section 3.7. Given the agreement between the rates and limits of W from both soils and rivers, we suggest that Wlimit is a globally uniform property for silicate weathering.
3.6 Controls on a weathering speed limit
As we discussed, a limit to regolith production implies a limit in the associated regolith weathering flux. But, does a weathering speed limit require a speed limit to soil or regolith production? First, we note that the Wlimit is less than half of SPlimit. This guideline is relevant, as most rocks of granitic composition – in which most of these regolith-based measurements were made – lose ≤ 50% of their mass when they are converted from rock to soil (Fig. 2). At the corresponding CDF of 0.5, most weatherable minerals have been dissolved and the regolith comprises quartz and stable secondary weathering products. In such a case, weathering is “supply-limited” (e.g., Riebe et al., 2004; West et al., 2005), because continued weathering fluxes require fresh mineral supply to the weathering zone (Fig. 1c). Therefore, a clear limit for weathering in a supply limitation scenario is set by the combination of:
- • the maximum CDF attainable as determined by the proportion of weatherable minerals;
- • the limit to regolith production and;
- • the aerial extent of regolith (in the case of basin-scale weathering rates).
The maximum potential lowering rate of the bedrock weathering front may explain both Wlimit and SPlimit. Several mechanisms have previously been suggested, and these are:
- • the opening of pre-existing microfractures through the volume increase resulting from oxidation of ferrous minerals, mostly biotite, to iron oxides (Fletcher et al., 2006; Lebedeva et al., 2007);
- • a reaction-driven fracturing process in which weathering itself contributes to fracturing and division of bedrock into smaller domains, aided by volume expansion when secondary minerals precipitate in pores, thereby generating internal pressure (Jamtveit et al., 2011);
- • the formation of secondary porosity induced by the dissolution of plagioclase (Navarre-Sitchler et al., 2011);
- • the utilization of mesofractures by fungal hyphae to supply water and mineral-dissolving reagents (Graham et al., 2010).
All these processes allow for the penetration of corrosive fluids deeper into bedrock as weathering proceeds, and hence for the downward propagation of the weathering front and concomitant regolith production. Thresholds on these individual processes may in turn limit regolith production and weathering.
The efficiency of chemical weathering reactions should also play a role in limiting weathering fluxes. For example, in the granite example above, a soil CDF lower than 0.5 could result if the fraction of weatherable minerals within bedrock is < 50%, or if there is not sufficient time to weather the available minerals. The latter case is termed “kinetically limited”, because weathering fluxes are limited by the kinetics of chemical weathering reactions (e.g., Riebe et al., 2004; West et al., 2005). However, laboratory experiments result in weathering reaction rates on fresh mineral surfaces that outpace field-based weathering fluxes by several orders of magnitude (White and Brantley, 2003). We argue that the limit to weathering in this domain cannot be explained by mineral dissolution kinetics alone. Instead, numerical models have coupled weathering kinetics with speed limits to regolith or soil production to show that the response of weathering to increased erosion is nonlinear. These models (e.g., Fig. 1c) confirm that erosion can both help and hinder the associated weathering flux by controlling regolith thickness and due to the respective benefits of mineral supply and limitations of mineral residence time. Within regolith, faster erosion rates and shallower thicknesses mean minerals move rapidly through the weathering zone, leading to shorter residence time and hence a lower degree of weathering. For example, Ferrier and Kirchner (2008) predicted that weathering rates approach zero when denudation exceeds roughly half of the maximum soil production rate.
This decreasing efficiency of chemical weathering at high erosion rates is clearly seen when comparing both our compiled regolith and river-based weathering data. An analysis of compiled regolith-based data from active mountain belts and the remainder from upland and low-relief shield regions (Fig. 6) shows that local soils in these distinct geomorphic regions exhibit a similar range of chemical weathering intensity (CDF). However, river-derived measurements show that the basin-averaged weathering intensity from mountain belts tends to be far lower than that from low-relief landscapes. This lower weathering intensity can be explained by the relatively unweathered debris that these rivers might carry, once the dominant transport process has transitioned from soil creep to threshold-slope driven landsliding (DiBiase et al., 2010). Together, these data indicate that upland soils and regolith represent an important weathering environment for mountain belts, and one that is far more efficient than the average environment within such catchments. We argue here that the presence of soils is a requirement for intense weathering, even in mountain belts where their cover is reduced. Therefore, both predictive and empirical evidence is in place that suggests that Wlimit is a sensible concept, regardless of the existence and magnitude of a potential soil speed limit.
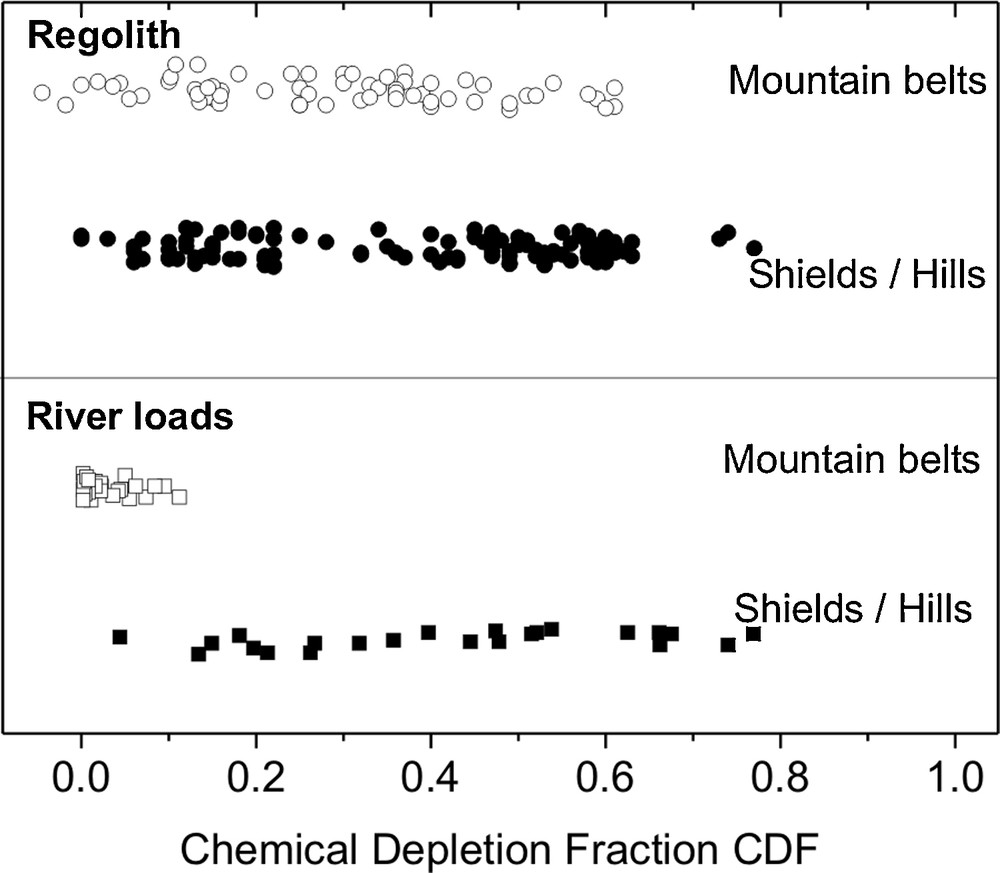
Chemical weathering intensity from regolith and rivers. CDF is an index of weathering intensity. “Regolith” CDFs are derived from Zr-based mass balances and “River” CDFs are derived from river loads, corrected for non-silicate contributions (river loads). Data sources are listed in Table 1. In the regolith panel, “Mountain belts” denotes data from Puerto Rico, Mexico, the Alps, the San Gabriel Mountains, and the Idaho batholith. In the river loads panel, “mountain belts” denotes rivers draining the Himalayas, the Andes, the Alps, Taiwan, and New Zealand. Note that these rivers exhibit very low weathering extents as shown by the CDF.
Intensité d’altération chimique à partir des sols et des rivières. CDF quantifie l’intensité d’altération. Les données sur les sols sont obtenues à partir de bilans de masse sur le zirconium (soils); celles sur les rivières proviennent des charges dissoutes transportées par les rivières, corrigées des apports ne correspondant pas à l’altération des silicates (river loads). Dans le panneau soils, mountain belts correspond aux données de Puerto Rico, du Mexique, des Alpes, des montagnes San Gabriel et du batholite de l’Idaho. Dans le panneau river loads, mountain belts correspond aux données de l’Himalaya, des Andes, des Alpes, de Taïwan et de la Nouvelle-Zélande. Il est à noter que les sédiments de ces rivières ont des CDF très bas et donc de faibles intensités d’altération, ce qui montre qu’ils ne sont pas significativement altérés dans les plaines d’inondation.
3.7 Role of lithology
A lithology-specific analysis of our compiled silicate weathering rates from river dissolved loads shows clear differences between three broad lithologic classes (Table 1, Fig. 5): felsic igneous, metamorphic, and mixed sedimentary rocks (n = 144), volcanic rocks (primarily basalts; n = 180), and rivers draining all global lithologies (n = 372, Milliman and Farnsworth, 2011).
First, we note that Wlimit is 151 t km−2 yr−1 for soils on felsic lithologies measured with cosmogenic nuclides and 63 t km−2 yr−1 from rivers draining felsic crystalline and mixed sedimentary lithologies. Also, mean, median, and maximum rates are all lower in sedimentary lithologies. Even though this difference may have its cause in the disparate methods and geomorphic environments sampled, it may be true in that sedimentary lithologies contain recycled rocks such as shales that have lower modes of weatherable minerals (Gaillardet et al., 1999a).
Volcanic rocks exhibit noticeably higher weathering rates than rocks of granitoid and felsic sedimentary composition, as has been previously noted by multiple authors (Dessert et al., 2001, 2009; Gaillardet et al., 2011). Dosseto et al. (2012) recently quantified with U-series isotopes that regolith production on basaltic rock also exceeded that on granitic and shale lithologies within similar sites in Puerto Rico. A recent review by Gaillardet et al. (2011) confirmed that volcanic arc islands exhibit some of the highest chemical weathering rates globally. Indeed, the 95% limit in volcanic rocks is 222 t km−2 yr−1, twice as high as that found on felsic soils. However, our volcanic database is strongly weighted towards rivers draining the Philippine island arc volcanics (Schopka et al., 2011), that comprise 79 of our 180 data. Of these, those rivers with W > 200 t km−2 yr−1 drain unconsolidated pyroclastic deposits from the Mt. Pinatuba 1991 eruption (H. Schopka, pers. comm). If we omit the Philippines data, the remaining 101 volcanic lithology-draining rivers yield a 95% limit of 106 t km−2 yr−1, which is more similar to the felsic soil value.
Dissolved data from all lithologies (Fig. 5d, Milliman and Farnsworth, 2011) yields a 95% limit of 490 t km−2 yr−1. This rate exceeds the Wlimit from all other individual lithologies. The higher range of weathering rates for this data set can be explained by the lack of correction for atmospheric input to this data, and by the fact that this data includes carbonate and evaporite lithologies. In carbonate rich settings, and in unconsolidated pyroclastic settings with abundant volcanic glass, CDFs can reach 100%. Therefore, we do not expect that our speed limits apply to such spectacular settings. However, if the data of 326 weathering rates from all river samples draining felsic, sedimentary, and volcanic lithologies (including the Philippines data, but excluding Milliman and Farnsworths uncorrected data) is pooled, our analyses uncover a median and 95% distribution of 27 and 162 t km−2 yr−1. These rates are near identical to those from regolith-derived weathering rates from felsic bedrock settings (Table 1), and this despite rivers draining reactive volcanic lithologies making up nearly a quarter of the compiled river-based rates. Considering that volcanic lithologies represent only approximately 5% of the continental area (Gaillardet et al., 2011), we suggest that our Wlimit broadly holds despite these lithologic differences.
3.8 Does silicate weathering take place beyond hillslopes, in floodplains?
Until this point, we have primarily discussed weathering fluxes originating within upland hillslope regolith. However, river loads integrate across all sources of weathered solutes, including lowlands, deep bedrock fractures and floodplains. Deep groundwater has been shown to contribute significantly to weathering fluxes, especially in volcanic terrains (Calmels et al., 2011; Schopka and Derry, 2012); although it is not clear whether these contributions are derived from waters percolating through regolith or from bedrock weathering along deep fractures. While a deep, non-regolith component could potentially be missing from some river loads in our compilation, such weathering would not significantly alter the low weathering intensities shown in mountain belts (Fig. 6).
One might expect high mountain belts that produce erosion products at rates far above SPlimit to produce near equally high weathering fluxes if this debris weathers in the alluvial deposits within the mountain belts or in the floodplains surrounding them (Derry and France-Lanord, 1996). Several recent studies have suggested that sediments may weather during storage and transport across floodplains, but that the extent of weathering is not large. Data from dissolved fluxes of rivers draining the Andes into the Amazon basin suggest that floodplain weathering may contribute an additional solute flux to the Amazon river over that derived from the Andean source of up to 25% (Moquet et al., 2011). Bouchez et al. (2012) used the composition of suspended sediment in the Amazon stream and its tributaries to show that the change in composition of this sediment by weathering during transport and storage is minor. In a similar study, Lupker et al. (2012) suggested that the Ganga river receives a weathering flux from the Gangetic plain that possibly exceeds the amount sourced from the Himalayan range. Common to these studies is that they do not provide evidence that a low degree of weathering rate in the mountain belt is increased to near Wlimit in the floodplain.
Our river compilation contains rivers from within mountain belts (New Zealand, Taiwan, Alps, High Himalayas) and the floodplains surrounding them (Andes-draining rivers from the Amazon basin). Still the fluxes from these systems are orders of magnitude lower than erosional fluxes (Figs. 1 and 5). In fact, the fluxes from these rivers do not exceed the Wlimit defined for regolith and soils.
One explanation for this lack in increase of W with E is that basin size and the associated discharge increase as rivers cross floodplains, leading to a reduction in both dissolved yield and sediment yield. In that case the inferred erosion rate from sediment yield would drop by the same extent as the weathering rate, whilst keeping CDF of that sample constant (Fig. 3). If however the sample weathers in the floodplain, a relative shift from the suspended load to the dissolved load would be apparent, and CDF would increase during this passage. We can search for such an increase by comparing CDFs for our rivers to CDFs from regolith (Fig. 6). We note that for soils, no pronounced difference in the distribution of CDF is visible when mountain belts are compared to lowlands, shield landscapes, and low-relief hilly landscapes. In contrast, while CDF measured by river loads spans a wide range from the latter settings, those measured in high-mountain belts and the surrounding regions are firmly grouped around very low CDF's (0 to 0.15), suggesting that their denudational flux experiences no pronounced shift from the solid to the dissolved loads. It may be that these CDF values would be even lower without the contribution of floodplains; however, any shift from the solid to the dissolved loads is not significant enough for CDFs from such rivers to approach the range of CDFs measured in mountainous regolith. Considering the low CDFs for rivers draining mountain belts and the fact such settings do not exceed weathering rates observed in soil mantled landscapes, we see no clear evidence that floodplain weathering artificially affects our quantification of Wlimit.
3.9 Do mountains matter?
Finally, we return to discussing the much cited paradigm that high active mountain belts are the most important sites of chemical weathering and associated CO2 drawdown (e.g., Raymo and Ruddiman, 1992). We argue in this paper that mountain belts of active and rapid erosion are inefficient sites of weathering due to their low weathering intensity (Fig. 6). This is the case even if their sediments are later weathered in lowland floodplains. Furthermore, it seems that the presence of regolith is a precondition for intense weathering, and that soil-mantled terrains are the most efficient sites of chemical weathering. Most importantly, the weathering fluxes from rapidly eroding settings do not exceed the Wlimit determined in upland soil mantled landscapes. Considering their small global area, such sites may not contribute substantially to global weathering budgets.
Acknowledgements
We are grateful to the French Académie des sciences and the organisers of the meeting “Altération et Érosion”, held in March 2012, and to Julien Bouchez for comments and the French translations. We thank two anonymous reviewers and associate editor François Chabaux for valuable comments and feedback. The concept developed here was stimulated by discussions at the European Earth Surface Processes Workshop 2010 in Potsdam, Germany on the relationship between physical erosion and chemical weathering.