

1 Introduction
In France, coastline areas represent 6% of the territory but up to 12% of the population live in these sensitive areas (Béoutis et al., 2004). Colas (2007) states that “24% of France's metropolitan coastline and 48% of sandy coasts are receding under the effects of marine erosion.”
The evolution of the coastline of Picardy, in the North of France, follows the same trend. To reduce the impact of erosion, the city of Quend-Plage (Somme, France) located northwest of Abbeville, decided in 2006 to initiate studies on different technical solutions to prevent local erosion.
For several years before the installation of a beach drainage system in 2008, Quend-Plage and its seawall have suffered significant erosion. The beach lost its dry sand and touristic activities moved toward the dune area. Such unauthorized occupation has caused accelerated erosion of dune foot.
The beach drainage solution was selected to fight against erosion. This technique was preferred for its experimental nature because no drainage system had been installed before in the North of France. Moreover, the project received financial supports shared between European and national funds. In order to validate the system setup, the “Direction départementale des territoires et de la mer” (French department authority) asked the “Syndicat mixte Baie de Somme–Grand Littoral picard” (SMBS-GLP) (local authority) a topographic, geomorphologic and granulometric biannual survey during late summer and late winter.
This article presents the results of a five-year survey (from June 2008 to September 2013) emphasizing the beach morphologic and granulometric evolution driven by weather conditions and sediment availability.
2 Presentation of the study area
2.1 Geological and morphological background
The Picardy coast belongs to the eastern English Channel area and extends from south to north over a distance of 60 km. It is mainly comprised of Upper Cretaceous sedimentary rocks covered by pebbles, silts and sands (Fig. 1A). The northern part, called “northern Picardy hydro-sedimentary Cell”, located between the “Baie de Somme” and the “Baie d’Authie” is made up of sandy beaches with high touristic potential (Fig. 1B), including the beach of Quend-Plage-les-Pins.
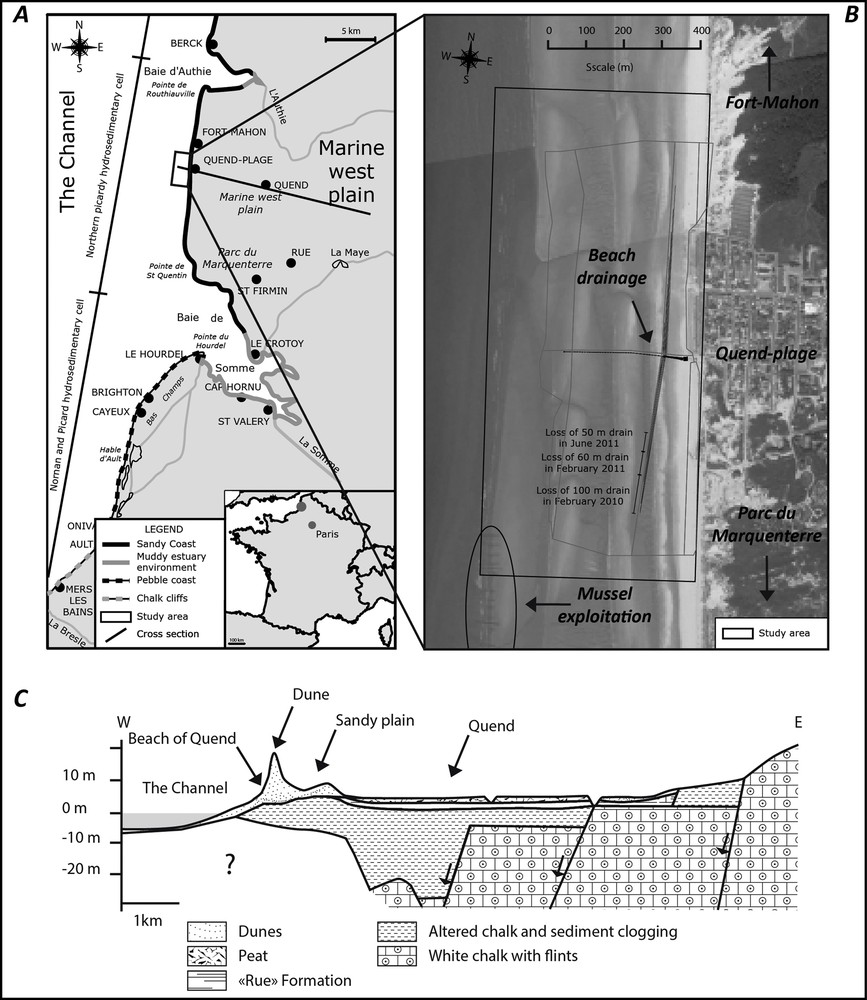
Location and geological characteristics of the study area. A. General location and sedimentary facies along Picardy coast. B. Study area (image source: Google Maps) with location of the drainage system. The dark rectangle indicates the surveyed area. C. Geological cross-section of the study area, modified from Louche (1997).
Quend-Plage is located on the chalky “Plateau picard” at the level of the marine west plain (Fig. 1A). Outcropping lithologies are mainly Upper Cretaceous flinty chalks; the dominant nearshore facies consists of well-sorted fine sands.
The current morphology (Fig. 1B) of the area is the result of the last postglacial transgression, the so-called “Flandrian transgression” (Anthony, 2002). During this increasing sea-level period, the coastal plain has been fed by transgressive marine sediments formed by dune and spit complexes (Fig. 1C).
Behind this dune complex (Fig. 1C), a swampy plain developed during the Early Holocene, mainly filled by peat, fine-grained sand and mixed silici-bioclastic silt (Bastide, 2011). According to the classification of Masselink and Short (1993), the beach of Quend-Plage belongs to the “intermediate” type. It is characterized also by a particular morphodynamic system of transverse bars and troughs called “longshore bar trough” (Davidson-Arnott, 2010). There are four systems of bars and troughs on the tidal flat (Fig. 2): the first one is associated with the foredune, the second one is observed on the upper tidal flat, the third one forms the medium tidal flat, and the last one is located on the lower tidal flat.
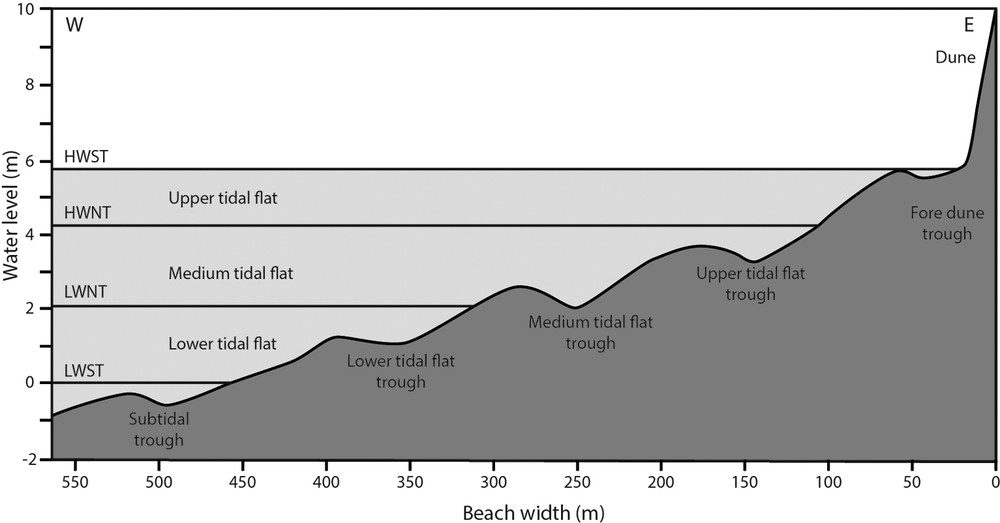
Morphology of the bars and troughs of Quend-Plage. HWST: high water spring tide; HWNT: high water neap tide; LWST: low water neap tide; LWST: low water spring tide.
2.2 Wind, wave and tide conditions
According to its location in the eastern English Channel, the Picardy coast is defined as a mixed wave-tide-dominated environment (Anthony et al., 2004).
The study area has a semidiurnal macrotidal regime, with a mean spring tidal range of about 5.5 m (Fig. 2).
The Picardy coast has a contrasted temperate and oceanic climate. Indeed, the proximity of the North Atlantic Ocean leads to climate disturbances related to depressions and anticyclonic conditions (e.g., “Azores anticyclone”).
Bastide (2011) defined two wind regimes. The main winds come from the southeast and the northwest. On the other hand, the strongest winds rather come from southwest to WNW sectors (Fig. 3A).
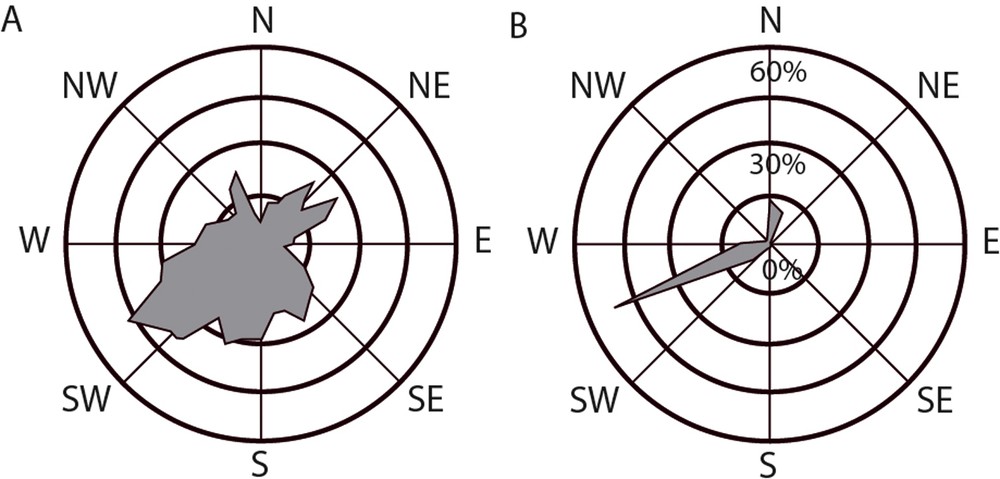
A. Wind rose diagrams in (Anthony et al., 2006), B. Swell rose diagrams (CANDHIS data: http://candhis.cetmef.developpement-durable.gouv.fr/).
Waves are characterized by low to moderate heights (less than or equal to 0.5 m in average) and mean periods Tm of 4 to 6 s (CANDHIS data). Swell comes mainly from 250–280°N sector (SOGREAH, 1994) with average height less than 0.5 m (Fig. 3B). They generate a south–north littoral drift of approximately 0.31 m·s−1 deduced from the CERC formula (1984).
Several storms occurred during the five years of operation, including the major storms “Xynthia” (winter 2010, a four-day storm with winds reaching velocities up to 160 km/h), “Joachim” (December 2011, a three-day storm with winds at 150 km/h), and “Andrea” (January 2012, a three-day storm with winds at 110 km/h) followed by two other storms in April 2012 and winter 2013–2014.
2.3 Anthropogenic modifications
The studied area is strongly anthropized because of the economic and attractiveness of the seaside towns of “Quend-Plage” and “Fort-Mahon-Plage”. Nearly 1 million tourists per year visit the Picardy coastline. After tourism, the economic activities of the region are linked to coastal resource exploitation such as mussel farming and harvesting of marine worms, cockles (Cerastoderma edule), and samphire (Salicornia). Mussel farms are located in the southern intertidal zone of Quend (i.e. updrift of the study area with respect to the dominant littoral drift direction, Fig. 1B) over a length of more than 4 km and a width of 200 m distributed on a total of approximately 20,000 piles; each pile is 4.5 m high with a buried part 2.5 m below the sandy seafloor.
2.4 Beach drainage
2.4.1 Background history
The beach drainage system is the result of an incidental finding in 1981 by the Danish Geotechnical Institute [Danish Geotechnical Institute (DGI), 1992; Koster, 1994]. The drain generates three effects: a dewatering of the beach face/a lowering of the water table, an enhanced infiltration of the swash run-up allowing the settling of suspended particles, and a grain reorganization decreasing the bulk volume porosity and increasing the sand compactness.
Several beach drainage systems have been tested worldwide before Quend-Plage. Most of them are located in Europe and in microtidal environments: three in Denmark [Danish Geotechnical Institute (DGI), 1992], one in Italy (Ciavola and Vicinanza, 2008), and one in France (Lambert et al., 2006). Other countries have also tested this method to fight against erosion like Australia (Davis et al., 1991; Turner and Leatherman, 1997) or the USA in Florida (Woodruff and Dean, 2001). Only three sites were setup in macrotidal environments including two in France: Les Sables-d’Olonne in Vendée and Villers-sur-Mer in Normandy (GRESARC, 2007).
2.4.2 Quend-Plage setup
The equipment installed on the upper tidal flat in September 2008 is located 50 m west of the seawall (Fig. 1B). It consists of a north–south-oriented drainage pathway 5 m wide and 900 m long, buried at an average depth of 1.5 m. The pathway is composed of 5 parallel drains of 160 mm in diameter connected to a main manifold. The water drained is pumped and then evacuated to an equilibrium chamber. During low tides, the water is discharged from the equilibrium chamber by gravity via an east–west-oriented discharge pipe. A dissipative chamber is located at the outlet of this pipe to reduce the erosive effects of the hydraulic discharge.
Unfortunately, the equipment suffered several damages during these five years as a result of cumulative effects of storms and system malfunction.
3 Methodology of beach survey
3.1 Topography acquisition and analysis
In the context of the “Quend-Plage” study, topographic and granulometric data were acquired during five years between June 2008 and September 2013 (Fig. 4 and Table 1), during biannual campaigns. Between 2008 and 2011, data acquisitions were carried out in June and December. In 2010, it was decided to perform sampling and topographic campaigns in April and September (Bain, 2010). Indeed, from September to April, low-pressure conditions are common and favor coast erosion, while between April and September, anticyclonic activity reflects a quiet period dominated by beach accretion.
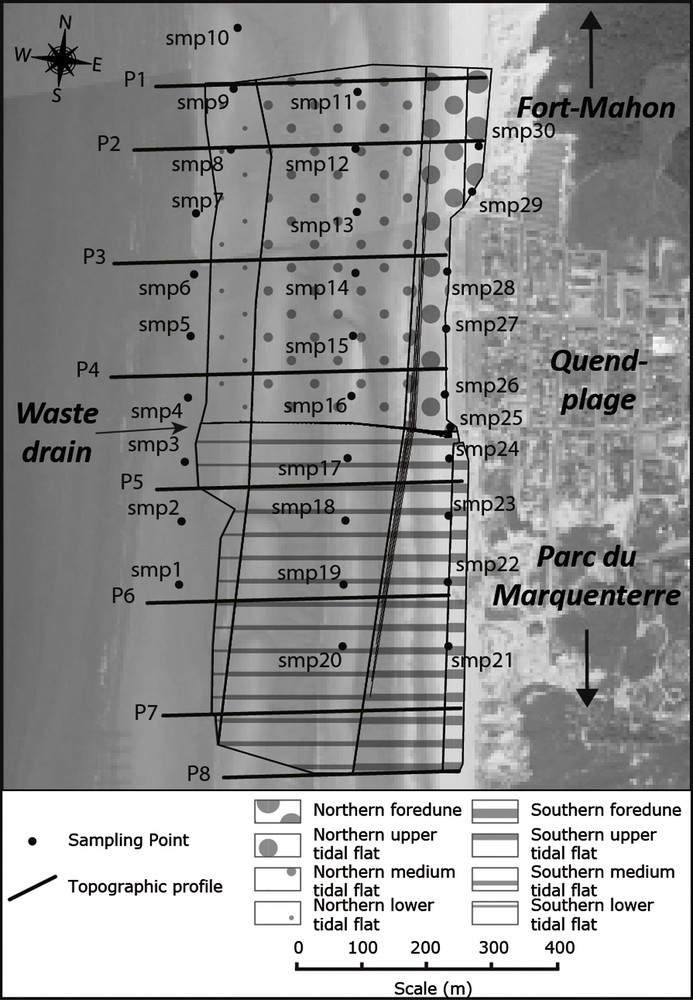
Division of the study area in units and morphological subunits, and location of the beach profiles (P1 to P8) and of the sediment samples for grain-size analyses (smp1 to smp30).
Image source: Google Maps.
Action calendar of the surveys between 2008 and 2013.
| Year | Done by | Topographic survey period | Methods | Type of survey |
| 2008 | June | |||
| December | ||||
| 2009 | Marc Devins | June | Tachometer | Topography |
| December | ||||
| 2010 | June | |||
| December | ||||
| 2011 | March | |||
| November | ||||
| 2012 | LaSalle | April | DGPS | Sand sampling and topography |
| September | ||||
| 2013 | September |
From 2008 to 2010, topographic survey data were acquired using a tachometer. Since 2011, the topographic survey was carried out continuously using a Trimble DGPS GeoXT (GeoExplorer 2008 series). Topographic point acquisition followed a 10–15-m grid with a period of 5 s of recording time in order to have a sampling as fine as possible to model the beach morphology and achieve Digital Elevation Models (DEM). The acquisition method has been called “the free Base with mark”. These different methodologies were used to evenly cover the study area. Only data with accuracy lower than 10 cm in x, y, and z after the post-treatment were selected for the realization of Digital Elevation Models (DEM).
Topographic data processing was performed using a Geographic Information System (GIS – ArcGIS©), with automated processing chains (called Model Builder) to be reused for each campaign. Measurement points were interpolated using the Natural Neighbours methods to generate the DEMs. The cell size was set to 10 m, which corresponds to the minimum spacing between the survey points.
The sedimentary and geomorphological analysis was performed according to the four main morphological units of the study site, each unit measuring 1 km in length and 150 m in width:
- • foredune;
- • upper tidal flat;
- • medium tidal flat;
- • lower tidal flat (Figs. 4 and 5).
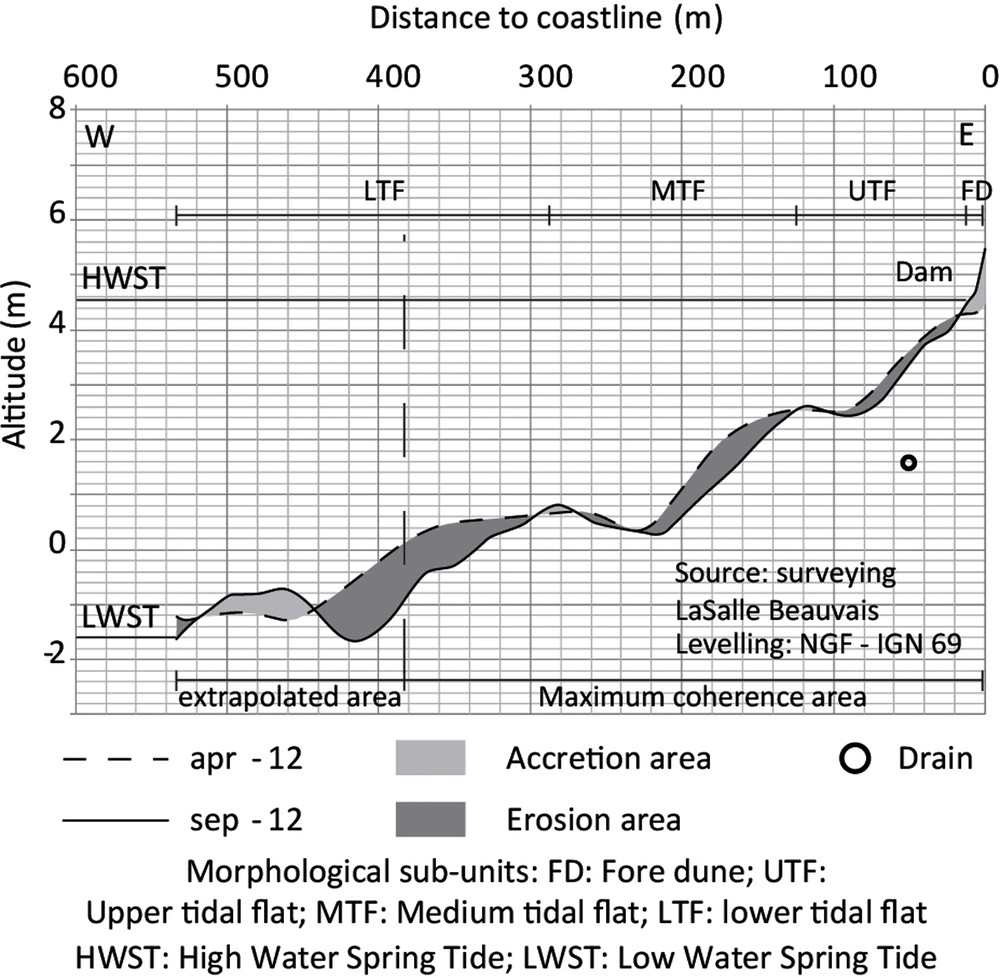
Example of two successive beach profiles compared to image the areas in erosion and in accretion between two periods.
These units were then split into two parts according to their position relatively to the east–west-oriented waste drain (Fig. 4). A total of eight subunits located on both sides of the waste drain were analyzed using the GIS, in order:
- • to study cross-shore beach profiles, and define “beach equilibrium” profiles;
- • to calculate eroded or accreted volumes between two acquisition campaigns, as well as the thickness of the displaced volumes;
- • to characterize the orientation and evolution of the bars and troughs.
The morphologies of beach equilibrium profiles were initially defined by Hallermeier (1981), improved by Masselink et al. (2006) and Davidson-Arnott (2010) and modelled by Dean (Dean, 1991; Dean and Maurmeyer, 1983) under the assumptions of a unique representative grain-size and wave regime, and a continuous profile without morphological perturbations. This concept has been many times criticized by Pilkey et al. (1993), Cowell et al. (1999) and Are and Reimnitz (2008). On the study area, the presence of cross-shore and longshore grain-size changes and of bars and troughs across the tidal flat prevents from any analytic prediction of beach equilibrium profile.
As a consequence, we defined herein the equilibrium profiles for each transect as the average of individual beach profiles acquired during the five-year survey. The equilibrium profile is bounded by the Maximum Extension Accretion Limit (MEAL) and the Maximum Extension Erosion Limit (MEEL) corresponding respectively to the upper and lower envelopes of the beach cross-shore profiles (Fig. 6). These two limits are defined graphically (Fig. 7).
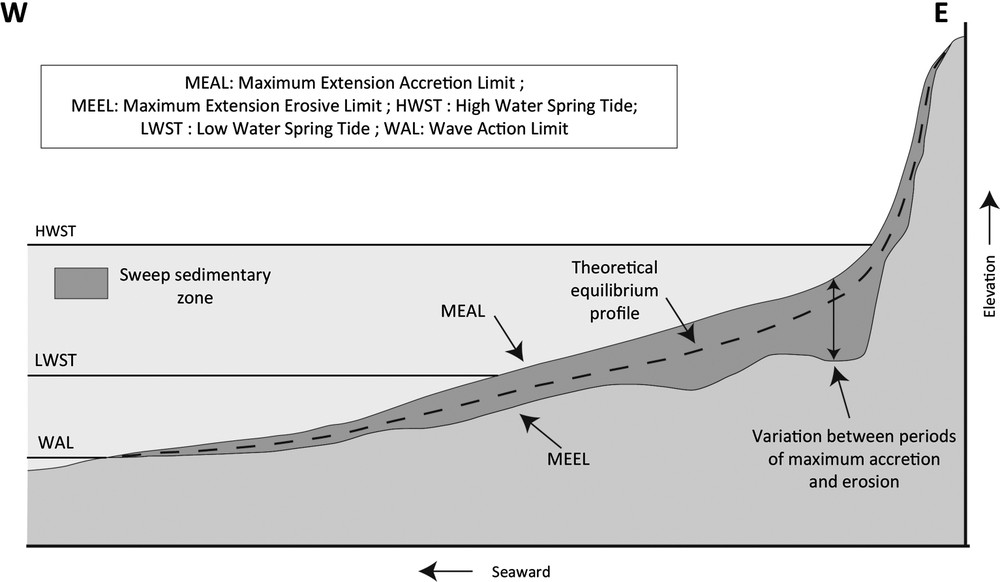
Theoretical beach profile modified from Hallermeier (1981).
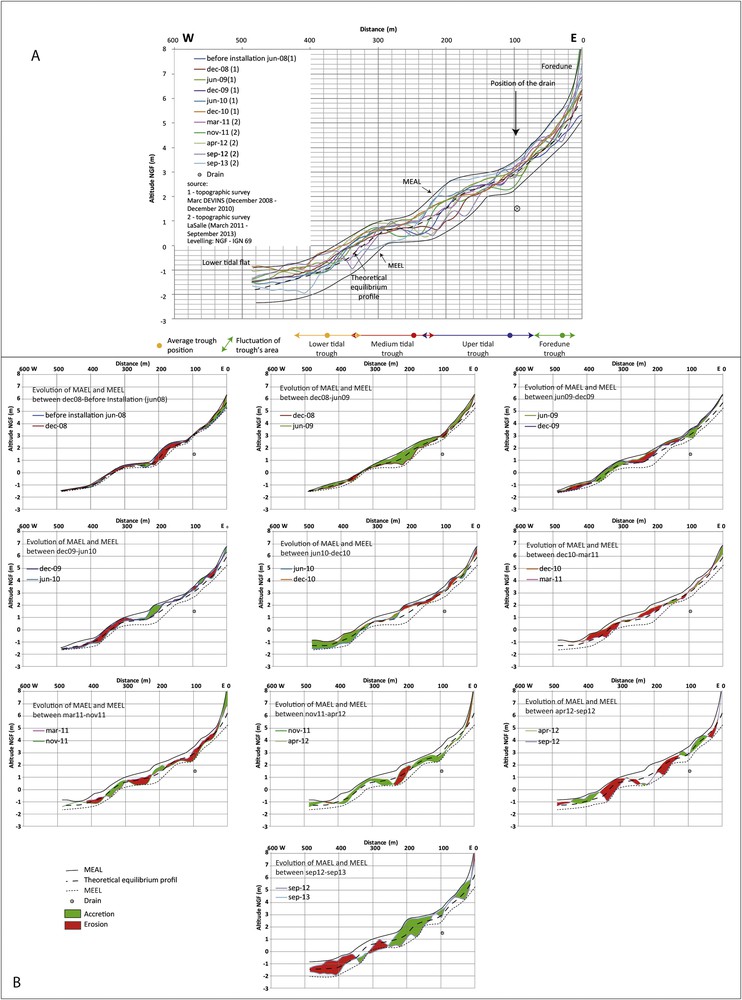
Example of beach profile evolution on the study area. A. Individual topographic profiles on section No. 5 over the whole survey period (2008–2013) and determination of Maximum Extension Accretion Limit (MEAL), Maximum Extension Erosion Limit (MEEL) and theoretical equilibrium profile (average topographic profile). B. Evolution of MEAL and MEEL through time.
3.2 Sediment sampling and grain-size analysis
Since 2009, sediment samples were collected to determine the influence of the beach drainage system on the particle size. Sand samples were collected manually on the different geomorphological units of the beach, from the coastal dunes to the lower tidal flat (Figs. 3 and 8).
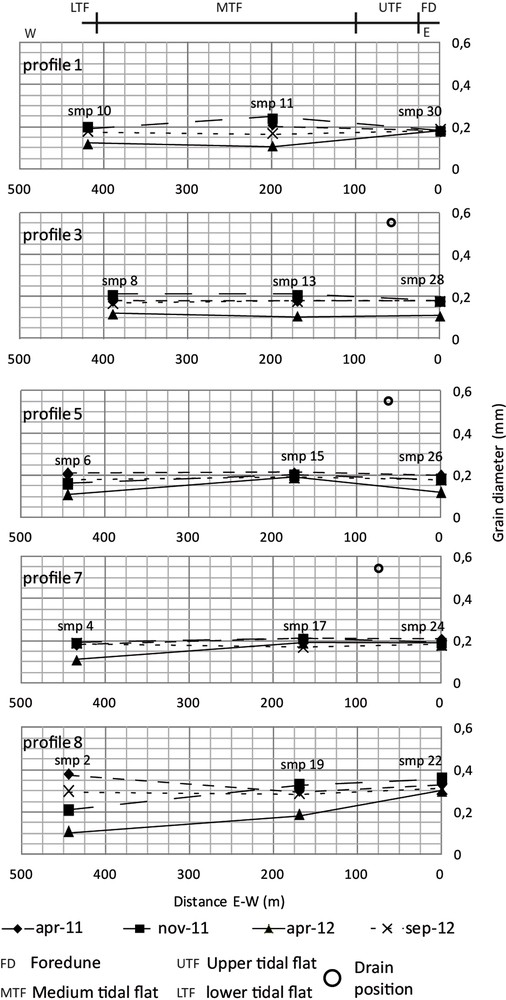
Cross-shore grain-size profiles (D50) (cf. Fig. 4 for sample point – smp – location).
A grain-size analysis was performed on the samples following the Wenttworth (1927) methodology (dry sieving of PHI standard) and recommended by Chalumeau (2003). The D10, D50, and D90 grain-size parameters were mapped and generated in the GIS by the “inverse distance weight” method, adapted to better understand the spatial distribution of these grains.
4 Results and discussion
4.1 Morphology of the bar and trough system
Comparative time study of topographic profiles allowed defining the morphological evolution within the MEAL and the MEEL (Figs. 6 and 7). The beach, under the influence of drift currents, waves and tides, evolves constantly. The MEAL and MEEL limits correspond to the fluctuation of bars and troughs driven by semidiurnal tides, fortnightly tidal cycles (neap-spring-neap cycles), and seasons (Cowell et al., 1999).
We can assume the existence of a trough in the nearshore, which corresponds to the surf zone at low spring tide water level. In some sectors, envelopes of evolution can overlap (Fig. 7). These overlaps take place at the level of the trough drain channels. This study helped also observe and quantify a rotation of the troughs in the study area (Fig. 7 and Table 2).
Evolution of the trough orientation into the different morphological subunits (orientation in degrees relative to the true north).
| Period | |||||||||||
| Before installation | 12-2008 | 06-2009 | 12-2009 | 06-2010 | 12-2010 | 03-2011 | 11-2011 | 04-2012 | 09-2012 | 09-2013 | |
| Morphological subunit | |||||||||||
| Foredune | 13.5 | 6 | 4 | 9 | 5 | 6 | 6 | 2 | 6 | 2 | 4 |
| Dam | 5 | 5 | 5 | 5 | 5 | 5 | 5 | 5 | 5 | 5 | 5 |
| Upper tidal flat | 8 | 7 | 6 | 9 | 7 | 8 | 8 | 8 | 8 | 8 | 8 |
| Medium tidal flat | 7 | 7 | 5 | 7 | 6 | 7 | 5 | 2 | 3 | 5 | 5 |
| Lower tidal flat | 5 | 1 | 5 | 2 | 2 | 5 | 7 | 1 | 1 | 0 | 4 |
After the installation of the drainage system, the trough of the foredune evolved quickly to stabilize between azimuths 2° and 9°. These changes are the combined results of winds, tides and drainage system. The trough underneath the seawall did not evolve. This stability can be interpreted as the action of the backwash coupled with the proximity of a concrete structure on the upper tidal flat reflecting the waves during spring tides.
The azimuth of the upper tidal flat trough did not change significantly, and remained at 8°N. This direction stability of the troughs matches with the action of the beach drainage on the upper tidal flat.
Medium and low tidal flat troughs experienced a rotation of 1–4° counterclockwise. The reorientation of mid and low intertidal zone troughs is the result of movements of sedimentary stocks towards the upper intertidal zone and the foredune. These sedimentary movements cause a reorganization of the morphological subunits of the beach. One can also assume that the hydraulic dunes and the nearshore troughs also undergo a morphological reorganization.
4.2 Equilibrium beach profile of Quend-Plage
Height equilibrium profiles (Figs. 4 and 7A) were calculated by averaging 11 cross-shore altimetric sections, creating profile bundles (Komar, 1998; Robertson et al., 2008) to analyze the beach geomorphological changes through time.
The theoretical profile is stable through time (Fig. 7B), and remains confined in the envelope bounded by MEAL and the MEEL (Fig. 7). When the beach profile stability is not reached, the position of MEAL and LEME changes through time and space (Fig. 7B). The boundary between the medium tidal trough and the lower tidal trough acts as a by-pass area and remains fairly stable from December 2008 to September 2013. Moreover, between November 2011 and September 2013, the beach evolves from a former relatively smooth profile (December 2008 to November 2011) to a rougher one with very well individualized bars and trough morphologies (Fig. 7B).
In the northern area, the stabilization of the average beach profiles around the theoretical equilibrium profile is observed, while on the southern zone the variability of the morphological profiles around the theoretical equilibrium profile is still high. During the winter season, the beach is subjected to the action of storms. They have an erosive action on the foredune and/or the upper tidal flat. Sedimentary stocks moves in cross- or longshore directions according to the current drift or wind action. During the summer period, the beach is subjected to thermal breezes. These breezes allow sand remobilization towards the upper part of the foreshore.
4.3 Sediment grain-size
On cross-shore profiles (Fig. 8), the particle size remains globally homogeneous over the study period. As for the longshore profiles (Fig. 9), only the April 2012 period shows grain-size variations. During this period, sediment partitioning occurred: medium to coarse sediments are limited to the southern part of the study area (northern part of mussel farm), whereas finer sediments are redeposited northward. The time-lapse mapping of particle size distribution helps understand the effect of the drainage system. On all maps, grains are slightly coarser immediately downstream of the drainage system (eastern part of the medium tidal flat), averaging 1.8 mm in diameter, whereas the other sub-morphological units are mainly comprised of finer sediment ranging from 0.1 to 0.14 mm in diameter.

Longshore grain-size profiles (D50) of the upper, medium and lower intertidal zone (cf. Fig. 4 for sample point – smp – location).
This grain-size geographical distribution is influenced by the position of the drain. It reacts geographically and temporally to changes in the system (Fig. 7). The successive drains damaged (Fig. 1B) resulted in a coarser grain-size and a northward migration of coarser particles.
4.4 Sediment budget
The cross-shore profiles and resulting DEM were compared to monitor the erosion and accretion areas and to define the equilibrium profile (Figs. 5–7 and 10). Erosion–accretion areas vary from one morphological unit to another and from one sector to another. However, erosion zones are generally observed in the lower and middle tidal flats in both the southern and northern parts, while the upper tidal flat and the foredune tend to accrete, although some small erosion areas can be found. DEMs were also used to estimate the thickness of sand above the drain, as well as the volumes of accretion and erosion between survey periods. Figs. 11 and 12 report the evolution of the sedimentary stocks respectively for each morphological units and subunits according to their position relatively to the waste drain (north or south), and globally for the whole sedimentary system. The overall eroded sediment volume roughly equals to 4200 m3. Over the studied period, the upper tidal flat and the foredune are in accretion, whereas the medium and lower tidal flats are in erosion (Fig. 11).
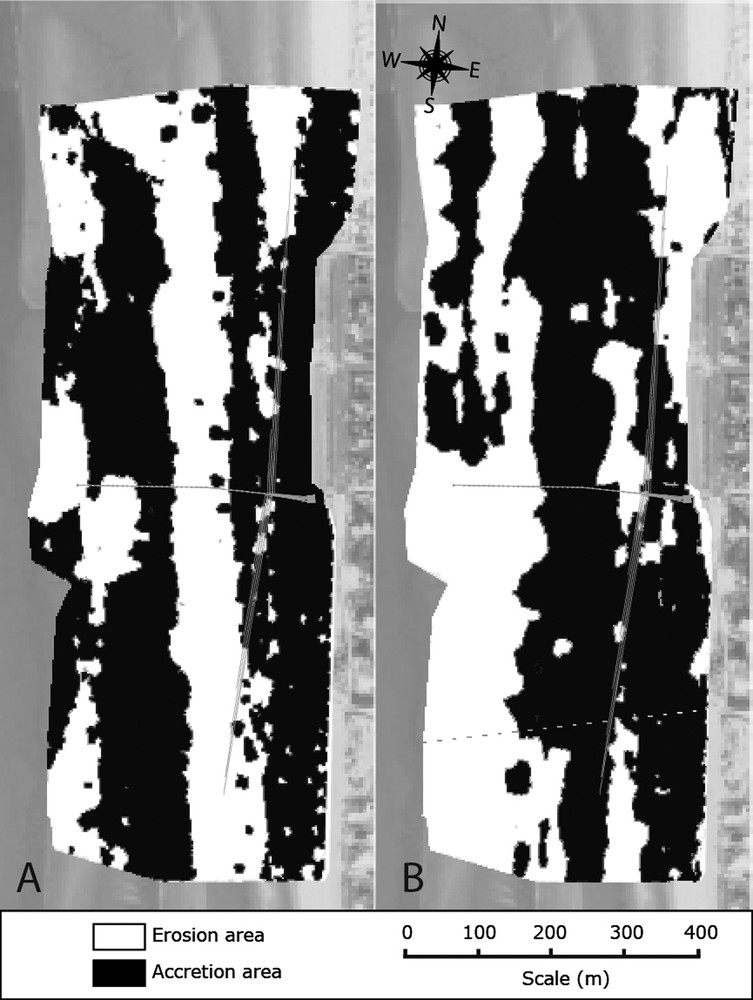
Example of cut and fill maps. A. Period before drainage system installation (June 2008–December 2008). B. September 2012–September 2013.
Image source: Google Maps.
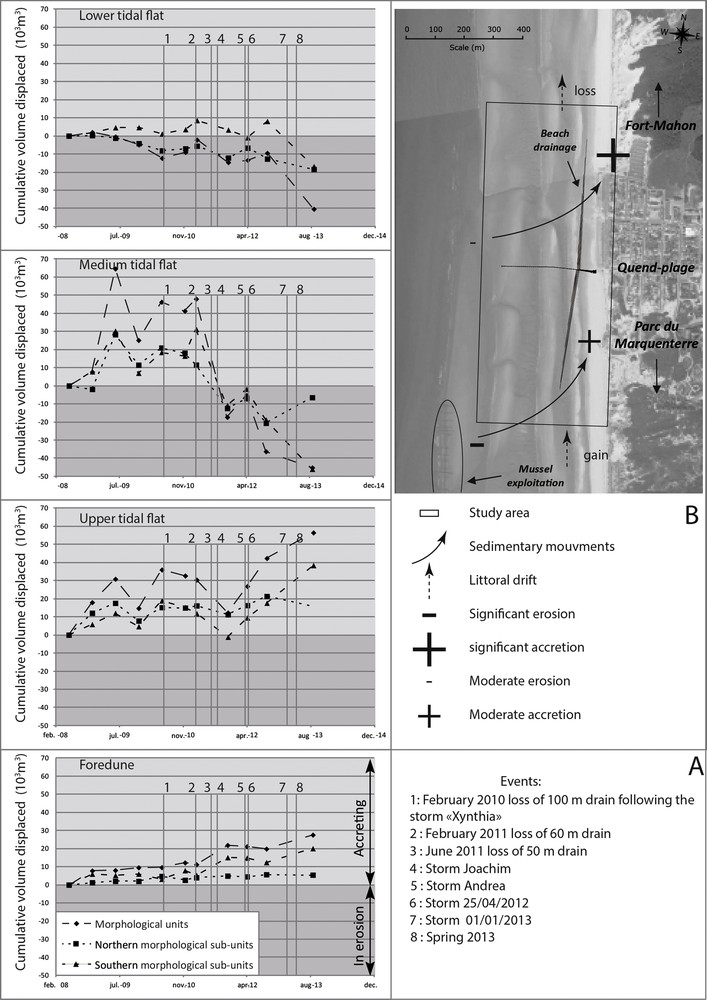
A. Evolution of the sedimentary movements of Quend Beach between June 2008 and September 2013 (sediment volume × 103 m3). B. Synthetic figure representing major sedimentary displacements.

Cumulative volumes of eroded and accreted sediment at scale of the whole surveyed area between June 2008 and September 2013 (numbers on the curve refers to storm events listed on Fig. 11).
The analysis of the volumes involved between each survey (Fig. 12) allow us to define three successive stages of evolution:
- • a significant accretion phase until June 2010, despite a period of erosion during autumn 2009;
- • a period of stability from June 2010 to March 2011;
- • a stage of erosion from March 2011 to September 2013, despite an episode of accretion in April 2012.
A clear correlation is deduced by coupling the stormy events and the system behavior (Figs. 11 and 12). The first period corresponds to an optimum stage of the drainage system efficiency. The second stage is a period of readjustment after the storm “Xynthia” (from 26 February to 1 March 2010) and the loss of a portion of the southern drainage system. The third period corresponds to successive major storms and subsequent damages on the drain.
It is important to compare and study variations in sediment volumes of morphological subunits (Figs. 11 and 12). As defined in the methodology, each part of the beach (upper beach, dune foot…) can be considered as a compartment of the sediment cell. Each compartment forms a sedimentary stock. This sedimentary stock will evolve depending on tides and forcing agents. It can interact with:
- • the upstream and downstream hydraulic compartments;
- • the landward and seaward compartments;
- • neither of them.
The trends are illustrated on Fig. 12. Since the establishment of the drainage system, the foredune is constantly in accretion. The upper tidal flat tends to strongly accrete with few stages of significant erosion, especially during December 2009 and in September 2011. Between the installation of the system and June 2010, the medium tidal flat followed the global sedimentary cycles characterized by accretion during summer and erosion during winter. From June 2010 to April 2011, displaced volumes are stable. They correspond to the stage of stabilization of the system after the loss of a portion of the southern drain. Since April 2011, the medium tidal flat is in erosion. Concerning the lower tidal flat (Fig. 12), the southern sector presents few periods of accretion, but whatever the period, its overall tendency is toward erosion.
Considering the sediment movement between subunits of the beach areas, we can see a shift of the sedimentary stocks from the lower tidal flat to the upper tidal flat (Fig. 11A and B). This movement is particularly well expressed in the northern area. Moreover, no significant changes were observed outside drainage areas (150 m to the north and south, profiles 1 and 8).
4.5 Action of beach drainage system
Sediment movements can be explained by several combined actions. The first one is related to the drying up of the upper tidal flat induced by the drainage of saline groundwater during low tides, allowing the remobilization of dry sand by sea breezes toward the upper foreshore and dune foot. The second action is generated by the disequilibrium caused by the shift of the sedimentary stock from the upper tidal flat to the dune foot. This imbalance is observed by the modification of the beach profile (Fig. 7). Sedimentary stocks of medium and low foreshore are mobilized to fill the gap created between the upper foreshore and the dune foot.
Several storms were recorded during the studied period. As expected, these storms have had an erosive impact on the entire beach. However, the presence of the drainage system allows a quick return to the initial state by accretion on the upper tidal flat as on the dune foot (Fig. 10).
There is also a strong erosion of lower and medium tidal flat. This trend may be linked to:
- • a double transfer of sediments to the top of the beach and to the downdrift compartment;
- • the presence of the mussel farm, which dampens wave and current energy and traps coarse sediments.
On this part of the beach, the drainage system efficiency seems to be nil.
5 Conclusion and perspectives
This study reports the sedimentary and morphodynamic evolutions of the Quend-Plage beach following the installation of a drainage system in September 2008. The surveyed area covers the entire drainage system divided in two 400-m-long areas north and south of the cross-shore waste pipe, plus two 150-m-long areas outside the influence of the drainage system. Field data permit to conclude that the northernmost 150-m-long beach stretch seems to remain under the influence of drainage. However, this band is not wide enough to define the presence or not of a potential zone of transition between the drained and undrained areas.
The southern sector lies between the drainage system and the mussel area. This area evolves with fast morphological adjustments after each drain loss. The large mussel farms seem to disturb the hydrodynamic behaviour of the northern Picardy hydro-sedimentary cell, as described by Cayocca (2005) and Bahé (2003) for the northern mussel farm of the Bay of Mont Saint-Michel.
As demonstrated by Curtis et al. (1996) and Curtis and Davis (1998), the beach drainage system directly influences the beach morphology, the sediment availability and mobility, as well as the particle size distribution.
The major influence of the beach drainage system lies in the modification of sedimentary movement and morphological evolution (Bruun, 1989; Ciavola and Vicinanza, 2008; Curtis and Davis, 1998). The sediment movement deduced from the topographic profile survey is reoriented from the lower beach (lower and middle tidal flats) to the upper foreshore (subunits of the upper tidal flat and the foredune).
Like all beaches, the beach of Quend-Plage reacts strongly to storms. In contrast to the results obtained by Vicinanza et al. in 2007, (Vicinanza et al., 2010), after periods of storm, the beach drainage allows a faster recharging of the upper part of this macrotidal beach.
These sedimentary movements cause a complete reorganization of the beach morphology, with significant erosion of the lower and middle tidal flats while the upper tidal flat and the foredune are accreting. As explained by Ciavola and Vicinanza in 2008, the drain dries out the high intertidal zone, allowing the remobilization of sand by the sea breezes towards the foredune. These movements cause an imbalance in the sediment budget of the upper tidal flat compared to the other subunits. The sediment deficit compared to the morphological units in the top foreshore generates, in turn, a migration of sand from the lower and middle tidal flats towards the upper intertidal zone. It is likely that the nearshore is also impacted by the movement of sediment stocks. Beach morphology may change if the drainage system is damaged. It was the case during the various storms that occurred from 2008 to the present day. The areas affected by the loss of a portion of the drain experienced a complete readjustment of their morphology. Regarding the sediment balance, it is slightly negative over the study period. Considering the sediment balance of each subunit, the subunits of the upper beach are accreting while subunits from the lower beach are eroding. This pattern confirms sedimentary stock mobility and redistribution.
The results presented here show the evolution of a small part of the North Picardy coastline, which can be defined as a whole as a hydro-sedimentary cell (Fig. 1A). Hence, for a better understanding of the evolution of the Quend-plage beach, several actions should be performed at the scale of the whole North Picardy cell:
- • a global topographic survey by Unmanned Aerial Vehicule (UAV) or DGPS. This action is in progress since September 2011 and consists in observing and mapping the movements of sediment stocks for a better understanding of the sedimentary mechanisms of the cell;
- • land surveying. Since February 2012, winter topographic surveys are concentrated on key sectors (Fig. 1A): upstream of the cell between the “Pointe de St Quentin”, “mussel zone”, “Quend-plage”, “Fort-Mahon” and the “Pointe de Routhiauville”. The study aims in understanding the relative sediment movements between the different compartments of the cell;
- • one time topographic surveys could be considered just after significant storm events in order to study the response of the cell (or parts of it) and its resilience over time.
Acknowledgments
This work was done in collaboration with the SMBS-GLP following “the beach monitoring contract” after the setup of beach drainage system at Quend-Plage.
We acknowledge the SMBS-GLP and ECOPLAGE Company for the use of various data collected during field campaigns. We thank the Polytechnic Institute LaSalle Beauvais, including members of the B2R research team for their help, support, and suggestions. Thanks to all the students of the Polytechnic Institute LaSalle Beauvais who participated in the acquisition campaign and their involvement in data processing. We appreciate the suggestions coming from the reviewers Dr. Sophie Le Bot and Dr. Remi Bellon, as well as from Dr. Pierre Weill and Dr. Bernadette Tessier, Editors of this thematic issue for their reviews.