

1 Introduction
The way the Earth's mantle convects is essential for understanding the material cycling and the thermal evolution of the Earth. The convective flow causes not only material transport but also differentiation associated with chemical reactions; for instance, upwelling flow beneath mid-ocean ridges causes adiabatic decompression melting to produce the oceanic crust, which extracts incompatible elements effectively from the mantle (McKenzie and Bickle, 1988). Cycling of such differentiated materials via plate divergence and subduction produces compositional heterogeneities in the Earth's interior. However, the resultant compositional structures of the Earth's interior are largely unknown. Various convection models and possible compositional structures of the mantle have been proposed, such as those described in the comprehensive reviews by Hofmann (1997) and Tackley (2000), which included (a) two-layered convection without or with some mass leakage between the two layers (e.g., Allègre, 1997; Jacobsen and Wasserburg, 1979; OʼNions et al., 1979), (b) a stratified/zoned mantle (e.g., Hofmann and White, 1982; Kellogg et al., 1999; Nakagawa et al., 2012, Tackley, 2008), (c) a plum-pudding mantle (e.g., Morris and Hart, 1983; Zindler et al., 1984), and (d) a marble-cake mantle (e.g., Allègre and Turcotte, 1986; Hoffman and McKenzie, 1985).
In addition to these models, which were primary concerned with vertical structures of the mantle, large-scale horizontal structures have been found, based on the isotopic compositions of basalts that directly reflect the mantle isotopic compositions. Dupré and Allègre (1983) discovered an isotopically distinct region in the Indian Ocean, based on which Hart (1984) defined the “Dupal anomaly” that is distributed in the Indian Ocean and part of the South Pacific Ocean. By increasing the number of basalt isotopic data from the fewer than 100 used by Hart (1984), Iwamori and Nakamura (2012, 2015) found that the Earth's mantle can be broadly divided into eastern and western hemispheres (Fig. 1) based on global data for 6854 young basalts (Quaternary plus some Tertiary) with five isotopic ratios of Sr, Nd, and Pb, which were compiled mostly from GEOROC (http://www.georoc.mpch-mainz.gwdg.de/georoc/) and PetDB (Lehnert et al., 2000).
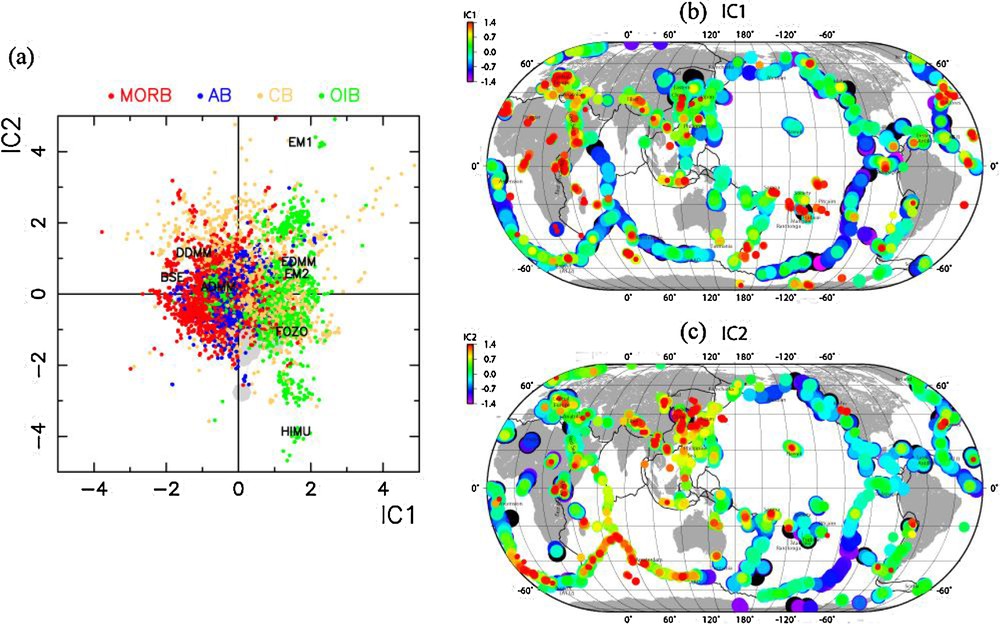
(a) Isotopic compositions of the basalts from oceanic, arc, and continental regions expressed in the independent component space with IC1 and IC2 (Iwamori and Nakamura, 2015). The color coding discriminates mid-ocean ridge basalt (MORB, red), ocean island basalt (OIB, green), arc basalt (AB, blue), and continental basalt (CB, orange). Representative mantle geochemical end-members are also plotted on the IC1–IC2 plane: BSE [Bulk Silicate Earth as a primitive mantle], DMM [depleted MORB-mantle; A-DMM, D-DMM, and E-DMM for representing average, depleted, and enriched DMM], FOZO [FOcus ZOne], ‘C’ [Common component], HIMU [high (238U/204Pb)t = 0], and EM1 and EM2 [enriched mantle I and II]. All the end-members except for EM2 plot on the plane within the statistical sample variance. Geographical distribution of (b) IC1 and (c) IC2 (Iwamori and Nakamura, 2015). In each basalt location, the variability is shown by the size of the color-coded symbols (smaller for the higher IC values). The central longitude of this map is 160° E.
The main aim of this study was to characterize the isotopically defined east–west geochemical hemispheres by trace-element concentrations and ratios, which were not used by Iwamori and Nakamura (2012, 2015). Trace element concentrations and ratios can be good indicators for characterizing the basalt source regions in the mantle (e.g., Hofmann, 2003), such as the degree of depletion/enrichment of incompatible elements, which may reflect the past differentiation processes. In addition to the source composition and unlike the isotopic compositions, trace-element concentrations and ratios reflect melting processes, including residual mineral assemblages and the degrees of partial melting, which may obscure the source information. In this sense, the way the radiogenic isotopic systematics are coupled with or decoupled from their parent/daughter elements is interesting and important, as it contains information on the time and nature of the past geochemical differentiation. For this reason, we focused on Rb, Sr, Nd, Sm, Pb, Th, and U, as well as the isotopic ratios 87Sr/86Sr, 143Nd/144Nd, 206Pb/204Pb, 207Pb/204Pb, and 208Pb/204Pb. Based on the global variations of these elements and isotopes, we discuss the geochemical nature of large-scale compositional structures in the mantle and their implications for geodynamic processes.
2 Data and methods
The basalt compositional data used in this study were selected from those presented by Iwamori and Nakamura (2015) using the selection criteria that concentrations of Rb, Sr, Nd, Sm, Pb, Th, and U were reported in addition to the five isotopic ratios of Sr, Nd, and Pb (87Sr/86Sr, 143Nd/144Nd, 206Pb/204Pb, 207Pb/204Pb, and 208Pb/204Pb). After removing the outliers (≥3 σ), a total of 4787 basalt samples with these 12 data items were used, including 2084 samples from mid-ocean ridges and some ocean basins (hereafter referred to as MORB), 1093 from ocean islands (OIB), 622 from arcs (AB), and 988 from continental intraplate settings (CB). This data set was mainly used in the following analyses. We also filtered the dataset by performing the Smirnov–Grubbs test (i.e. repeatedly removing the outliers until convergence), which resulted in a total of 4239 samples (2005 MORB, 926 OIB, 565 AB, and 743 CB samples). The repeatedly filtered data set was also used in some of the following analyses to examine how the different filtering methods affected the results. Iwamori and Nakamura (2015) showed that the numbers of MORB, OIB, and AB samples used in this data set were approximately proportional to the geographical areas from which MORB, OIB, and AB were sampled, respectively, and suggested that the geographical sampling bias, including the east–west hemispheric bias, is insignificant. Iwamori and Nakamura (2015) also showed that CB occurs mostly (∼87%) in the eastern hemisphere characterized by the continental area (67% of the eastern hemisphere), as shown in Fig. 1a. For this reason, a data set without CB was also examined in some of the following analyses.
To investigate the global variations of the trace elements, we utilized the results obtained in our previous work based on the basalt isotopic compositions with Independent Component Analysis (ICA) (Iwamori and Albarède, 2008; Iwamori and Nakamura, 2012, 2015; Iwamori et al., 2010), which is a relatively new multivariate statistical analysis to deconvolve the mixed signals as observable vectors (e.g., basalt compositions) to independent source signal vectors (e.g., source material compositions or processes that have produced compositional variability of basalts). These previous works revealed that the global variabilities of the basalt isotopic compositions (the five isotopic ratios of Sr, Nd, and Pb) are explained by only two independent base vectors that account for 95% of the sample's variance. The independent base vectors are referred to as independent components (ICs), and the two ICs (IC1 and IC2 in Fig. 1) can be regarded as coordinate axes to describe the isotopic compositions of individual basalt samples distributed in the IC1–IC2 plane (Fig. 1a).
Principal Component Analysis (PCA) has been applied more frequently for the basalt's geochemistry (e.g., Allègre et al., 1987; Hart et al., 1992; Stracke, 2012, Zindler et al., 1982) than ICA to understand the origin of mantle heterogeneity, particularly mantle geochemical end-members, such as DMM (depleted MORB mantle), EM (enriched mantle), FOZO (Focus Zone), and HIMU (high-μ). For example, Stracke (2012) suggested that the generation and subduction of oceanic plates into the deeper mantle, together with small amounts of lower and upper continental crust, appears to be the main process for mantle enrichment. The results of PCA and ICA are compatible in that both can describe the same compositional space based on a reduced number (less than that of the observed variables) of compositional base vectors, i.e. principal components (PCs) in PCA and independent components (ICs) in ICA. The difference is that the ICs are made statistically independent by maximizing the non-Gaussianity along the ICs, whereas the PCs maximize the sample variance along PCs and are not independent when the data show a non-Gaussian distribution. The isotopic compositions of basalts exhibit clear non-Gaussian distributions (e.g., Iwamori and Albarède, 2008). Therefore, ICA is more suitable than PCA for identifying independent sources and/or processes that have produced the observed compositions and has successfully discriminated the independent isotopic features of the terrestrial basalts, as presented in the following section. The similarities and differences between PCA and ICA were fully described in Iwamori and Nakamura (2015) based on reports by Hyvärinen et al. (2001) and Iwamori et al. (2017) using k-means cluster analysis, which clearly shows that, unlike ICA, PCA fails to extract the independent features from the basalt isotopic compositions, including the geographical provenance, as shown in Fig. 1a.
One of the ICs, IC1, discriminates MORB (mostly IC1 < 0) from OIB (mostly IC1 > 0) rather sharply (Fig. 1a and b): 95% of OIB, except for Hawaii and Iceland, have positive IC1 values, and 83% of MORB have negative IC2 values, except for those from the plume-influenced ridges, such as Iceland, Azores, Galápagos, and Red Sea (Iwamori and Nakamura, 2015). IC2 exhibits broad geographical provenance with an eastern hemisphere (IC2 > 0) and a western hemisphere (IC2 < 0), irrespective of the types of basalt (Fig. 1c): 81.2% of the basalts from the western hemisphere have negative IC2 values, while 77.7% from the eastern hemisphere have positive IC2 values (Iwamori and Nakamura, 2015). Therefore, IC1 and IC2 provide independent information. Mantle geochemical end-members, such as DMM, EM, FOZO, HIMU, were also plotted on the IC1–IC2 plane (Fig. 1a). Iwamori and Albarède (2008) and Iwamori et al. (2010) argued that IC1 measures the amount of the “melt ingredient” contained over the long term (several 100 million years to 1 giga-year) in the mantle source of basalt, and IC2 measures the amount of the “hydrophile (aqueous fluid) ingredient” contained over the long term in the mantle source, on the basis of the slopes of IC1 and IC2 in the isotopic compositional domain.
Such enrichment or depletion in the melt and aqueous fluid ingredients would be associated with the variations of the trace elements. To examine such relationships, we used the IC-coordinate for the individual basalt isotopic compositions obtained by Iwamori and Nakamura (2015) and divided the basalts into four groups (Fig. 2): Group 1 = IC1 > 0 & IC2 > 0 (blue symbol in Fig. 2), Group 2 = IC1 < 0 & IC2 > 0 (green), Group 3 = IC1 < 0 & IC2 < 0 (red), and Group 4 = IC1 > 0 and IC2 < 0 (black). Then, the variations of the trace elements in the basalts were plotted, discriminating four groups (Figs. 3 and 4) that were used to examine the relationships between the trace elements, isotopic ratios, basalt types, and geographical localities. For clarity, it is noted that the color indices in Figs. 1 and 2 represent different quantities: the basalt type in Fig. 1a, the IC1 value in Fig. 1b, the IC2 value in Fig. 1c, and the four groups in IC1–IC2 in Fig. 2. The four groups defined in Fig. 2 will be consistently used in the following diagrams (Figs. 3–8).
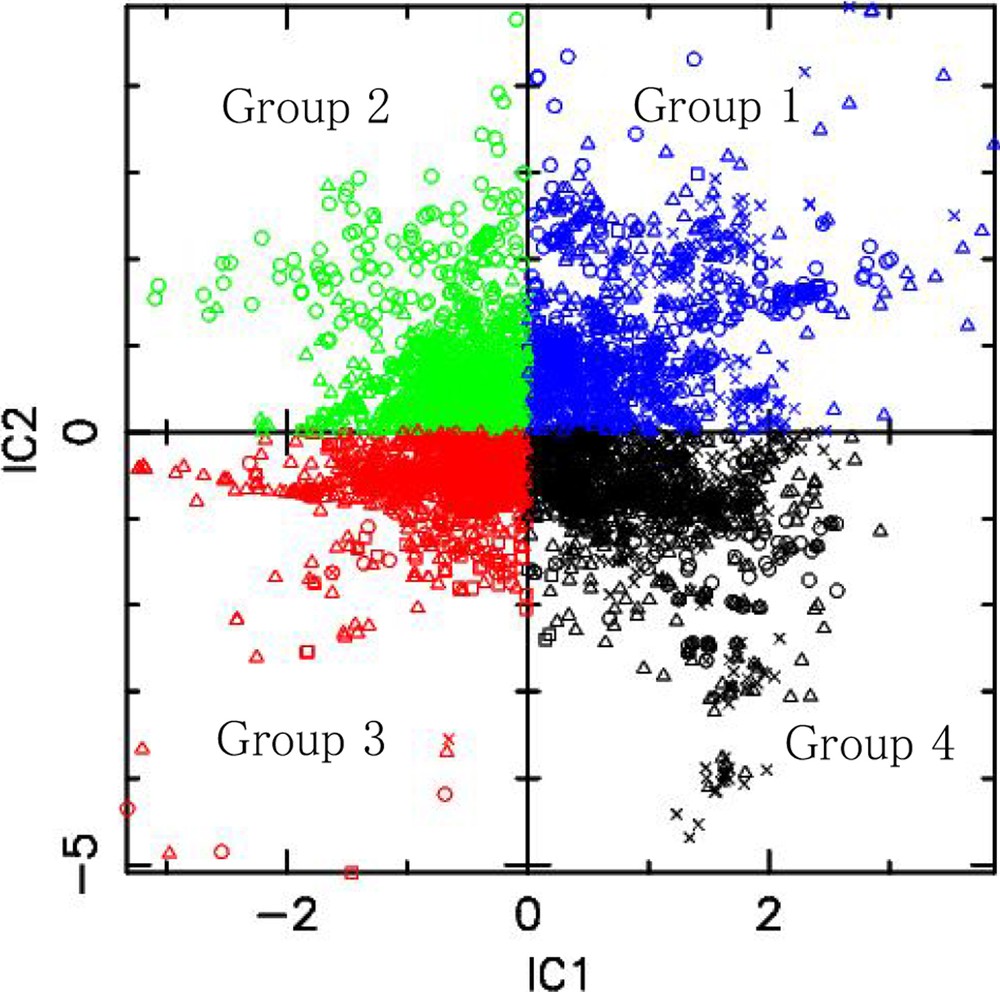
Four basalt groups (with four distinct colors) used in this study, plotted in the IC1–IC2 plane. Triangle = MORB, cross = OIB, square = AB, circle = CB.
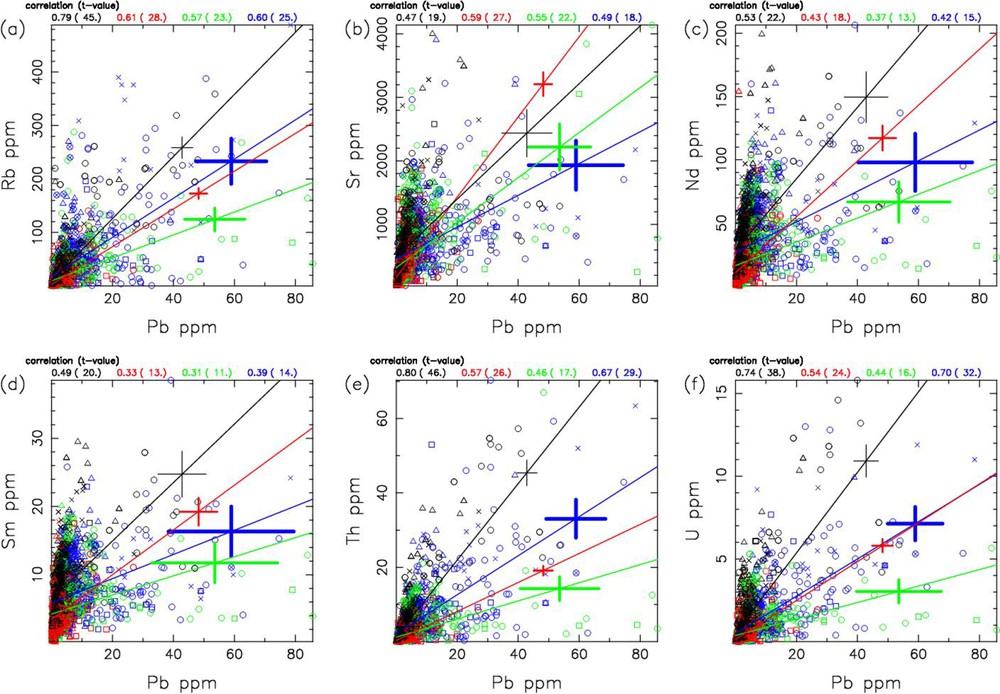
Trace element variations of the basalt used in this study. The Pb concentrations are plotted with (a) Rb, (b) Sr, (c) Nd, (d) Sm, (e) Th, and (f) U. The four lines are the linear regression lines for the individual basalt groups shown in Fig. 2: blue for Group 1 (IC1 > 0, IC2 > 0), green for Group 2 (IC1 < 0, IC2 > 0), red for Group 3 (IC1 < 0, IC2 < 0), and black for Group 4 (IC1 > 0, IC2 < 0). Triangle = MORB, cross = OIB, square = AB, circle = CB. Regression error bars for ±1σ are shown for the individual regression lines. The correlation coefficients are shown at the top of each figure for the four groups, with the t-values in parenthesis, which indicates that all the regression lines are statistically significant.
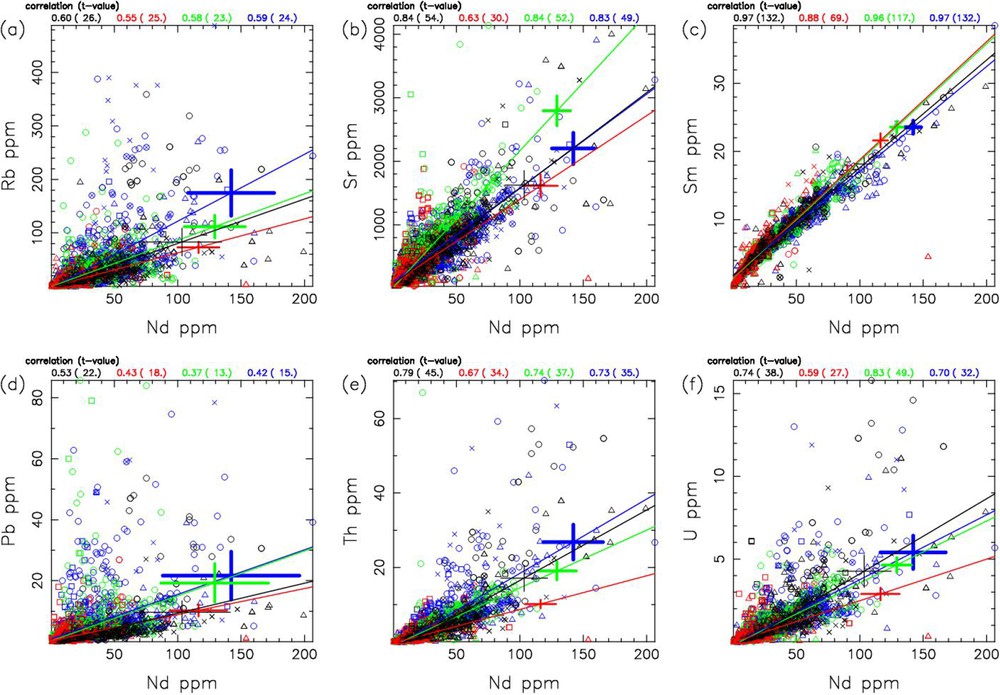
Trace element variations of the basalt used in this study. The Nd concentrations are plotted with (a) Rb, (b) Sr, (c) Sm, (d) Pb, (e) Th, and (f) U. The four lines are the linear regression lines for the individual basalt groups shown in Fig. 2: blue for Group 1 (IC1 > 0, IC2 > 0), green for Group 2 (IC1 < 0, IC2 > 0), red for Group 3 (IC1 < 0, IC2 < 0), and black for Group 4 (IC1 > 0, IC2 < 0). Triangle = MORB, cross = OIB, square = AB, circle = CB. Regression error bars for ±1σ are shown for the individual regression lines. The correlation coefficients are shown at the top of each figure for the four groups, with the t-values in parentheses, which indicates that all the regression lines are statistically significant.
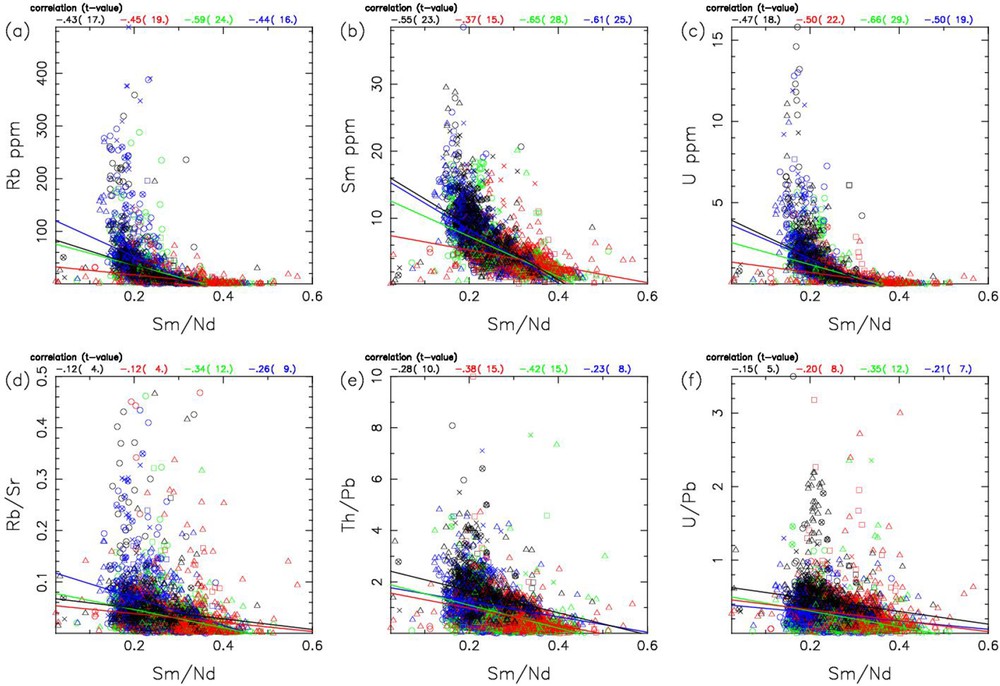
Trace element variations of the basalt used in this study. The Sm/Nd ratios are plotted with Rb (a), Sm (b), U (c), Rb/Sr (d), Th/Pb (e), and U/Pb (f). The four lines are the linear regression lines for the individual basalt groups shown in Fig. 2: blue for Group 1 (IC1 > 0, IC2 > 0), green for Group 2 (IC1 < 0, IC2 > 0), red for Group 3 (IC1 < 0, IC2 < 0), and black for Group 4 (IC1 > 0, IC2 < 0). Triangle = MORB, cross = OIB, square = AB, circle = CB. Regression error bars for ±1σ are shown for the individual regression lines. The correlation coefficients are shown at the top of each figure for the four groups, with the t-values in parentheses, which indicates that all the regression lines are statistically significant.
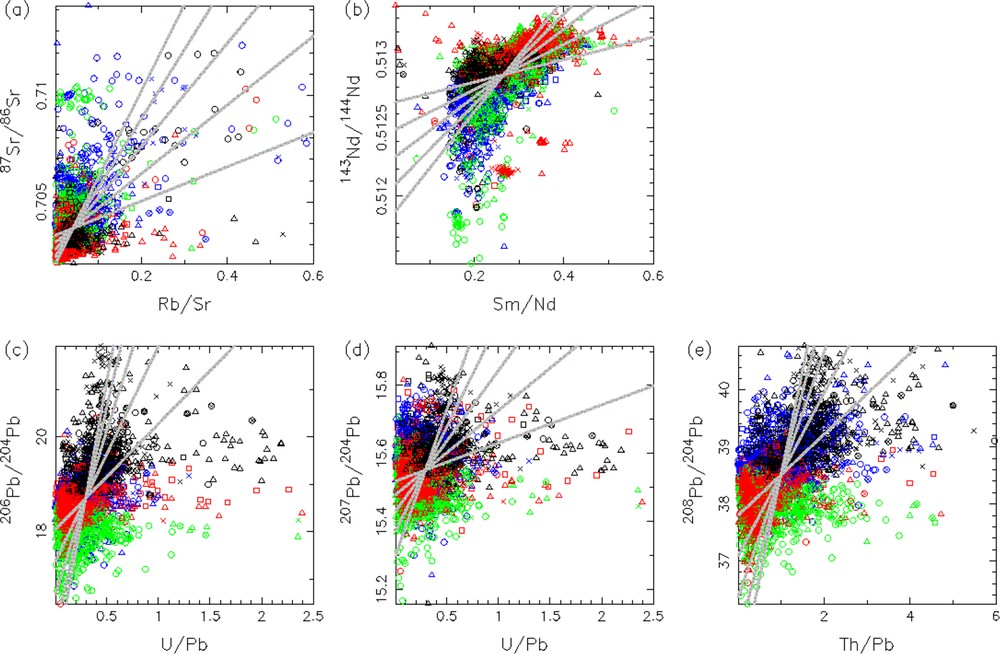
The parent/daughter elements are plotted with the corresponding isotopic ratio. Rb/Sr vs. 87Sr/86Sr (a), Sm/Nd vs. 143Nd/144Nd (b), U/Pb vs. 206Pb/204Pb (c), U/Pb vs. 207Pb/204Pb (d), and U/Pb vs. 208Pb/204Pb (e). The thin gray lines correspond to the isochron slopes, assuming the constants in Table 1. The five lines represent the slopes corresponding to 0.2 Gyr of radiogenic ingrowth (the gentlest slope) to 1.0 giga years ingrowth (the steepest slope), with 0.2-Gyr intervals. All the lines are drawn to pass through the average values of the basalt data. The color coding and the symbols are the same as in Figs. 2–5.
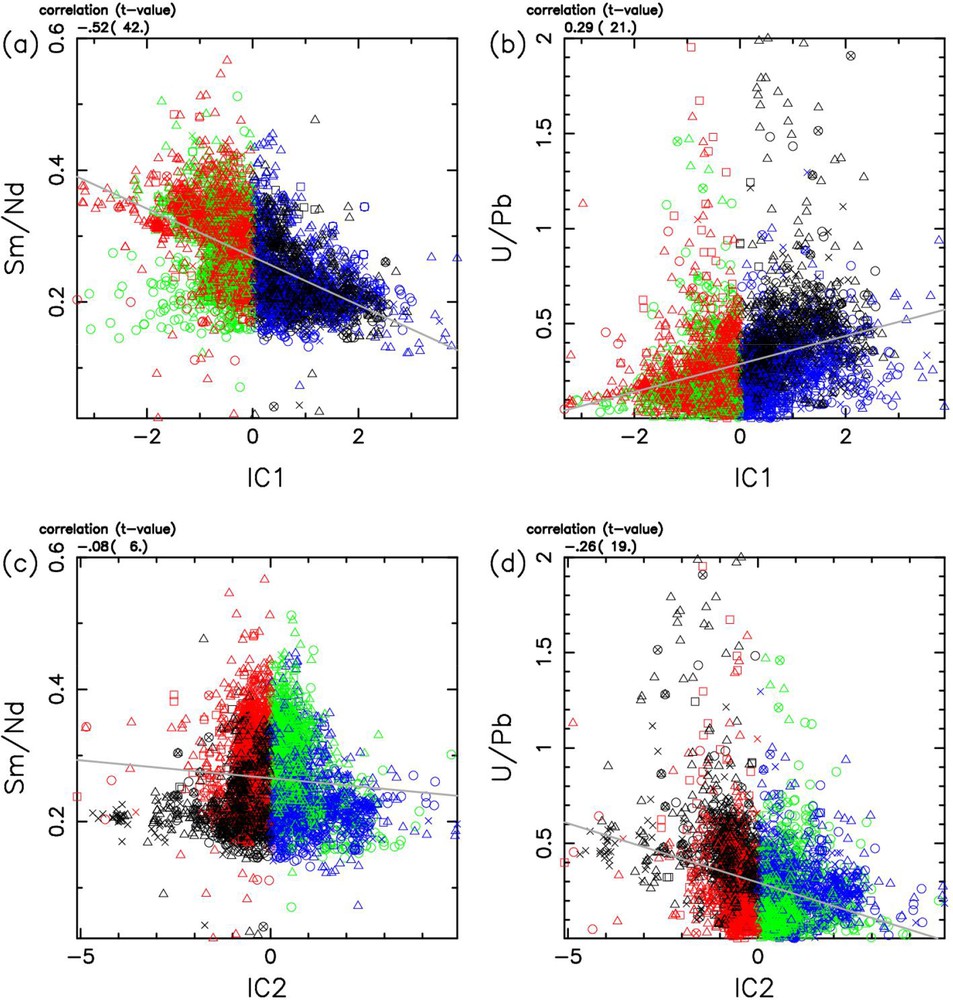
Correlations between the independent components (IC1 and IC2) and the trace element ratios (Sm/Nd and U/Pb). The four colors for the four IC-groups are the same as in Fig. 2. The gray lines correspond to the linear regression line for all the basalts. Triangle = MORB, cross = OIB, square = AB, circle = CB. The correlation coefficients are shown at the top. The t-values are also shown in parentheses, which indicates that all the regression lines are statistically significant.
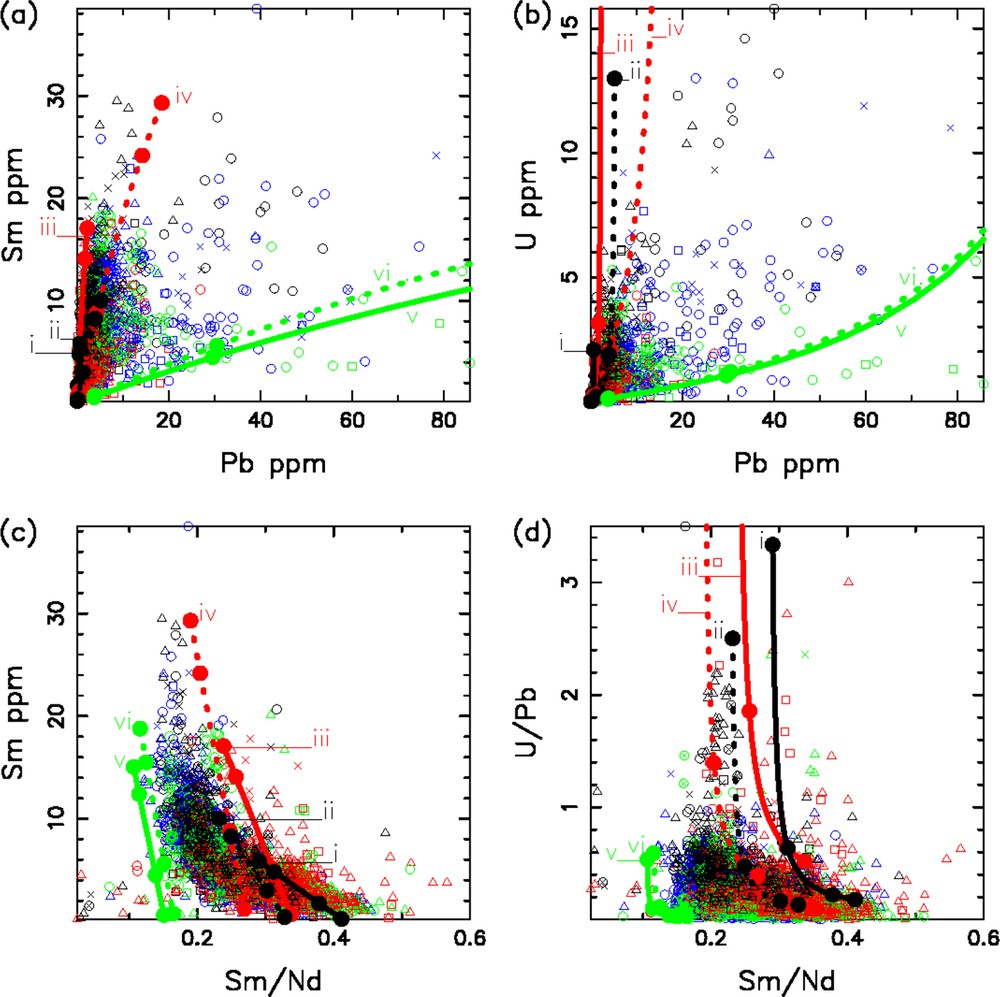
Model calculations for the trace-element compositions of the melt that originated from a mantle source that is metasomatized by variable amounts of melt or aqueous fluid. The solid lines represent melting paths for A-DMM (Workman and Hart, 2005, black line, (i)), melt-metasomatized A-DMM (red line, (iii)), and fluid-metasomatized A-DMM (green line, (v)). The dotted lines represent melting paths for BSE (McDonough, 2001, as a primitive mantle, black line, (ii)), melt-metasomatized BSE (red line, (iv)), and fluid-metasomatized BSE (green line, (vi)). The solid circles along the melting paths indicate the degree of melting of 0.1, 1, 10, and 100%. The compositions and partition coefficients used in the calculations are listed in Table 1, and the calculation procedures are described in Section 2. The symbols are the same as in Figs. 2–7.
We performed model calculations for the trace-element composition of the melt originating from a mantle source that is metasomatized by variable amounts of melt and aqueous fluid, which involves the two ingredients suggested by IC1 and IC2, respectively. By changing the amount of metasomatizing melt or fluid and the melting degree of such a metasomatized mantle, a series of melting paths were obtained (Section 4). For the source mantle, A-DMM (average depleted MORB mantle, Workman and Hart, 2005) and BSE (bulk silicate Earth as a primordial mantle, McDonough, 2001) were used, which are metasomatized by partial melt of the source mantle itself (1% melting was assumed) or the aqueous fluid derived from a subducted plate (Pacific Plate, Nakamura and Iwamori, 2013). The amount of metasomatizing melt or fluid added to the source mantle (A-DMM or BSE) was varied from 0 to 10%. It is noted that the “melt-metasomatized” source may indicate not only physical infiltration of the melt into the solid mantle, but also a mixture of a basaltic material and peridotite (e.g., thinly stretched pyroxenite layers in peridotite, Allègre and Trucotte, 1986), both of which can have the same composition at the macroscopic scale.
Then, the metasomatized mantle was partially melted from 0.1% to 100%. The calculation with a melting degree of 100% was performed simply to provide an upper bound estimate, not to represent an actual melting condition. These calculated melt compositions were used to examine the possible origin of the observed trace-element variations. The compositions of the source mantle and the aqueous fluid and the partition coefficients for melting used in this study are given in Table 1. In addition, we calculated radiogenic ingrowth and illustrated the corresponding age isochron lines based on the decay rate and the relative isotopic abundances (Table 1), following Iwamori et al. (2010).
Compositions and parameters used for model calculations in this study.
| Rb | Sr | Nd | Sm | Pb | Th | U | U | |
| A-DMM (ppm) | 0.05 | 7.664 | 0.581 | 0.239 | 0.018 | 0.0079 | 0.0032 | – |
| BSE (ppm) | 0.6 | 20 | 1.25 | 0.41 | 0.15 | 0.08 | 0.02 | – |
| Fluid (ppm) | 216.05 | 536.24 | 35.50 | 3.99 | 36.82 | 2.16 | 1.03 | – |
| Kd (solid/melt) | 0.0004 | 0.0298 | 0.0279 | 0.0399 | 0.0279 | 0.0002 | 0.0005 | – |
| Isotope | 87Rb | 86Sr | 144Nd | 147Sm | 204Pb | 232Th | 235U | 238U |
| Decay rate (1/Gyr) | 0.0142 | – | – | 0.0065 | – | 0.0495 | 0.985 | 0.155 |
| Relative abundance | 0.2783 | 0.0986 | 0.238 | 0.1499 | 0.014 | 1 | 0.0072 | 0.9927 |
We do not claim that the specific parameters and compositions in Table 1 are sufficient to describe the global data and the corresponding processes; e.g., slab-derived fluids must vary spatially in composition, corresponding to the subduction inputs (e.g., Nakamura et al., 2008, 2018; Plank and Langmuir, 1993), which cannot be accurately represented by the Pacific Plate-derived fluid. Considering such variability and seeking a robust solution to explain the individual trace-element data of basalt are beyond the scope of this study. In this paper, we attempt to clarify how only two components of the mantle can or cannot be used to explain the trace-element data.
3 Results
3.1 Trace element variations
Fig. 3 shows the variations of Pb vs. the other trace elements in the basalts. The common feature in these diagrams is a scattered data distribution. All the elements shown in Fig. 3 are incompatible elements. The significantly scattered distribution may indicate a wide range in the source composition that would reflect variable processes, including melting, fluid-rock reactions, and core formation in the past.
Despite the wide variations, the four linear regression lines for the four basalt groups defined in the IC1–IC2 space (Fig. 2) are different and reflect broad discrimination of the basalt groups. All the regression lines in Fig. 3 are statistically significant, as quantified by the correlation coefficients and the t-values, which are shown at the top of each figure. The regression lines for Group 1 (IC1 > 0 and IC2 > 0, blue) have smaller slopes than those of Group 4 (IC1 > 0 and IC2 < 0, black) in all the diagrams in Fig. 3. The two groups can be discriminated exceeding the range of the uncertainties indicated by the error bars, although OIB is the common major constituent in both groups. The difference is attributed to IC2, which is related to the geographical distribution; the basalts of Group 1 with IC2 > 0 occur more in the eastern hemisphere, whereas those of Group 4 with IC2 < 0 occur in the western hemisphere (Fig. 1). A similar relationship is observed for the basalts with a negative IC1 (mostly MORB); the regression lines for Group 2 (IC1 < 0 and IC2 > 0, green) have smaller slopes than those of Group 3 (IC1 < 0 and IC2 < 0, red), and the two groups can be discriminated exceeding the range of the uncertainties indicated by the error bars (Fig. 3).
Fig. 4 shows the variations of Nd vs. the other trace elements in the basalts, in which all the regression lines for the four basalt groups are statistically significant, as quantified by the correlation coefficients and the t-values. Compared to Fig. 3, the data distributions are more compact, and the discrimination between the groups is unclear within the uncertainties in several diagrams, e.g., Fig. 3c for Nd–Sm. However, Group 2 (green) and Group 3 (red), which are mostly MORB, are discriminated outside the regions of uncertainties of the regression lines in Fig. 3b, e, and f. On the other hand, the error bars of Groups 1 (black) and 4 (blue) overlap in Fig. 4. In three- or higher-dimensional spaces involving the elements used in Fig. 3 and Fig. 4, e.g., the Pb–Nd–Rb space, Groups 1 and 4 are still discriminated (Appendix A, supplementary Fig. A1), reflecting the differences in Fig. 3a and c.
The ratios between the incompatible elements are useful for investigating the nature of the source mantle of basalt, because they are relatively insensitive to degrees of partial melting (e.g., Allègre et al., 1995; Williams and Gill, 1989). Fig. 5 shows the variations of Sm/Nd vs. the selected elements, and the ratios. In Fig. 5a–c, the OIB groups (Groups 1 and 4, blue and black in Fig. 5, respectively) broadly plot with higher concentrations for Rb, Sm, and U and lower Sm/Nd ratios when compared to the MORB groups (Groups 2 and 3, green and red in Fig. 5, respectively). The overall negative trends in Fig. 5a–c are curved, possibly because the concentrations on the vertical axes rapidly drop with increasing the degree of melting or source depletion. When the Rb/Sr, Th/Pb, and U/Pb ratios are plotted against Sm/Nd (Fig. 5c–e), the curvature of the overall negative trend is greatly reduced. However, the OIB groups broadly exhibit higher Rb/Sr, Th/Pb, and U/Pb ratios, although the linear regression line is not a reasonable approximation of the curved trend. This incompatible element enrichment of OIB compared to that of MORB is a well-known feature (e.g., Allègre et al., 1995; Sun, 1980). In addition to this feature, some differences may be recognized between Groups 1 (blue) and 4 (black) and Groups 3 (green) and 4 (red), which are related to the differences in IC2, as was described for Figs. 3 and 4. Unlike Figs. 3 and 4, linear regression errors cannot be used to assess the uncertainties of the differences between the groups in Fig. 5. For this reason, the errors are not shown in Fig. 5. Two supplemental data sets, (i) one with the Smirnov–Grubbs test and (ii) another excluding CB, as was described in Section 2 (Data and Methods), have been analyzed and plotted with the same procedure as that used for Figs. 3–5 (Appendix A, supplementary Figs. A2, A3, and A4 for (i) and Figs. A5, A6, and A7 for (ii), respectively). The results show essentially the same features for the three different data sets; in addition to the MORB/OIB discrimination, the basalt groups exhibit IC2-related differences in the incompatible trace elements and the ratios, indicating that the above arguments for Figs. 3–5 are robust.
3.2 Relationships between trace elements, isotopic ratios and ICs
The isotopic composition of basalt coincides with that of the source mantle if equilibrium melting occurs, whereas the trace-element composition depends on both the source material composition and the melting condition, such as the degree of melting. Therefore, inspection of the relationship between the isotopic and trace-element compositions may resolve the source composition and the melting condition in some cases (e.g., McKenzie et al., 2004).
Fig. 6 shows parent/daughter element pairs and the corresponding isotopic ratios that were used to define the ICs and the east–west geochemical hemispheres of the mantle (Fig. 1). Although an isochron-based model age is not well defined due to the scattered data distribution, some broad trends with positive slopes can be recognized (e.g., Fig. 6c for 206Pb/204Pb), which can be compared to the calculated slopes for radiogenic ingrowth from 0.2 to 1 Gyr (gray lines in Fig. 6).
The IC1 and IC2 vectors consist of the five isotopic ratios of Sr, Nd, and Pb, and are related to the radiogenic ingrowth. If rock packets with a uniform composition undergo melting of different degrees (or the same melting degree but over different ingrowth durations), the four parent/daughter ratios (i.e. Rb/Sr, Sm/Nd, Th/Pb, and U/Pb) are fractionated, reflecting the partition coefficients, and the resultant isotopic ratios show coherence (e.g., distribution along a hyper-plane in the multidimensional space), which can be captured by the ICs. Therefore, the ICs are potentially correlated with the trace-element concentrations and ratios. Fig. 7 shows such correlations between ICs and the trace-element ratios; a broad positive correlation is seen for IC1-U/Pb, while broad negative correlations are seen for IC1-Sm/Nd and IC2-U/Pb. The correlation coefficients are shown at the top of each figure with the t-values in parentheses. The t-values indicate that all the regression lines are statistically significant.
4 Discussion
The overall scattered data distribution found in Figs. 3 and 4 suggest that the source mantle materials are extremely heterogeneous, although the expected wide range in the degree of melting for the basalts including MORB and OIB (less than 1% to more than 20%, e.g., McKenzie and Bickle, 1988; Herzberg and Asimow, 2008) must have contributed to the trace-element concentrations. The trace-element ratios shown in Fig. 5 and their relationships to the isotopic compositions are less affected by the effect of the variable degree of melting; yet they show some significant variations, which would be attributed to the source heterogeneity.
To illustrate the effects of variable source composition and degree of melting, we performed model calculations for trace-element concentrations in the melt that originated from a mantle source metasomatized by variable amounts of melt or aqueous fluid, as was described in Section 2. The two independent components, IC1 and IC2, account for 95% of the Sr–Nd–Pb isotopic variability (Fig. 1), which can be related to involvement of (or metasomatism by) the melt and aqueous fluid ingredients, respectively (Iwamori and Nakamura, 2015). Therefore, it would be reasonable to examine the variations of the trace elements with two such processes of the melt and aqueous fluid.
Fig. 8 shows several representative diagrams showing Pb vs. Sm and U (Fig. 8a and b) and Sm/Nd vs. Sm and U/Pb (Fig. 8c and d), for melts produced with melting degrees from 0.1 to 100%. The calculation with a melting degree of 100% was performed simply to show the source composition on the diagrams, but not as the actual melting condition. Compositions of a depleted mantle (A-DMM, Workman and Hart, 2005) and a primitive mantle (bulk silicate Earth (BSE), McDonough, 2001) were used to demonstrate the effects of the wide range in the source composition. These two source materials were metasomatized by either a melt produced by 1% melting of the source mantle itself or the aqueous fluid derived from the subducted Pacific slab (see Section 2 for the detail). In total, six melting paths are illustrated in Fig. 8: (i) black solid line = A-DMM, (ii) black dotted line = BSE, (iii) red solid line = melt-metasomatized A-DMM, (iv) red dotted line = melt-metasomatized BSE, (v) green solid line = fluid-metasomatized A-DMM, and (vi) green dotted line = fluid-metasomatized BSE.
Fig. 8a for Pb vs. Sm corresponds to Fig. 3d, which shows the low IC2 group (Groups 3 (red symbol) and 4 (black symbol)) plot closer to the y-axis, having a steeper Sm/Pb slope compared to that of the high IC2 group (Groups 1 (blue) and 2 (green)). The two modeled melting paths for the unmetasomatized mantle (cases (i) and (ii) above) plotted closely to the y-axis, irrespective of depleted or primitive nature of the source. When these two sources are metasomatized by melt (cases (iii) and (iv)), the melting paths extend towards higher concentrations with slopes similar to those of (i) and (ii), leaving many data unexplained. On the other hand, the melting paths for the fluid-metasomatized mantle (cases (v) and (vi), green lines) plots closer to the x-axis, and their slopes are similar to those of the regression lines for the high IC2 group (blue and green lines in Fig. 3d). This is consistent with a source region of the basalts with a positive IC2 that is enriched in a “hydrophile (aqueous fluid) ingredient” (Iwamori and Albarède, 2008; Iwamori and Nakamura, 2012, 2015; Iwamori et al., 2010), which is based solely on the isotopic systematics.
Essentially similar variations are recognized in other diagrams (Fig. 8b–d, which correspond to Figs. 3f, 5b and 5f, respectively). In Fig. 8c, for Sm/Nd vs. Sm, melting of the unmetasomatized mantle sources (black lines for cases (i) and (ii)) explains only the bottom right portion (relatively high Sm/Nd and low Sm) of the main data area. Approximately 0.1% melting of the melt-metasomatized mantle sources may account for the high Sm portion (up to 30 ppm). As the degree of melting increases, the Sm concentration rapidly decreases with a slight increase in Sm/Nd (red lines for cases (iii) and (iv)). However, many data with Sm/Nd less than ∼0.2 cannot be accounted for by (i)–(iv). The green lines for melting of the fluid-metasomatized sources ((v) and (vi)) plot at lower Sm/Nd ratios, and most of the basalt data are encompassed by the modeled melting paths (i)–(vi).
In Fig. 8d, for Sm/Nd vs. U/Pb, the unmetasomatized and melt-metasomatized mantle sources may account for a part of the whole data distribution. This situation would not change essentially if the assumptions for hypothetical metasomatizing melt were modified (i.e. its source mantle and degree of melting–currently 1% is assumed). Therefore, additional source materials and processes are required to account for the data distribution. As in Fig. 8c, the green lines for melting of the aqueous fluid-metasomatized mantle in Fig. 8d again bound the lower Sm/Nd side of data, and the combination of melt- and aqueous fluid-metasomatized sources would account for the wide compositional range of basalts in Figs. 3–5 and 8.
Fig. 7 captures how Sm/Nd and U/Pb are related to Groups 1 to 4 and hence the ICs. IC1 increases with Nd/Sm (inverse of Sm/Nd) and U/Pb, which are expected to be higher with increasing “melt ingredient” in the source mantle on the basis of the solid/melt partition coefficients (Table 1). IC2 slightly increases with Nd/Sm (inverse of Sm/Nd) and decreases with U/Pb, which is consistent with more “aqueous fluid ingredient” in the source mantle for higher IC2 basalts (Kessel et al., 2005; Kogiso et al., 1997). These characteristics are broadly seen in Fig. 8, although the significant overlap obscures the group discrimination.
Numerous candidates for explaining the variability of basalt source materials have been proposed, including BSE, DMM (A-DMM, D-DMM, E-DMM), FOZO, ‘C’, HIMU, EM1, EM2 (see the caption of Fig. 1 for the abbreviations), and the corresponding raw materials, such as subducted oceanic crust, sediment, continental crust, sublithospheric mantle, or various types of metasomatism (e.g., Stracke, 2012, and the references therein). Local fine-scale studies concerning the correlations between trace elements and isotopic compositions of basalts (McKenzie et al., 2004; White and Duncan, 1996) suggest the involvement of a subducted oceanic crust with sediment or oceanic plateau/seamount in addition to FOZO/C or DMM in the source mantle. These various components likely recycle in the crust–mantle system and may be sampled by melting to appear on the surface. For example, if a stirred and stretched layer of subducted oceanic crust is embedded in the prevailing DMM-type material (e.g., Allègre and Turcotte, 1986; Hoffman and McKenzie, 1985), melting of such a mixture would produce a “melt-component-rich” basalt of IC1 > 0, which could resemble a melt derived from the melt-metasomatized mantle. How these end-members and materials are explained or not explained in light of the two process-models proposed in this study should be examined in the future for identifying the physical entities of the two processes and ICs.
However, the conclusion is that only two processes involving the melt and aqueous fluid can account for most of the variability in the trace elements in Figs. 3–5. This is consistent with the finding that the five isotopic ratios (Sr–Nd–Pb) of basalts can be explained only by the two independent vectors, by which most of the mantle end-members (BSE, DMM, FOZO/C, HIMU, PREMA, and EM1) are also explained, except for EM2, which is negligible in population (Iwamori and Nakamura, 2015). The two-dimensionality of the basalt isotopic compositions has been repeatedly pointed out in several studies (e.g., Hart et al., 1992; Iwamori et al., 2010; Zindler et al., 1982), which indicates two independent and overlapping differentiation processes (Iwamori and Albarède, 2008). The trace element systematics found in this study also suggest that the two processes may account for most of the variability and exhibit geographical provenance; i.e. the mantle eastern hemisphere is enriched in the anciently subducted “aqueous fluid ingredient”. Iwamori and Nakamura (2012) argued that focused subduction toward the supercontinent that was surrounded by the subduction zones (Yoshida, 2013) could have created such a geochemical domain. This study supports the idea that the slab-derived fluid was likely involved in the formation of the hemispherical structure, through plate subduction, dehydration, and convective dispersion of the fluid ingredients (Iwamori and Nakakuki, 2013).
The correlation between the parent/daughter elemental ratio and the corresponding isotopic ratio (Fig. 6) supports the notion of a recycling timescale of convective dispersion of the geochemical ingredients. Previous studies pointed out that a model age is not well defined for global data (e.g., Stracke, 2012) and local fine-scale data (McKenzie et al., 2004). Fig. 6 for the five parent/daughter systems also shows such difficulty due to data dispersion. However, the overall trends and their minimum and maximum slopes in Fig. 6 suggest a relatively short recycling age, e.g., 0.2 to 1 Gyr. Christensen and Hofmann (1994) and Rudge (2006) suggested that the correlation between 206Pb/204Pb and 207Pb/204Pb, which can be interpreted as a model age of ∼2 Gyr, is a pseudoisochron that resulted from recycling materials of various ages. This study suggests that, in addition to the age effect, the overlapping two processes disperse the isochrons to form the broad correlations in Fig. 6, which is consistent with minimum estimates for recycling timescales of the “melt ingredient” (IC1) and “aqueous fluid ingredient” (IC2) (Iwamori and Nakamura, 2015).
5 Conclusions
The east–west mantle geochemical hemispheres, which was defined by the isotopic composition of 87Sr/86Sr, 143Nd/144Nd, 206Pb/204Pb, 207Pb/204Pb, and 208Pb/204Pb, were characterized by the concentrations of trace elements (Rb, Sr, Nd, Sm, Pb, Th, and U) and their ratios. Inspection of the data distributions using a series of variation diagrams suggests that the wide compositional range in the trace elements can be attributed (1) to the heterogeneity of the source mantle and (2) to the melting conditions, including the degree of melting. To demonstrate the effects of (1) and (2), model calculations were performed for trace-element composition of the melt that originated from different degrees of melting of various source materials. The results suggest that most of the wide variations of the trace elements are explained by melting of melt-metasomatized and fluid-metasomatized mantle sources. The amounts of the fluid component derived from subducted plates in the eastern hemisphere larger than those in the western hemisphere are inferred from the basalts. These characteristics support a hypothesis that was previously proposed: focused subduction towards the supercontinent created the mantle geochemical hemispheres.
Funding
This work was supported by JSPS KAKENHI [grant numbers 26247091, 26109006.]
Acknowledgements
The authors would like to thank the two anonymous reviewers for their critical comments, and Daisuke Suetsugu, Masayuki Obayashi, Satoru Tanaka, and Mika Mohamed for their discussion and help.