


 CC-BY 4.0
1. Introduction
In the Djeffara plain, like in other areas of the Maghreb, demographic and economic growths as well as the development of irrigated agriculture contribute to massive and unsustainable groundwater exploitation. In the transboundary multilayer aquifers system underlying the Djeffara plain shared by Tunisia and Libya, withdrawals increased from 0.03 to 1.0 km3⋅yr−1 between 1950 and 2011 [Alfarrah and Walraevens 2018; OSS 2006]. About 90% of the water extracted from these aquifers is used primarily for irrigated agriculture. The very intensive mining of these resources since 1950 has caused a decline of groundwater reserves together with the drying up of naturally flowing springs which were historically exploited [OSS 2006]. An accurate assessment of the recharge, whether natural or artificial, is pivotal to determine the degree of (un)sustainability of groundwater exploitation and to guide management policies. The few available values for the recharge in the Djeffara plain are derived from hydrogeological modeling [OSS 2006]. With the exception of the studies by Allemmoz and Olive [1980] and Zouari et al. [1985] in the regions of Tripoli and Gabès (see Figure 1), alternative approaches using geochemical or hydrogeophysical methods, for instance, are missing so far. While the estimation of a still unclear current recharge is a common issue for all the circum-Sahara regions, coastal aquifers such as the Djeffara system raise specific problems. Heavy and increasing withdrawals in coastal domains lead to salinization problems caused by seawater intrusion [Steyl and Dennis 2010]. This has been clearly established in the Tripoli area (Libya) with saline intrusion due to increasing urbanization and agricultural activities [Alfarrah and Walraevens 2018; Sadeg and Karahanoglu 2001]. The identification of groundwater–seawater fluxes, termed Submarine Groundwater Discharge (SGD), is another issue specific to coastal aquifers. The quantitative importance of SGD in comparison to surface water fluxes for oceans mass balance is a subject of controversy but their qualitative impact is largely accepted [e.g. Luijendijk et al. 2020]. SGD is often associated with a substantial supply of nutrients that affects the ecological equilibrium of coastal areas [e.g. Rodellas et al. 2015].
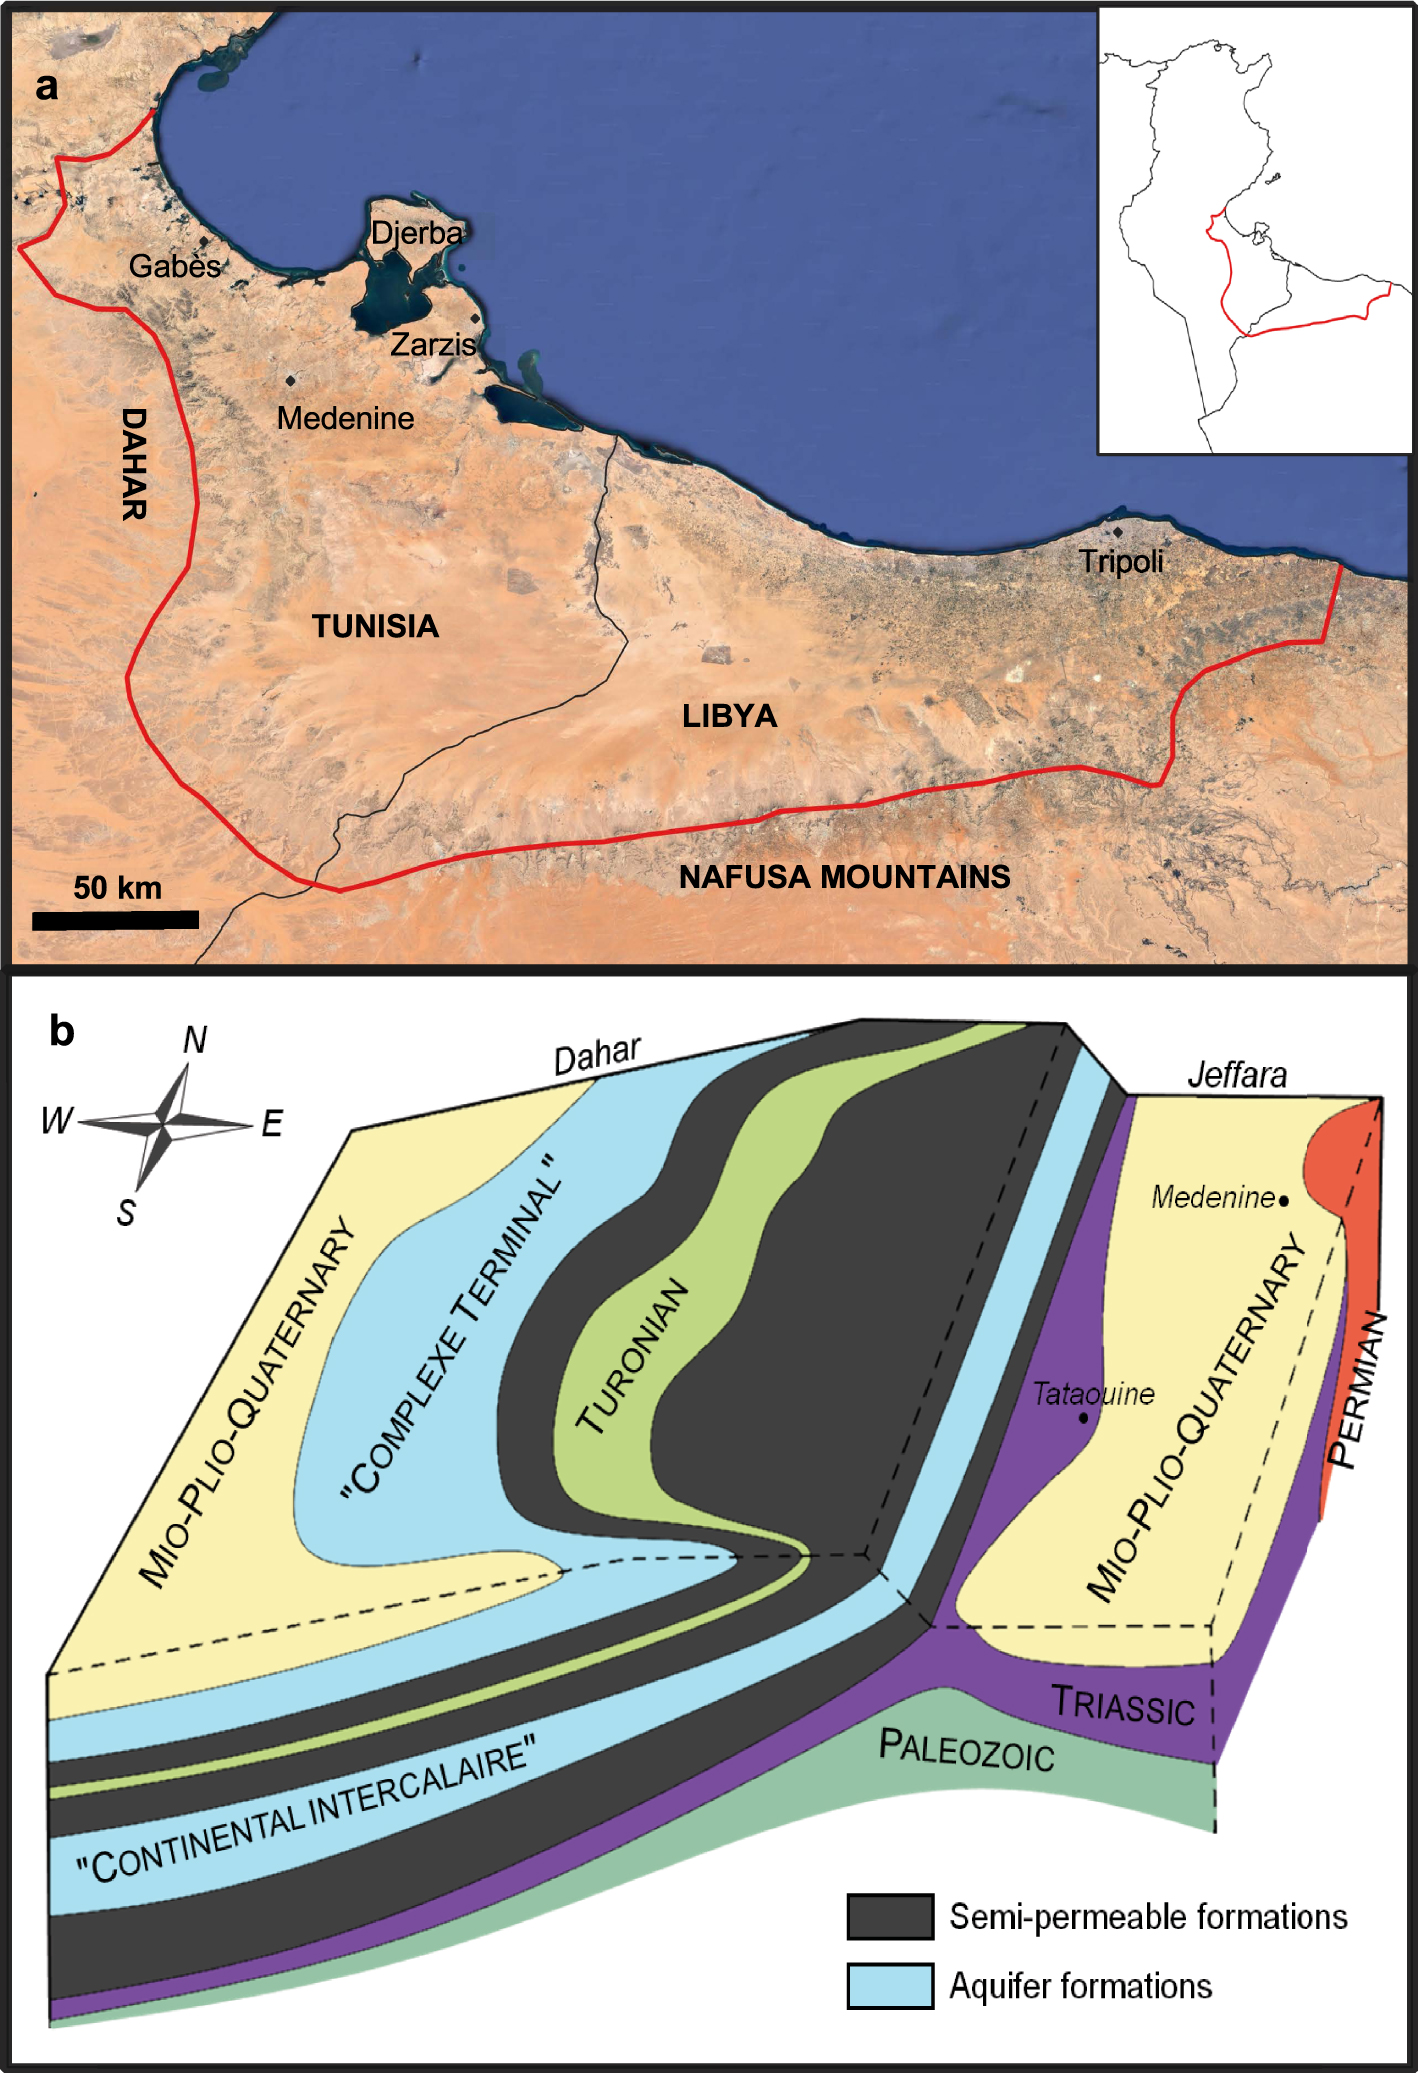
(a) Study area showing the Djeffara plain geographical extension, and (b) Schematic view of the geological context reproduced from Ben Dhia [1987].
A commonly used approach to derive SGD fluxes on local to regional scales is to close a radionuclide mass balance, using predominantly radon and radium as SGD tracers. Local SGD fluxes (on a bay/beach scale) were estimated using these tracers at many locations along the northern (European) coast of the Mediterranean Sea, but there is a conspicuous lack of any data-based SGD estimates in the southern Mediterranean basin along north African coastlines, including those adjacent to the Djeffara plain. Equally important, such radionuclide tracer-derived estimates include all advective fluxes across the sediment water interface in the term SGD [e.g. Rodellas et al. 2015]. It has been widely demonstrated that the major process contributing to radionuclide fluxes (>80% in most cases) is the recirculation of seawater through coastal sediments, and freshwater SGD generally are one order of magnitude lower than such total SGD fluxes [e.g. Stieglitz et al. 2013]. While radionuclide-derived values are useful from a geochemical perspective, they do not yield estimates comparable to freshwater flow estimates based on hydrogeological or geophysical approaches, unless combined with other tracers such as salinity [e.g. Stieglitz et al. 2013; Weinstein et al. 2007]. Similar to the quantification of recharge, no estimates other than those produced by hydrogeological modeling are available for freshwater SGD [e.g. Zektser et al. 2007] or saline intrusion.
Since 2002, a satellite monitoring of Earth’s gravity field (GRACE experiment) enables groundwater mass storage (GWS) variation assessments over large regional-scale aquifer systems. Satellite approaches provide an integrated view of processes over large areas, which would be much more time- and cost-consuming to obtain from ground observations, if not impossible. GRACE data have been widely used for quantifying aquifer storage changes [e.g., Ahmed et al. 2014; Bonsor et al. 2018; Carvalho Resende et al. 2019; Leblanc et al. 2009; Ramillien et al. 2014; Richey et al. 2015; Rodell et al. 2009]. Some studies used a global mass balance to estimate the domain-averaged recharge for large regional aquifers of the Saharan belt [Gonçalvès et al. 2013; Mohamed et al. 2017]. Similar to these studies, GRACE-derived groundwater mass variations (𝛥GWS) could be combined with ground data to estimate hydrological variables such as the recharge or the coastal fluxes independently from any hydrogeological model. However, all these previous applications using GRACE data have been carried out on large surface basins (>100,000 km2). In fact, due to the relatively low resolution of the GRACE data (>1°) and signal-to-noise ratio issues, poor quality applications are expected for basins with a surface area of less than about 100,000 km2. One way to address this problem for more local-scale basins such as the Djeffara aquifers system is to downscale the GRACE data using ground-based information or data assimilation systems variables [Miro and Famiglietti 2018; Seyoum et al. 2019].
In this context, GRACE-derived 𝛥GWS for the Djeffara domain are first downscaled at the resolution of the gridded annual average rainfall (AAR) data (0.5° × 0.5°) assuming a major control of pumping wells on 𝛥GWS. The weights in the downscaling approach proposed here are therefore based on the distance to pumping well areas and pumping rates. Downscaled GRACE-derived 𝛥GWS values are compared to their independent calculations of groundwater mass variations based on ground data, i.e., aquifer storativity and water level drawdown values available for the Libyan Djeffara. The classical groundwater mass balance equation is discretized over the 0.5° × 0.5° grid introducing the fluxes to be ascertained, i.e., the recharge and the coastal fluxes as well as the downscaled 𝛥GWS values. Then, the linear system of discrete mass balance equations obtained was solved for recharge and saline intrusion or SGD assuming a linear relation between average annual rainfall (AAR) and recharge. The results, which are the first independent estimates from any numerical models to our knowledge, are discussed in comparison with hydrogeological modeling outputs as well as with SGD flux estimates based on radium tracer approaches.
2. Material
2.1. Hydrogeological context
Located between the Mediterranean coast and the mountains of the Nafusa mountains to the south and the Dahar to the west, the Djeffara plain covers a surface area of about 48,000 km2 over east-southern Tunisia and northern Libya (Figure 1a). This region receives an annual average precipitation of about 200 mm for a potential evaporation of 2760 mm characterizing an arid climate [Trabelsi et al. 2009]. The mountains (jebels) correspond to anticlines that structurally separate the Djeffara Plain from the north-western Sahara Aquifers System (NWSAS, “Continental Intercalaire” CI and “Complexe Terminal” CT aquifers Figure 1b). The Djeffara basin is characterized by an almost continuous stratigraphic succession from the Permo-Triassic to the Quaternary [OSS 2006]. However, in the southern Libyan part, the Triassic layers are unconformably overlain by Miocene formations (erosion surface). Therefore, from a (hydro)geological standpoint, the Djeffara plain can be subdivided into a northern domain (Tunisia) where the aquifer formations are mainly the Senonian and Mio-Plio-Quaternary units, and a southern domain where the Triassic and Miocene formations are of primary importance in addition to the Plio-Quaternary deposits. Overall, the stratigraphic succession can be closely examined to define a multilayered aquifer system with lateral variations from the Tunisian to the Libyan Djeffara. In Tunisia, the Trias is composed of sandstones, dolomites, and, in the upper part, an intercalation of clay and evaporites which extends stratigraphically until the Jurassic. The Trias and Jurassic formations are overlain by the dolomitic Turonian and the calcareous Senonian formations which constitute the main exploited and productive aquifer together with the Mio-pliocene-Quaternary sands. The Mio-pliocene-Quaternary aquifer is separated from the Senonian by more or less continuous marly gypsum and clayey formations. In Libya, the Lower Triassic consists of sandy clay then dolomite, marls, and clay layers overlain by sandstone. The Upper Triassic and Lower Jurassic are made of gypsum and anhydrite. The Jurassic and Cretaceous formations (only along Nafusa Mountains) are of small hydrogeological importance either because they are absent (erosion) or because they are not really exploited [Ben Lasmar et al. 2017]. From bottom to top, the Miocene begins with a clay layer followed by a limestone formation (sometimes referred to as the Lower Miocene Aquifer), then a sandy limestone (Middle Miocene Aquifer). Separated from the latter by a sandy clayey layer, the Mio-Plio-Quaternary is extremely heterogeneous (sand, alluvial deposits, limestones, clay) and intensively exploited in terms of groundwater.
The hydrostratigraphic analysis conducted by OSS [2006] leads to the definition of three aquifers which are in fact multilayer aquifers. The Upper Miocene, Pliocene, and Quaternary deposits form a continuous aquifer over the entire Djeffara (known as the phreatic or Upper aquifer). The Lower and Middle Miocene, also associated with the Jurassic and Upper Triassic when confining units are absent, form the Middle aquifer (deep coastal aquifer). The deep aquifer comprises the Lower and Middle Triassic formations.
Groundwater flow directions are generally from the reliefs of the jebels Nafusa and Dahar to the coast and therefore mostly from west to east in the Tunisian part and almost south to north in the Libyan Djeffara. All aquifers are characterized by high transmissivities between 1 × 10⁻² and 5 × 10⁻² m2⋅s−1 and the regional hydraulic head gradient is in the order of 0.1% [OSS 2006]. Interestingly, introducing these values in a Darcy flow calculation for a coastal length of 450 km leads to a horizontal drainage of 4.5 to 22.5 m3⋅s−1 using the above transmissivity range which can be translated into a steady-state recharge of between 3.0 and 14.8 mm⋅yr−1. Recharge occurs locally, either focused or diffuse as well as from inflows at the boundaries. Recharge estimates (natural and irrigation return flow) were obtained from modeling approaches at 6.8 mm⋅yr−1 [1.8 mm⋅yr−1 for focused recharge; OSS 2006]. Using a water table fluctuation method and soil moisture profiles, Allemmoz and Olive [1980] found a recharge of 10 mm⋅yr−1 in the area of Tripoli (Libya) exclusively from focused recharge (wadi flood infiltration). Zouari et al. [1985] used chloride and stable isotope of water profiles in the vadose zone near Gabès (Tunisia) to estimate infiltration (5 mm⋅yr−1) and evaporation (1 mm⋅yr−1, presumably from the water table) leading to a net diffuse recharge of about 4 mm⋅yr−1.
Groundwater inputs at the boundaries of the Djeffara aquifer system correspond to (i) a horizontal flow from the south in the Trias at the Nafusa [OSS 2006] and (ii) an upward flow along faults which is one of the main outflows of the deep confined CI aquifer of the NWSAS [Gonçalvès et al. 2015]. Heavy groundwater exploitation (see Section 2.3) causes continuous seawater intrusion and salinization of groundwater. This was particularly reported in the most populated Tripoli area [Alfarrah and Walraevens 2018; Sadeg and Karahanoglu 2001]. Groundwater salinization by dissolution of evaporites is also documented [Trabelsi et al. 2012].
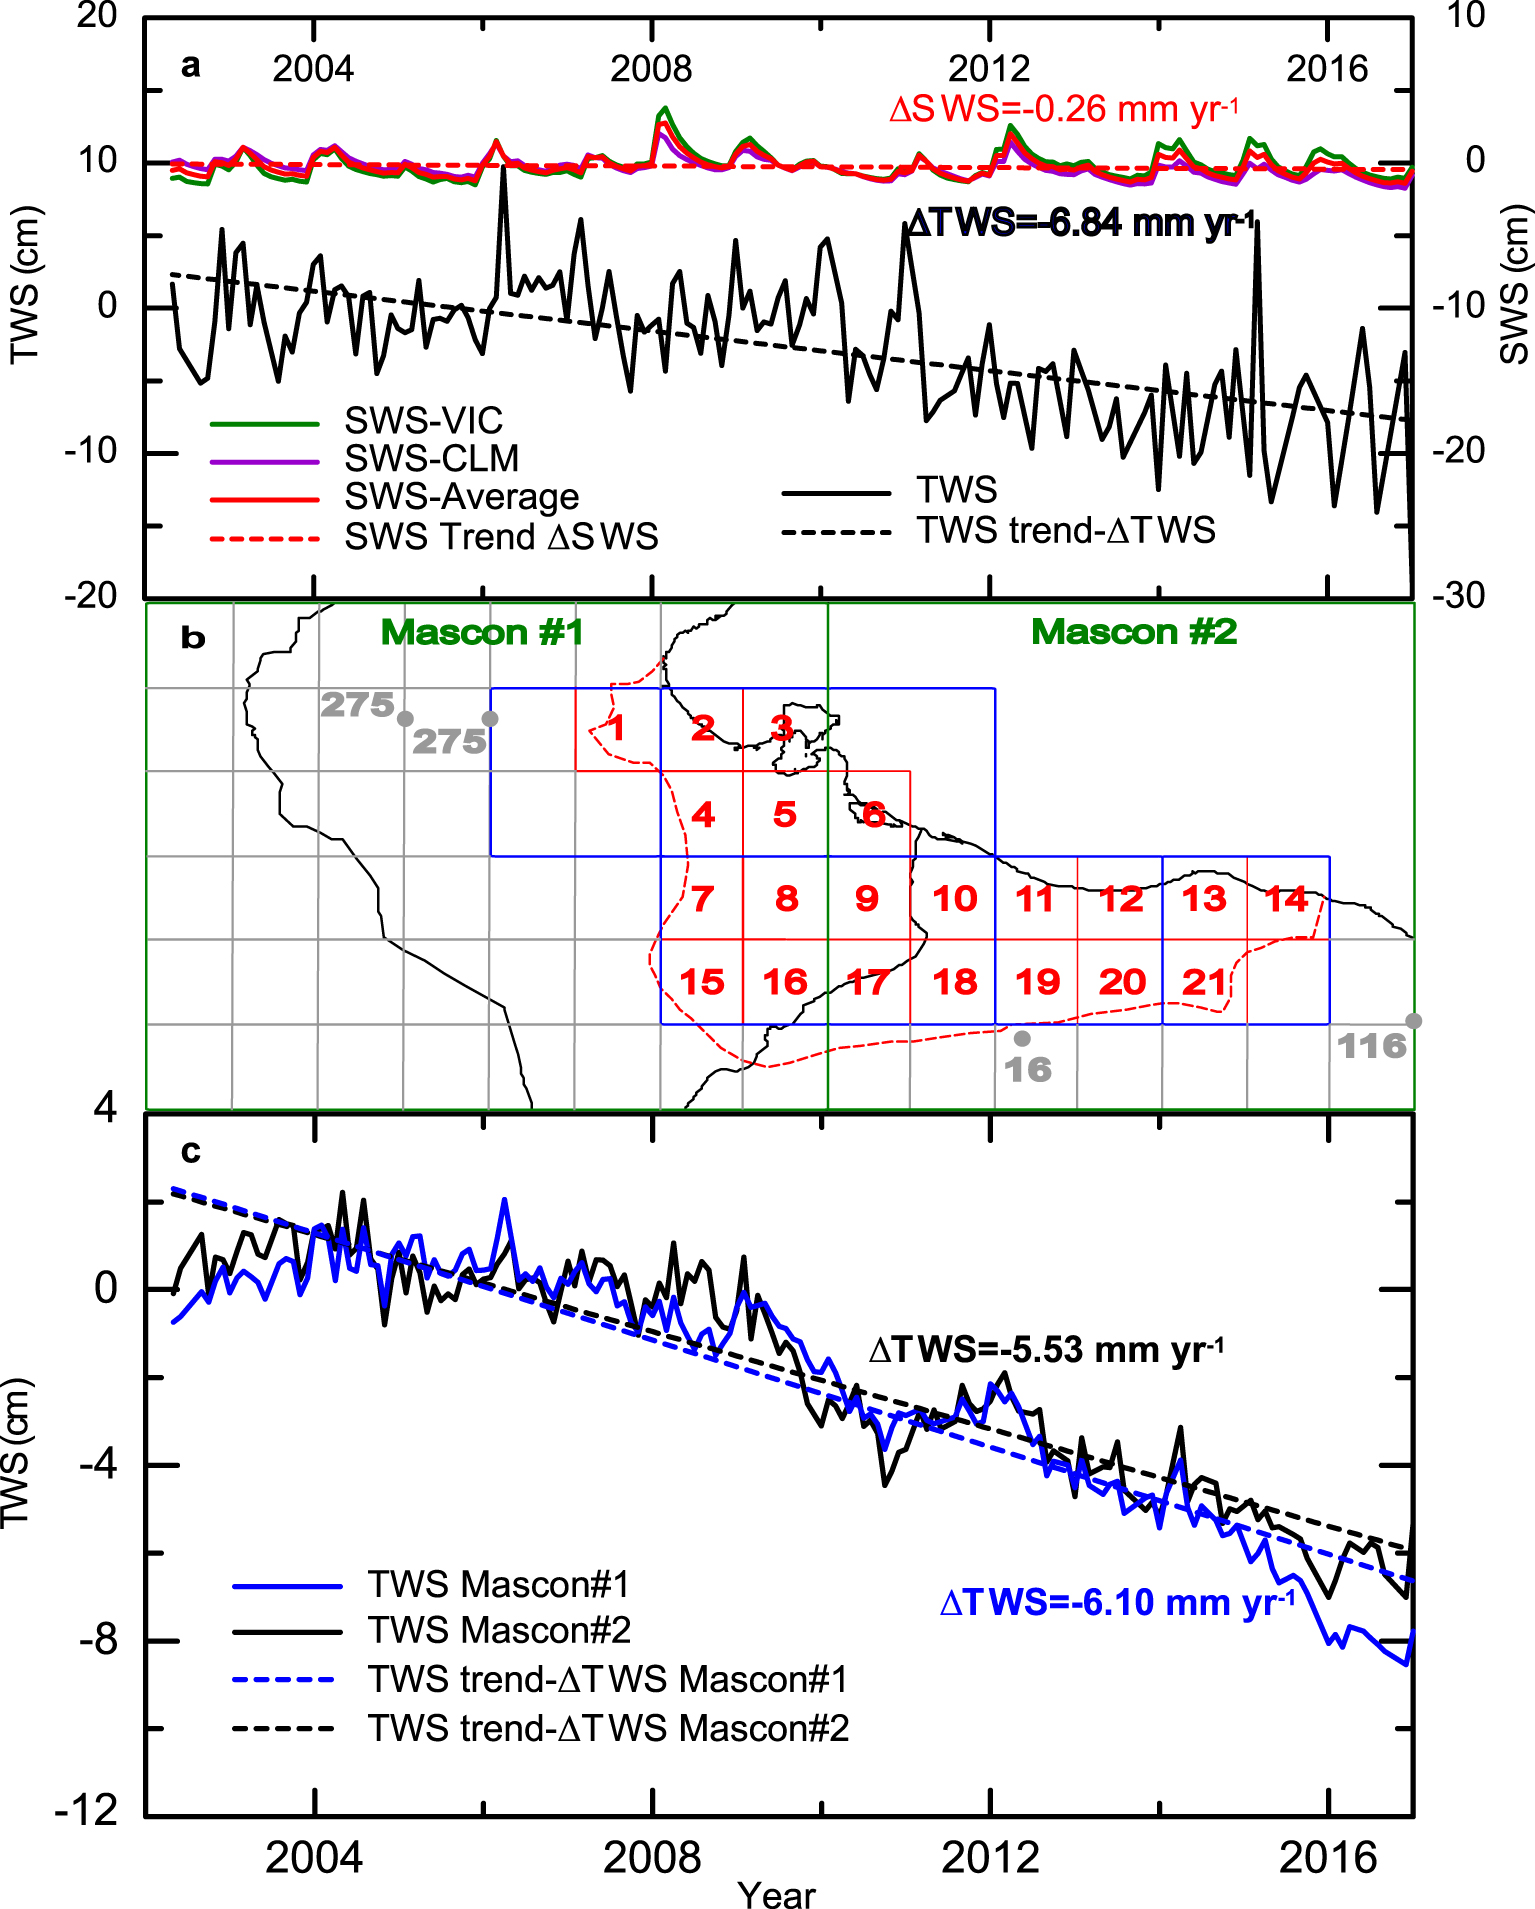
(a) Domain-averaged time series for the Terrestrial Water Storage (TWS) and the Soil Water Storage (SWS) using VIC and CLM models, and linear trends corresponding to TWS and SWS variations (𝛥TWS and 𝛥SWS), (b) Geographical distribution of GRACE data and downscaling grid with in blue GRACE-SH 1° × 1° grid, in green GRACE-M 3° × 3° grid, in red the 0.5° × 0.5° grid corresponding to the CRU AAR data, in gray the 0.5° cells outside the Djeffara domain (NWSAS), and plain gray circles are the centroïds used for the downscaling in the NWSAS domain with the indication of the overall pumping rates, and (c) time series for the Terrestrial Water Storage (TWS) for the land areas of the two Mascons corresponding to the Djeffara plain with the linear trends 𝛥TWS. Masquer
(a) Domain-averaged time series for the Terrestrial Water Storage (TWS) and the Soil Water Storage (SWS) using VIC and CLM models, and linear trends corresponding to TWS and SWS variations (𝛥TWS and 𝛥SWS), (b) Geographical distribution of GRACE data and downscaling grid ... Lire la suite
2.2. GRACE and GLDAS data
The GRACE twin-satellite system launched in 2002 by NASA and the German Aerospace Center (DLR) monitors the earth gravity on a monthly basis [Tapley et al. 2004]. The mission is based on the assumption that gravity variations are mostly due to mass variations in water bodies (groundwater, soil water, and surface water). Such data expressed in water height can thus be used for hydrological mass balance calculations at the regional scale. After more than one decade of gravity field processing using spherical harmonics (SH), an alternative interpretation using Mass Concentration blocks or Mascons (M) of discrete spherical caps at Earth’s surface was proposed in recent years, GRACE-M [Watkins et al. 2015]. The main disadvantage of the GRACE-SH solution is a noisy signal which requires a filtering post-processing in which an undetermined fraction of the geophysical signal is lost [Landerer and Swenson 2012]. A fraction of these signal losses can be recovered by using gain or scale factors obtained, for instance, by minimizing filtering signal degradation (undesired filter effect) using land surface model (LSM) water mass outputs [Landerer and Swenson 2012]. Conversely, GRACE-M requires less post-processing treatment due to lower geophysical signal losses. However, mascon gravity data interpretation with a native resolution of 3° × 3° for the Jet Propulsion Laboratory (JPL) data center solution used here (see below) produces a smooth signal, which is a serious limitation for hydrological applications that require a higher resolution and thus downscaling approaches [Wiese et al. 2016]. Two alternative solutions can therefore be used: (1) GRACE-SH, which is noisier but whose resolution (1° × 1°) is closer to the target one (0.5° × 0.5°), and (2) GRACE-M, which is less noisy but requires further downscaling efforts. In this study, we used both solutions for comparison. Monthly GRACE-derived Terrestrial Water Storage (TWS) anomalies (difference between a TWS value and its average value calculated for the period January 2004–December 2009) were retrieved from the JPL data center (http://grace.jpl.nasa.gov). GRACE-SH data correspond to the RL05 solution from the Centre for Space Research (CSR, University of Texas, http://www.csr.utexas.edu/grace/) scaled with the scaling factor of the NCAR-CLM4.0 model [Landerer and Swenson 2012]. GRACE-M data are the RL06M solution from JPL. We retrieved the JPL R06M filtered from the contribution of oceans [CRI filter, Wiese et al. 2016], therefore giving the TWS time series corresponding only to the land part of a Mascon. The proposed scaling factors which correspond in fact to downscaling factors [Scanlon et al. 2016] were not used here since an alternative approach is proposed. These downscaling factors are based on the mass distribution calculated by LSM (soil–atmosphere models) while water height in the Djeffara plain is expected to be mostly controlled by groundwater mass variations. Therefore, we derive a specific downscaling algorithm in this study. We used 170 monthly solutions for the period between April 2002 and December 2016 (Figure 2). This is the period with the minimum amount of missing GRACE-SH data and fairly close to the end of the period when water level data are available. The trend of a TWS time series can be analyzed and interpreted in terms of water amount variation (e.g., in mm⋅yr−1) over a land surface and thus water fluxes over a domain of interest.
As outlined above, TWS accounts inextricably for groundwater, surface water, and soil moisture. Therefore, and in the absence of substantial surface water in the Djeffara plain, Soil Water Storage (SWS) has to be integrated to identify Groundwater Storage (GWS). However, soil water storage variations (𝛥SWS) are usually small due to almost constant and low soil moisture in arid areas, and may represent a small or even negligible component of TWS [Gonçalvès et al. 2013; Nimmo et al. 1994]. We can easily verify the relative importance of 𝛥SWS using GRACE-SH data whose resolution is the same as the SWS data and which correctly describes the Djeffara plain (see Figure 2b for GRACE-SH and GRACE-M grid cells location). For this purpose, soil storage data were obtained from Global Land Data Assimilation System (GLDAS), which provides soil moisture for the first meters by combining ground-based, satellite data and hydrological surface model results [Hogue et al. 2005; Rodell et al. 2004]. We retrieved monthly data from the Variable Infiltration Capacity (VIC) and the Community Land Model (CLM) versions with a 1° × 1° degree spatial resolution (http://disc.sci.gsfc.nasa.gov/). VIC and CLM were previously recognized as the best models for the Saharan region [Gonçalvès et al. 2013]. The time series for the SWS (anomalies from their average value calculated over the period 01/2004–12/2009 as TWS) and TWS averaged over the Djeffara plain are shown in Figure 2a which provides a 𝛥TWS value by far greater than 𝛥SWS. Considering GRACE-M data, Mascons #1 and #2 extend beyond the Djeffara plain domain, i.e., over the NWSAS domain (Figure 2b), making the comparison between 𝛥SWS and 𝛥TWS more difficult. The 𝛥TWS values for land surfaces of Mascons #1 and #2 are − 6.1 ± 0.2 and − 5.5 ± 0.2 mm⋅yr−1, respectively (Figure 2c). These values are also substantially larger than the 𝛥SWS of less than 0.5 mm⋅yr−1 discussed above for the Djeffara (Figure 2a) and reported for the NWSAS [Gonçalvès et al. 2013]. Therefore, for both GRACE-SH and GRACE-M data, the contribution of 𝛥SWS to 𝛥TWS is considered negligible.
2.3. Hydrological data
Prior to the 1940s, most of the water used was supplied by springs, notably in Tunisia. With the development of pumping wells and the continuous increase of withdrawals, the water fraction supplied by springs declined until their complete drying up [OSS 2006]. Pumping rates are available for years 1950, 1972, 1978, and 2003 from OSS [2006], and for year 2011 (only global exploitation) from Alfarrah and Walraevens [2018]. The most documented study from OSS [2006] presents relatively precise values for irrigation but highly approximate pumping rates for domestic water. Since most of the domestic water consumption occurs in the Tripoli area, we have considered the more accurate data by Sadeg and Ghazali [2008]. In this study, domestic water pumping (about 6% of the withdrawals) will be considered explicitly only in the Tripoli area where a salt mass balance calculation is made. For Tunisia, OSS [2006] provides overall pumping rates, i.e., domestic and irrigation uses. However, pumping in Tunisia represents only about 15% of the global withdrawals in the Djeffara plain as shown in Figure 3. This figure describes the temporal evolution of global withdrawals for the whole Djeffara showing a linear increase from almost zero in 1945 to a value of 1.0 km3⋅yr−1 in 2011. Most of the extracted groundwater, i.e., 61%, comes from the Upper aquifer, 32% from the Middle aquifer, and the remaining fraction (7%) from the Triassic aquifer. The only area where the increase in pumping rates is not linear but seems to reach a plateau is the Tripoli region. This may be explained by a combination of salinization problems and the substitution of some part of local water demand by groundwater from aquifers in southern Libya (Nubian sandstones) conveyed by a pipeline, the Great Man-Made River (GMMR), sourcing water from outside the catchment. This is clearly true for domestic water supply until 1997 produced by local wells in the Tripoli area, and since then exclusively supplied by the GMMR at a rate of 146 × 106⋅m3⋅yr−1 [Alfarrah and Walraevens 2018; Sadeg and Ghazali 2008]. Therefore, intensive groundwater pumping for domestic water mainly concerned the Tripoli area and was interrupted in 1997 with the connection to the GMMR system.
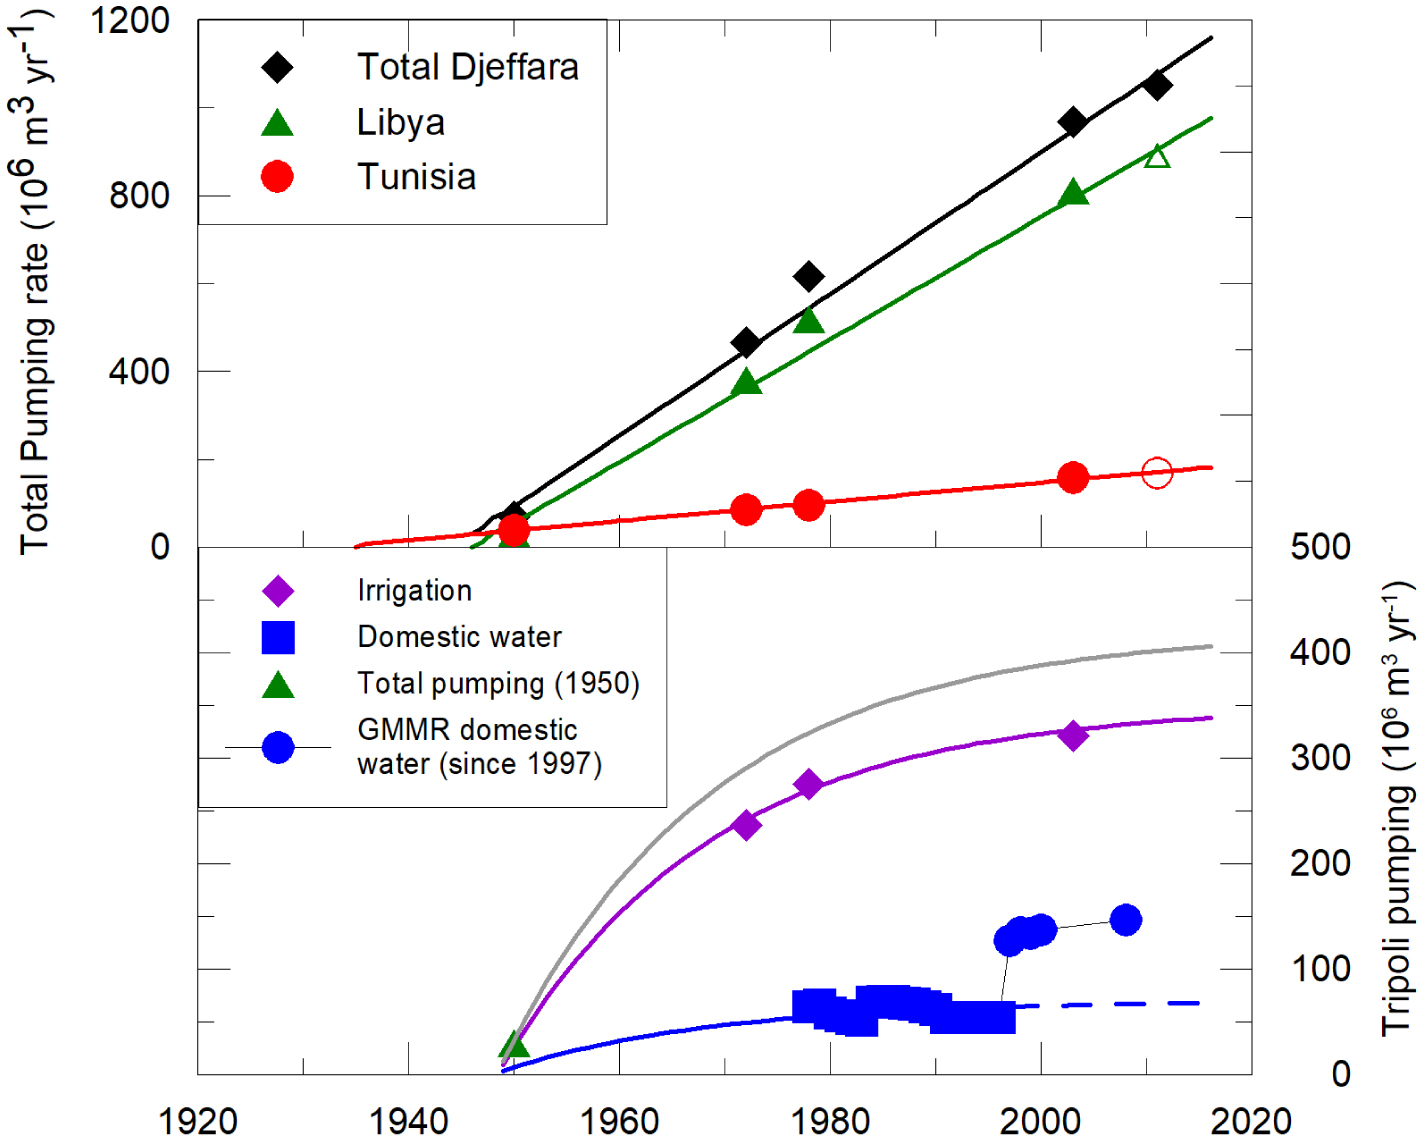
Temporal evolution of pumping rate. Symbols for data and solid lines are fitted regressions mostly linear except for the Tripoli area in the lower panel (exponential functions, see Section 3.3). Open symbols are used for values calculated using the total withdrawals in 2011 and pumping fractions for Tunisia and Libya. In the lower panel, domestic water is provided by local pumping wells until 1997, then wells in the Tripoli area were stopped and GMMR water was supplied; the gray line is the sum of irrigation and local domestic water consumption. Masquer
Temporal evolution of pumping rate. Symbols for data and solid lines are fitted regressions mostly linear except for the Tripoli area in the lower panel (exponential functions, see Section 3.3). Open symbols are used for values calculated using the total ... Lire la suite
Considering the recharging fluxes at the western and southern boundaries of the system, a constant value of 2.6 m3⋅s−1 was estimated for the Triassic flux by means of a hydrogeological model [OSS 2006]. Using an approach combining water stable isotopes, geostatistical and reservoir simulations, and a simple hydrological model based on piezometric levels, Gonçalvès et al. [2015, 2020] obtained a temporal variation for the recharging flux from the CI to the Djeffara aquifers showing a decline from 1.8 m3⋅s−1 in 1950 to 0.6 m3⋅s−1 in 2009 due to the overexploitation of the CI aquifer. In addition, global rainfall rates beginning in 1901 were retrieved from the CRU data center (Climatic Research Unit, http://wps-web1.ceda.ac.uk) at a resolution of 0.5° × 0.5°. These values indicate an annual domain-averaged rainfall rate of around 200 mm⋅yr−1 for the Djeffara plain.
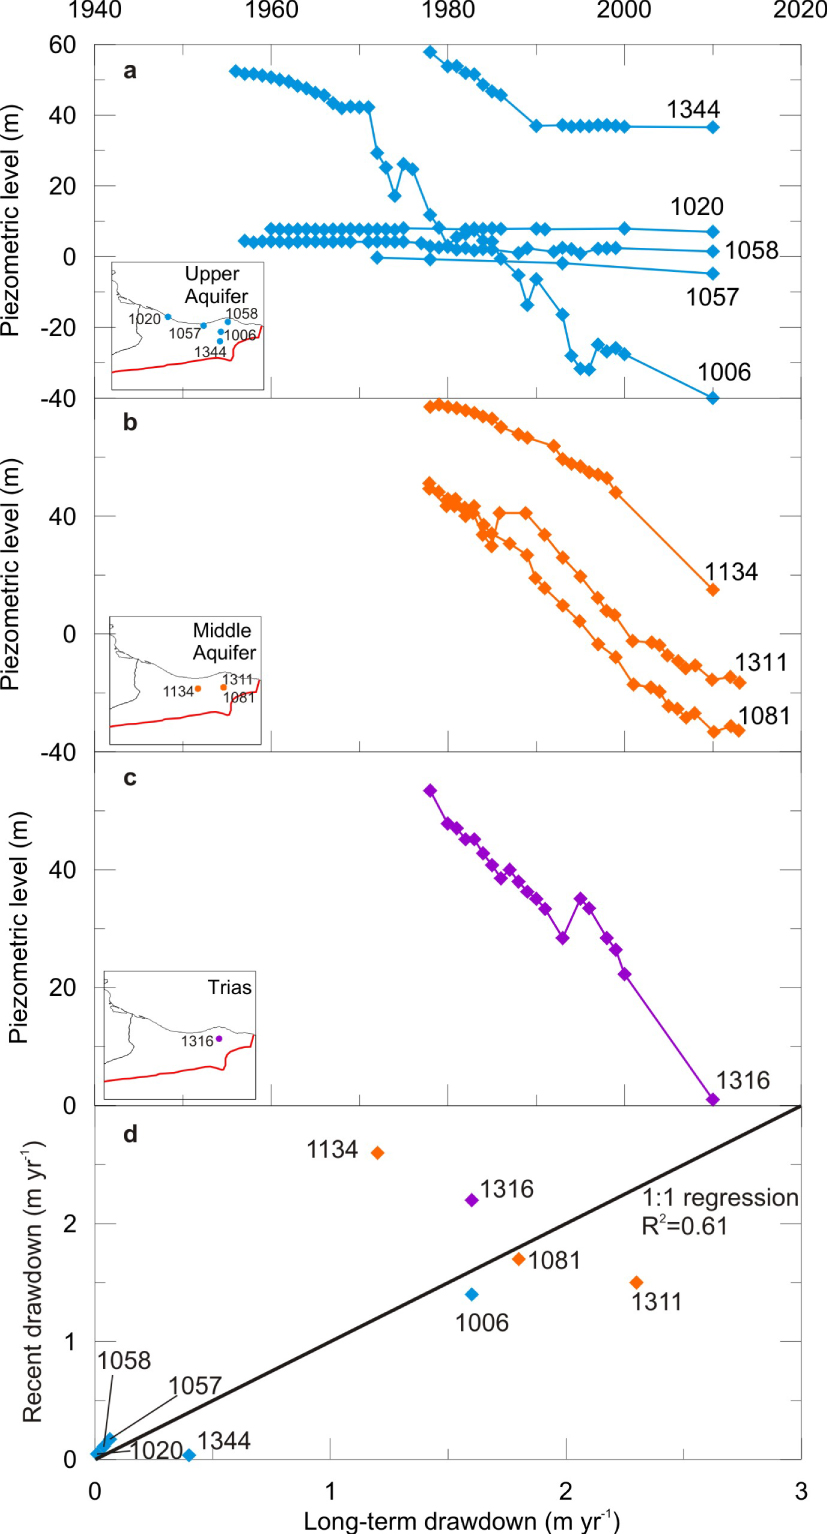
Piezometric times series for (a) the Upper aquifer, (b) the Middle aquifer, and (c) the Trias; (d) comparison between long-term drawdown values (until 2003) from OSS [2006] and recent drawdown after 2002 in m⋅yr−1.
Piezometric information available from OSS [2006] is mostly made of cumulative drawdown 𝛥h values in 2003, and drawdown (not absolute piezometric levels) time series but for a small fraction of piezometers. Moreover, the data is not homogeneously distributed over the domain with a higher density in Libya especially for the Upper aquifer (10 data in Tunisia against 33 in Libya). Therefore, ground-based 𝛥GWS estimates were focused on the Libyan Djeffara (cells 11–14, 19–21, Figure 2). Drawdown data from OSS [2006] do not fully cover the period of investigation here (2002–2016). Extending the applicability of such 𝛥h data requires analyzing longer time series. Piezometric levels time series until the 2010’s could only be reconstructed for nine piezometers (see Figure 4a, b, and c) using punctual hydraulic head values [1972, 1978, 1993, and 2010; Gejam 2018], and drawdown records [OSS 2006; Saleh and Rashrash 2015]. Among the available piezometers, well 1006 is of particular importance since it belongs to the reference piezometric network and is located at the center of the major piezometric depression affecting the Upper aquifer in Libya. This piezometer shows an almost continuous deepening of the piezometric depression. Continuous albeit moderate drawdown is also recorded in coastal piezometers (1020, 1057, and 1058; Figure 4a) while piezometer 1344 shows a stabilization which is inconsistent with the overall piezometric behavior. Piezometers in the Middle and Trias aquifers show a continuous lowering of the piezometric level. The comparison between recent drawdown (since 2002) and long-term values given by OSS [2006] shown in Figure 4d and expressed in meters per year for comparison suggest that the latter can be used for the recent period considered here (2002–2016) within an error of about 16% (regression slope uncertainty). Moreover, these drawdown values are the only independent and relevant ground-based estimates for comparison purposes with the GRACE-derived estimates. Ground-based GWS variations 𝛥GWSGWL can be calculated by linear interpolation of the long-term drawdown values 𝛥h [OSS 2006] on a 0.1° × 0.1° grid, then an averaging on a 0.5° × 0.5° grid and by calculating
Groundwater mass variations over the 2002–2016 period obtained by downscaling Grace-SH (𝛥GWSSH), GRACE-M (𝛥GWSM), and weighted averaged values 𝛥GWSA in mm⋅yr−1
| Cell | 𝛥GWSSH | 𝛥GWSM | 𝛥GWSA | Cell | 𝛥GWSSH | 𝛥GWSM | 𝛥GWSA | 𝛥GWSGWL |
|---|---|---|---|---|---|---|---|---|
| 1 | − 4.2 ± 0.4 | − 6.2 ± 0.2 | − 4.5 ± 0.3 | 11 | − 13.6 ± 1.3 | − 10.0 ± 0.3 | − 13.2 ± 1.2 | − 12.4 |
| 2 | − 2.8 ± 0.3 | − 8.1 ± 0.2 | − 3.4 ± 0.3 | 12 | − 18.1 ± 1.9 | − 14.8 ± 0.4 | − 17.8 ± 1.7 | − 15.3 |
| 3 | − 3.0 ± 0.3 | − 8.6 ± 0.27 | − 3.7 ± 0.3 | 13 | − 23.7 ± 2.9 | − 13.7 ± 0.4 | − 22.6 ± 2.6 | − 24.5 |
| 4 | − 2.4 ± 0.2 | − 6.8 ± 0.21 | − 2.9 ± 0.2 | 14 | − 15.7 ± 1.9 | − 8.8 ± 0.2 | − 14.9 ± 1.7 | − 14.0 |
| 5 | − 2.9 ± 0.3 | − 7.8 ± 0.2 | − 3.4 ± 0.2 | 15 | − 2.6 ± 0.2 | − 5.2 ± 0.2 | − 2.9 ± 0.2 | |
| 6 | − 1.4 ± 0.1 | − 5.5 ± 0.2 | − 1.9 ± 0.1 | 16 | − 3.2 ± 0.2 | − 6.3 ± 0.2 | − 3.5 ± 0.2 | |
| 7 | − 2.8 ± 0.2 | − 5.7 ± 0.2 | − 3.2 ± 0.2 | 17 | − 5.3 ± 0.5 | − 5.1 ± 0.1 | − 5.3 ± 0.5 | |
| 8 | − 3.5 ± 0.3 | − 6.7 ± 0.2 | − 3.8 ± 0.2 | 18 | − 6.1 ± 0.6 | − 6.1 ± 0.2 | − 6.1 ± 0.5 | |
| 9 | − 6.2 ± 0.5 | − 5.3 ± 0.1 | − 6.1 ± 0.5 | 19 | − 10.7 ± 1.0 | − 8.1 ± 0.2 | − 10.4 ± 0.9 | − 11.4 |
| 10 | − 7.7 ± 0.6 | − 6.8 ± 0.2 | − 7.6 ± 0.6 | 20 | − 13.2 ± 1.4 | − 10.5 ± 0.3 | − 12.9 ± 1.2 | − 12.2 |
| 21 | − 17.7 ± 2.1 | − 10.2 ± 0.3 | − 16.8 ± 1.9 | − 13.7 | ||||
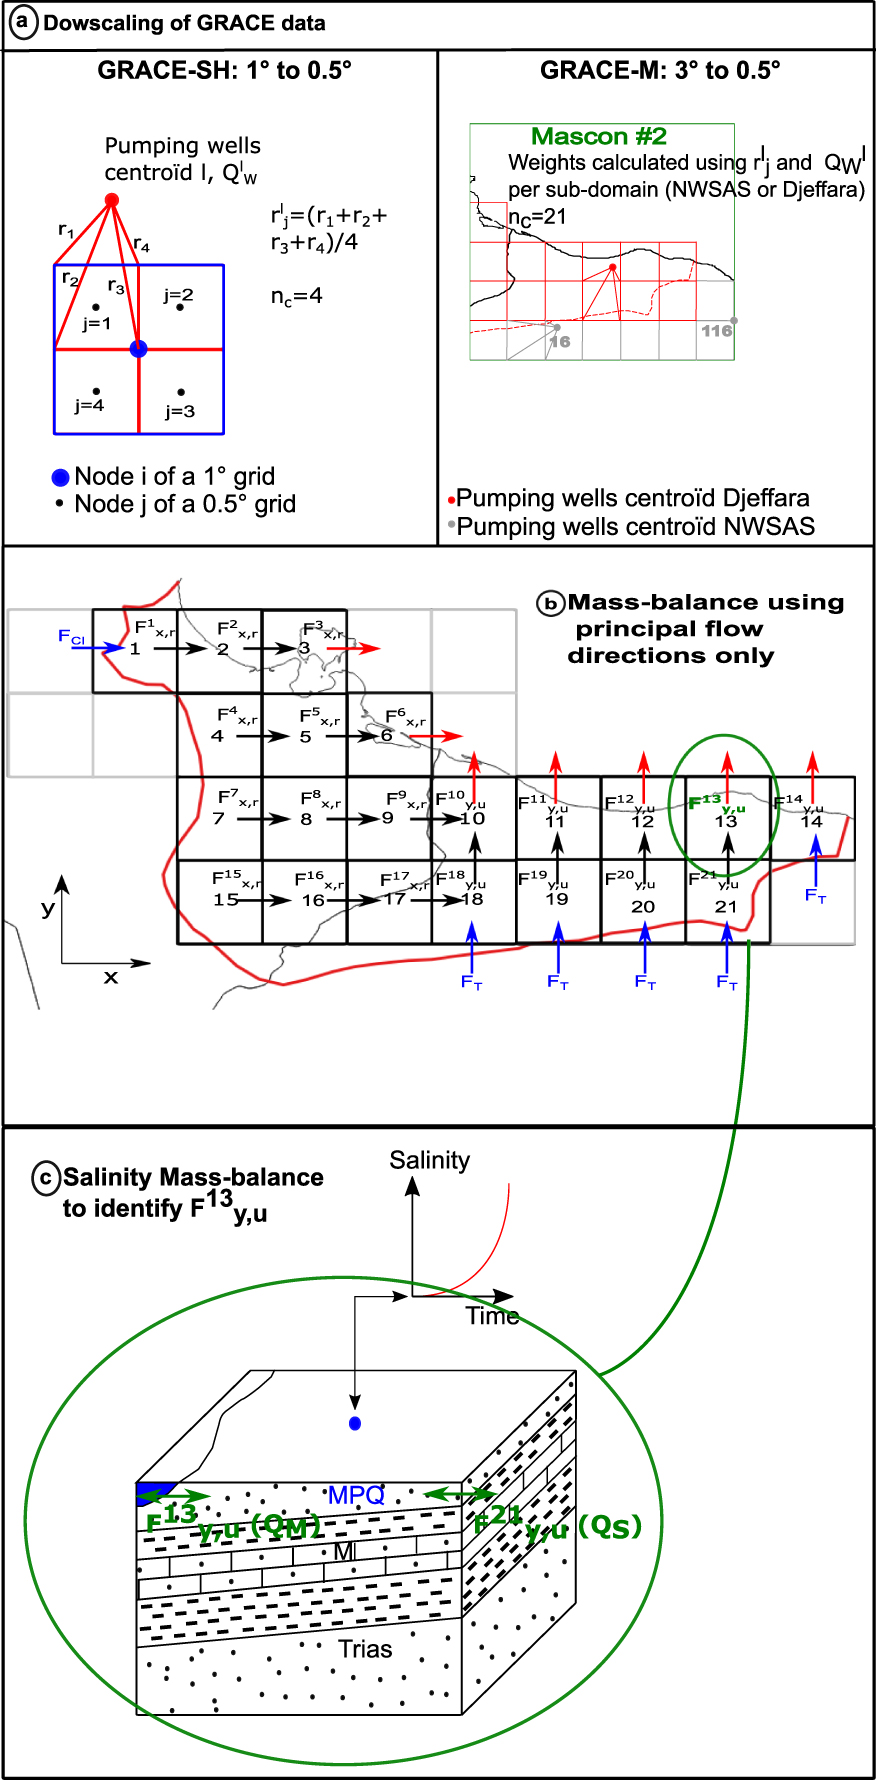
Methodological steps for the resolution of the linear system of groundwater mass balance equation solved for the natural recharge and the coastal fluxes. (a) Downscaling using the pumping wells centroids and overall pumping rates for GRACE-SH and GRACE-M data. (b) Discrete mass balance equations over the 0.5° × 0.5° grid with the blue arrows for the known boundary fluxes from the Trias (FT) and from the CI (FCI) and the red arrows are the unknown coastal fluxes. (c) The salt balance calculation in cell 13 corresponds to Tripoli. Masquer
Methodological steps for the resolution of the linear system of groundwater mass balance equation solved for the natural recharge and the coastal fluxes. (a) Downscaling using the pumping wells centroids and overall pumping rates for GRACE-SH and GRACE-M data. (b) Discrete mass ... Lire la suite
3. Methodological approaches
3.1. Downscaling GRACE-derived groundwater mass variations
Regional-scale groundwater budgets are used in this study to estimate different hydrological terms such as recharge, aquifer salinization, and SGD. The solution of such balance equations requires the groundwater mass variations 𝛥GWS to be estimated. GRACE data provide a valuable integrated mapping of water storage over large domains. This would be difficult to achieve using field data such as piezometric level monitoring due to discontinuous data acquisition in time and/or space. The first step is to isolate the groundwater storage anomalies (GWS) from the TWS anomalies expressed in water height to facilitate hydrological applications. In arid areas such as the Djeffara plain, surface water can generally be neglected leading to the following simple decomposition of the GRACE data:
| (1) |
| (2) |
Given the fact that
| (3) |
| (4) |
| (5) |
For consistency reasons, we considered average pumping rates for the same period as 𝛥GWS values, i.e., 2002–2016. The pumping rates in 2009 considered as accurate estimates of the average values over 2002–2016 were obtained by extrapolating the reported withdrawals in 1972, 1978, and 2003 for each pumping zone (centroid). It was verified that the cumulated extrapolated pumping rates satisfy the global value in 2009 (Figure 3) within an acceptable error (here about 10%). No further refinement of the grid in the north-west of the domain (first row) was made to avoid making the linear system resolution unnecessarily more complex for an uncertain gain in precision (see discussion). The mass balance grid is therefore maintained at the resolution of the AAR data. The flux
3.2. Mass balance approach
Groundwater storage variations 𝛥GWS provided by GRACE can be introduced in a regionalized mass balance equation to identify recharge and coastal exchange fluxes. For this purpose, we consider the groundwater mass balance equation for an aquifer system as:
| (6) |
| (7) |
| (8) |
3.3. Salinity model for the Tripoli refined grid cell
In order to solve the indetermination problem of the groundwater mass balance equations system of Section 3.2, a simple domain-averaged salinity model for the cell corresponding to the Tripoli region (cell 13, Figure 5b and c) is considered. Given the heavy withdrawals in this area, fresh groundwater discharge is assumed negligible. We consider that the coastal flux mostly corresponds to seawater intrusion which occurs mainly in the Upper aquifer, therefore neglecting the seawater fluxes for deeper aquifers. The time evolution of the salinity in the Tripoli area is sufficiently well documented which enables the calculation of average salinity values for the corresponding 0.5° × 0.5° grid cell using the salinity maps available for 1950, 1960, and 2000 from OSS [2006] for the Upper aquifer. The simple salinity mass balance equation in the Upper aquifer for cell 13 writes:
| (9) |
| (10) |
| (11) |
A simplified resolution of the salt balance equation (9) can be achieved by considering that the return flow is mainly related to irrigation (85% of the water pumped before 2000, i.e., the calibration period). The salt is extracted from aquifers at a rate
| (12) |
Equation (12) is used to reproduce the cell-averaged salinity values available at three measurement times by calibrating the initial (natural) salinity of the Upper aquifer in 1948
4. Results
GRACE-derived 𝛥GWS for the period 2002–2016 were downscaled based on the distance to the centroids of the pumping areas and on the pumping rates as reconstructed in 2009 (see Section 3.1, Figures 2b and 6a for locations and rates) to obtain the same resolution as the AAR data from the CRU (0.5° × 0.5°, Figure 6c). Downscaling produces realistic groundwater depletion especially in the region of Tripoli concentrating about one half of the Libyan withdrawals as shown in Table 1 and Figure 6b using GRACE-SH and GRACE-M data. A better agreement between downscaled GRACE-derived 𝛥GWS values and ground-based estimates 𝛥GWSGWL is obtained using GRACE-SH than GRACE-M as shown by the Root Mean Square error (RMSE) values in Figure 7. The discrepancy is mostly related to cell 13 (Tripoli) with a large underestimation. For groundwater budget calculations proposed hereafter, the average values 𝛥GWSA calculated as weighted mean values of 𝛥GWSSH and 𝛥GWSM using the MSE as weighting factors were adopted. The calculated domain-averaged value (using 𝛥GWSA in Table 1) for 𝛥GWS over the 0.5° square grid is about − 8.0 ± 0.2 mm⋅yr−1, which confirms that the depletion shown by the piezometric levels decline. GRACE data points to an overall aquifer depletion with 𝛥GWS values varying in space between − 1.9 and − 22.6 mm⋅yr−1. The highest depletion rate is observed in the Libyan part (Tripoli area).
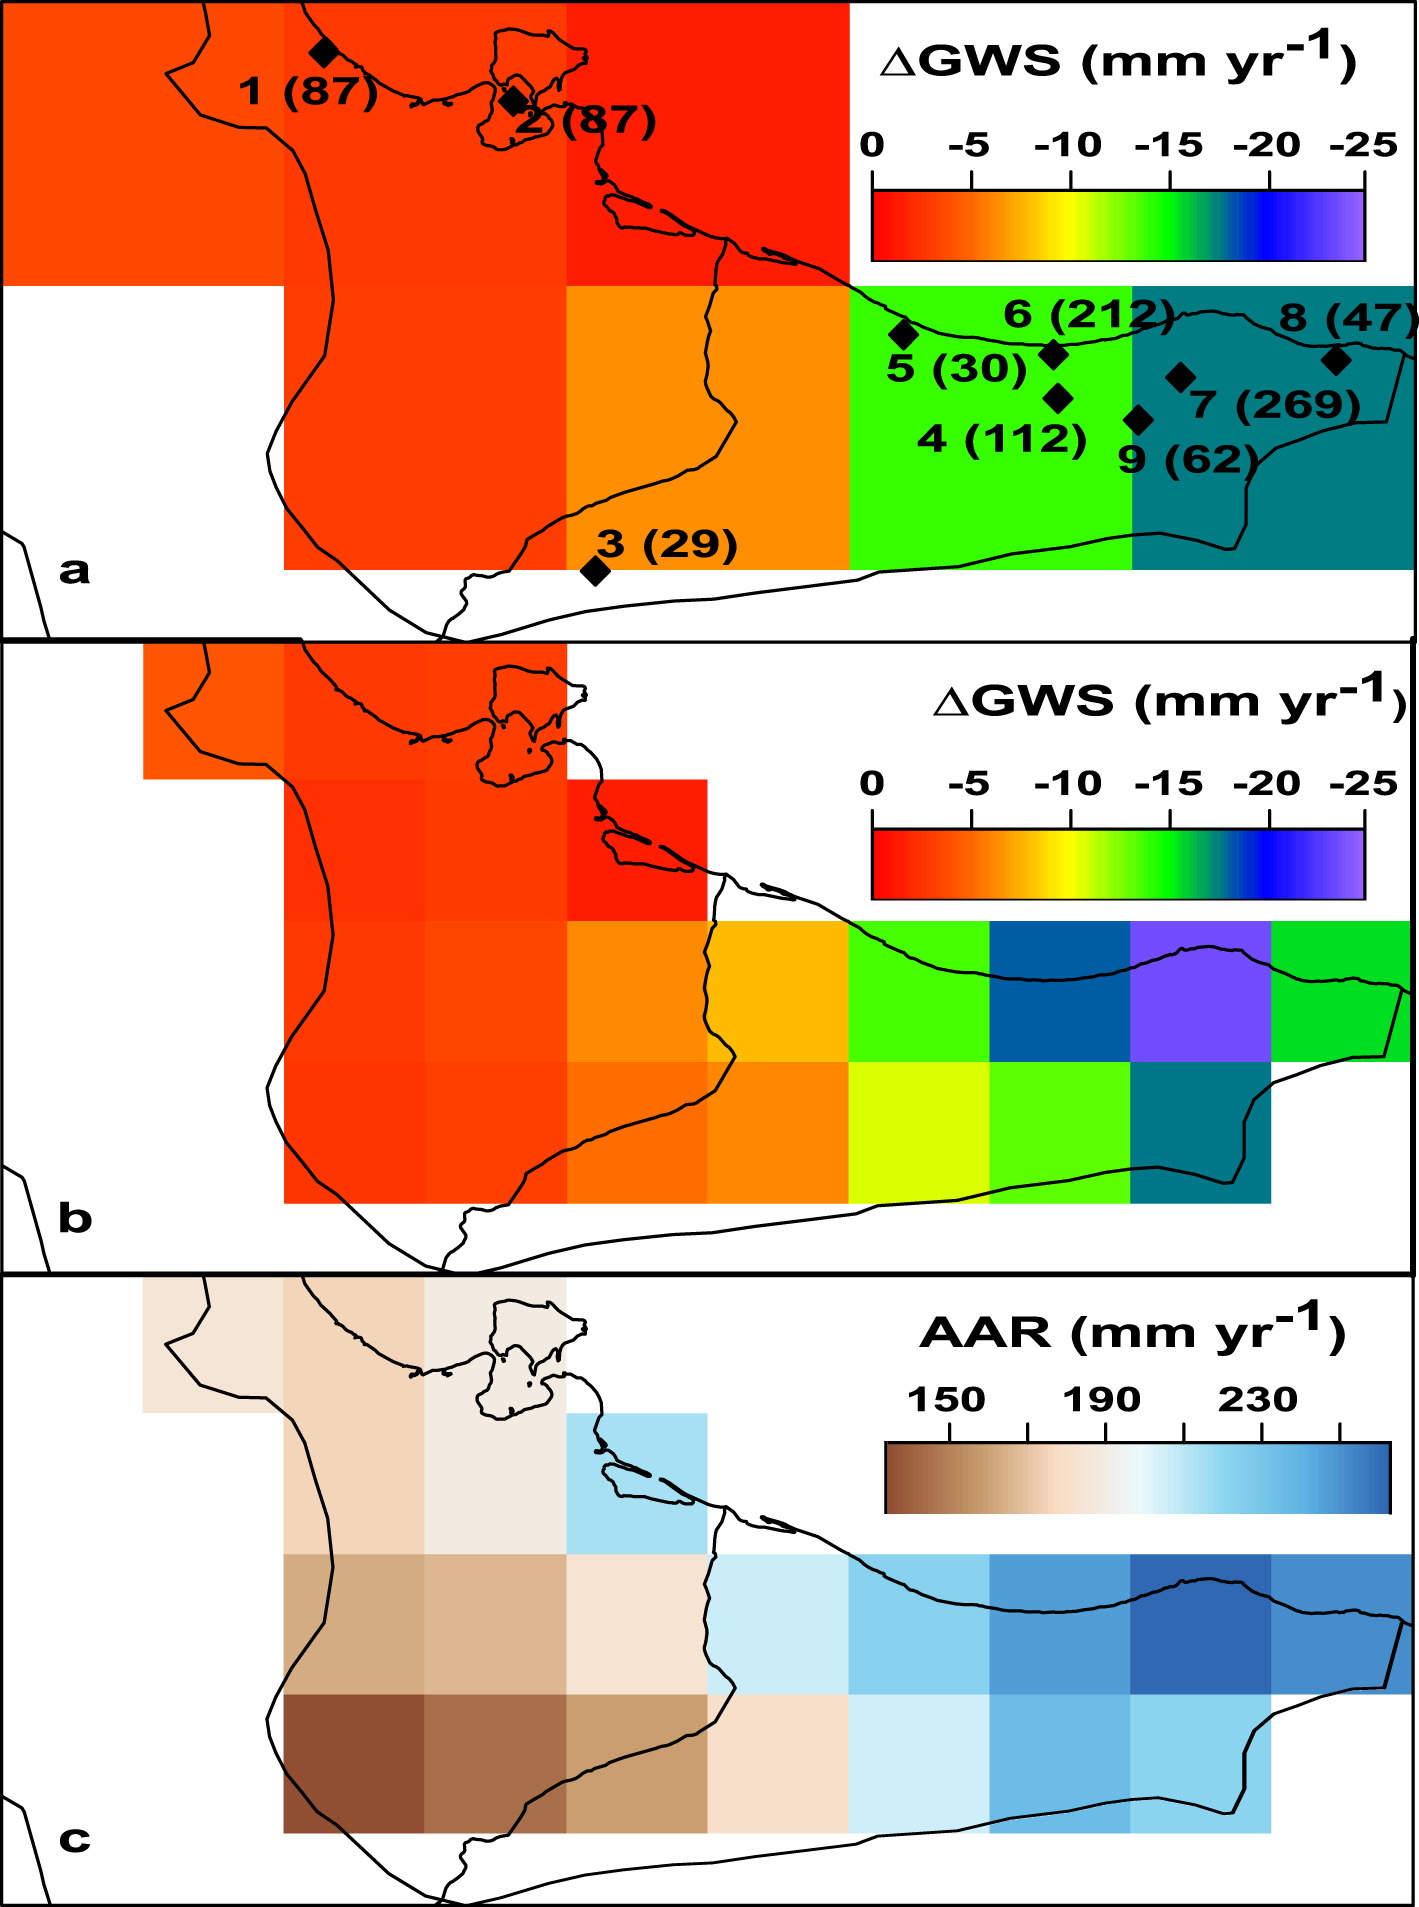
(a) GRACE-derived 𝛥GWS at 1° × 1° resolution using GRACE-SH data over the Djeffara Plain, black diamonds indicate the location of the pumping areas centroids (number and rate in 2009) used for the downscaling within the Djeffara plain domain, (b) downscaled GRACE-derived 𝛥GWS using GRACE-SH data, and (c) AAR data from the CRU.
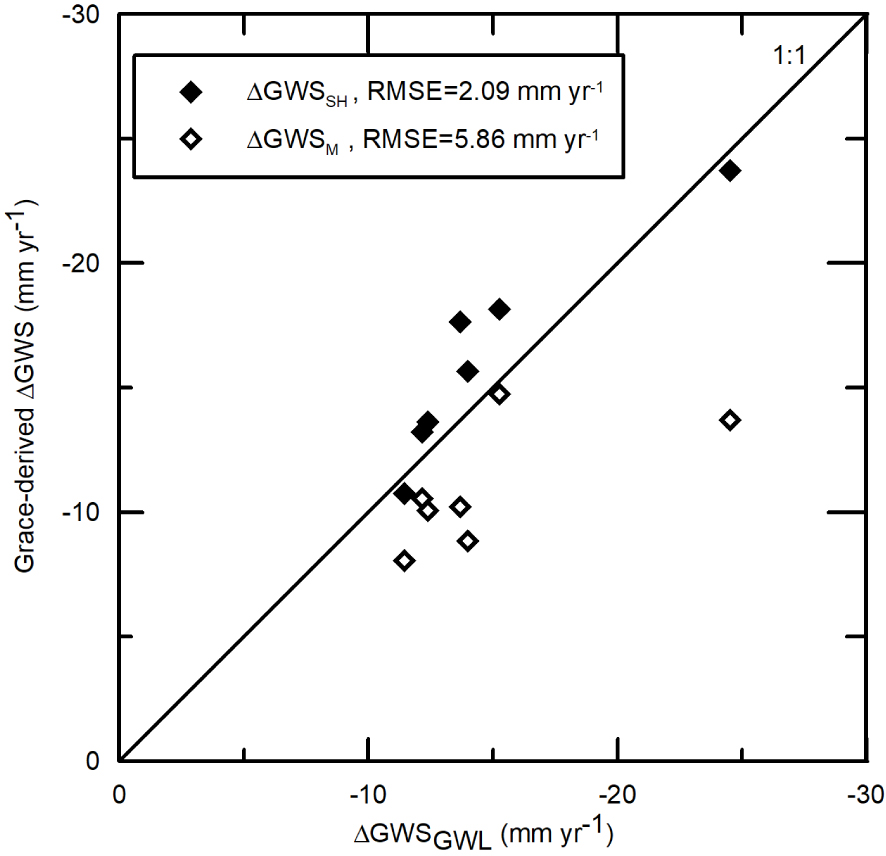
Comparison between GRACE-derived (using GRACE-SH 𝛥GWSSH or GRACE-M 𝛥GWSM) and Ground-derived (𝛥GWSGWL) groundwater storage variations in the Tripoli area with the Root Mean Square Error (RMSE) associated to each alternative GRACE data used.
The transient salt balance for the 0.5° × 0.5° cell corresponding to Tripoli (cell 13 in Figure 5b, see Section 3.3) was calculated to obtain an independent estimate of the seawater flux at the shoreline. This flux is required to enable solving the linear system (8) of groundwater mass balance equations accounting for the downscaled 𝛥GWS values. Combining the mass balance equations for cells 13 and 21 (Figure 5b) yields:
| (13) |
| (14) |
| (15) |
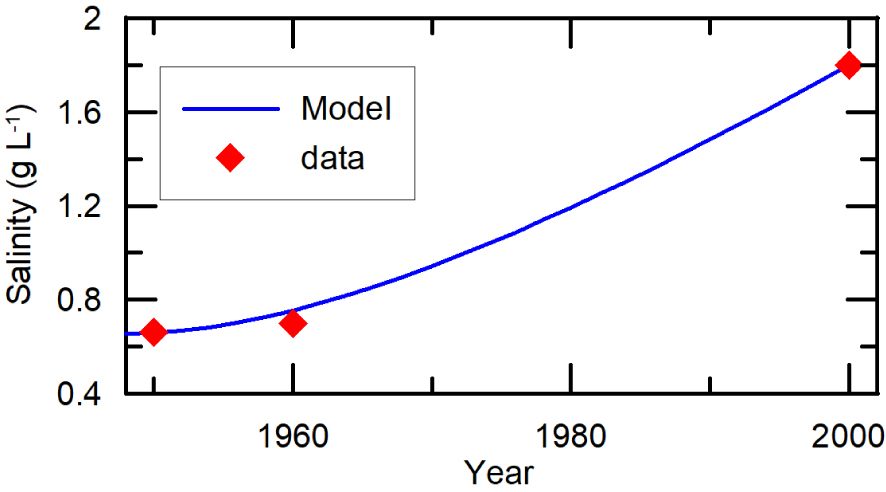
Calculated temporal evolution of the salinity (blue plain line) for cell 13 corresponding to Tripoli and average salinity values (red diamonds) derived from salinity maps in 1950, 1960, and 2000 [OSS 2006].
Terms of the groundwater budget for the 21 cells in Million m3⋅yr−1
| Cell i | Fi(×106 m3⋅yr−1) | |||
|---|---|---|---|---|
| 1 | 41.0 | — | 10.5 | — |
| 2 | − 3.7 | 87.0 | 10.0 | 23.5 |
| 3 | − 46.9 | 87.0 | 10.8 | 23.5 |
| 4 | 17.6 | — | 10.0 | — |
| 5 | 37.2 | — | 10.8 | — |
| 6 | 54.3 | — | 12.3 | — |
| 7 | 17.5 | — | 9.3 | — |
| 8 | 36.9 | — | 9.5 | — |
| 9 | 63.0 | — | 10.5 | — |
| 10 | 170.9 | — | 11.8 | — |
| 11 | 79.8 | 30.0 | 12.8 | 8.1 |
| 12 | − 113.3 | 324 | 14.1 | 87.5 |
| 13 | − 34.0 | 331.0 | 15.0 | 89.4(62.8)∗ |
| 14 | 34.8 | 47.0 | 14.4 | 12.7 |
| 15 | 15.1 | — | 7.7 | — |
| 16 | 32.4 | — | 8.3 | — |
| 17 | 33.9 | 29.0 | 9.1 | 7.8 |
| 18 | 76.4 | — | 10.3 | — |
| 19 | 54.9 | — | 11.8 | — |
| 20 | 63.3 | — | 13.5 | — |
| 21 | 71.7 | — | 12.7 | — |
Lateral fluxes Fi (8) are positive when oriented in the same direction than x or y axis (see Figure 5). ∗ Value between parentheses is the domestic water leaks considered only for the Tripoli area. Coastal cells are indicated in bold character. The boundary fluxes FCI (cell 1) and FT (cells 18–21, 14; see Figure 5) are 18.9 × 10⁶ and 16.4 × 10⁶ m3⋅yr−1, respectively.
5. Discussion
Several simplifying hypotheses supporting our approach must first be discussed. The downscaling approach as developed here requires boundary fluxes for a given domain described by GRACE cells to be low in comparison with the internal withdrawals. This requirement is satisfied using GRACE-SH data, the resolution of which allows obtaining a domain close to the real geographical extent of the Djeffara characterized by low boundary fluxes. Using coarser GRACE-M grids which extend beyond the Djeffara limits and more precisely in the NWSAS domain raises the question of the boundary fluxes. According to the piezometric maps for the NWSAS [Baba-Sy 2005; Besbes and Horriche 2008], the net fluxes at the southern and western boundaries of Mascon#1 (Figure 2b) are almost zero for the CT (orthogonal hydraulic head contours). Regarding the CI, the piezometric map points to an entering flux at the western boundary of Mascon#1 corresponding to the outflow of the CI in the Djeffara plain estimated at 0.6 m3⋅s−1 (Section 2.3). Therefore, the neglected net boundary flow for Mascon#1 represents no more than 0.2 mm⋅yr−1 considering its surface area. For Mascon#2, the Nafusa represents a recharge area for both the CI and CT with a cumulated value at 1.7 m3⋅s−1 calculated by Baba-Sy [2005]. This would represent a neglected net boundary outflow of less than − 0.5 mm⋅yr−1 for Mascon #2. For both GRACE version (M and SH), considering small boundary fluxes is thus a reasonable assumption. In case of non-negligible boundary fluxes, the application of the proposed approach is more complex and requires additional steps: (i) identification of the net boundary flux, (ii) subtraction of this flux from the GRACE-derived 𝛥GWS signal to isolate the purely internal 𝛥GWS, (iii) application of the proposed downscaling approach and, (iv) addition of the net boundary flux to downscaled 𝛥GWS values.
A salt balance provides coastal flux estimates, assuming a constant volume of groundwater in the phreatic aquifer for cell 13 (Tripoli) along the simulation extending over the period 1948–2000. As active recharge and withdrawals are at work, this may represent a rough approximation. For the calculation period (1948–2000), the average pumping rate is 267 × 106 m3⋅yr−1, of which about 35% (average value between domestic leaks and irrigation return flow, f) returns to the aquifer (93 × 106 m3⋅yr−1, about 80% comes from irrigation and 20% from domestic water leaks). Recharge is approximately 15 × 106 m3⋅yr−1, average seawater intrusion 22 × 106 m3⋅yr−1, and the flux out of cell 21 is about 40 × 106 m3⋅yr−1 (temporal average values of QM and QS using (11)). The net annual average water withdrawal from cell 13 is therefore 97 × 106 m3⋅yr−1 which leads to a net volume extracted from the phreatic aquifer over the 52 years of simulation of 5.0 km3 representing a groundwater storage variation of about 13%. This is consistent with the 20% uncertainty considered for V in the calculation of seawater intrusion flux. In this study, we considered only principal flow directions, i.e., east to west in Tunisia and south to north in Libya, which makes it possible to solve the discrete linear system of mass balance equations. This clear simplification is however relatively well supported by piezometric data [e.g. OSS 2006; Sadeg and Karahanoglu 2001; Trabelsi et al. 2012]. Although adapted to the overall objective of fluxes assessment using parsimonious modeling approaches and to the resolution of the rainfall data, the mesh may appear coarse. However, noting that the nine pumping zones are mostly aligned along the 450 km of the shoreline, the average spacing of hydraulic divides associated with pumping is about 50 km which corresponds to the grid resolution. This resolution enables to compensate for the fact that the pumping wells are actually located around the centroids which were conveniently used here for downscaling and mass balance calculations. Even though small portions of the Djeffara plain in the south of the domain covering no more than half a grid cell were excluded, we believe that the spatial resolution does not significantly affect the results. As mentioned in Section 3.1, additional downscaling and thus grid refinement would have been especially beneficial for the area of Gabès (Figure 1). However, Chulli et al. [2007] estimated the SGD in the gulf of Gabès at 0.2 m3⋅s−1 (0.1 m3⋅s−1 for half of the coast length) using Darcy’s calculations for the Upper aquifer. This relatively low value also obtained in a recent modeling study by Vernoux et al. [2020] justifies maintaining the grid resolution as adopted here.
Global groundwater budget for the Djeffara plain (2002–2016) obtained using GRACE-derived 𝛥GWS downscaled over a 0.5° × 0.5° grid
| Input (×106 m3⋅yr−1) | Output (×106 m3⋅yr−1) | ||
|---|---|---|---|
| Natural Recharge | 236.3 ± 154.7 | Pumping | 933.5 |
| Irrigation return flow | 252.5 ± 38 | Coastal Groundwater discharge | 339.6 ± 56.7 |
| Domestic water leaks | 62.8 ± 5.8 | ||
| Seawater intrusion | 193.0 ± 32.3 | ||
| Trias discharge | 82.0 | ||
| CI discharge | 18.9 | ||
| Total | 845.5 ± 162.6 | Total | 1273.1 ± 56.7 |
Uncertainty propagation using the error on 𝛥GWSA, 𝛼 and fR.
Regionalized groundwater mass balance proposed here and based on GRACE and ground data provides valuable estimates for recharge and coastal fluxes. Our approach leads to a natural recharge representing 2.2 ± 1.4% of the rainfall which corresponds to a mean value of 4.3 ± 2.7 mm⋅yr−1 considering the average rainfall in the Djeffara plain at 196 mm⋅yr−1. This value is relatively consistent with the estimates from hydrogeological modeling at 6.8 mm⋅yr−1 [OSS 2006]. In the context of circum-Saharan arid domains, this rate of 2.2 ± 1.4% is also in good agreement with some estimates for the NWSAS [2.2 ± 1.4%, Gonçalvès et al. 2013], and the Nubian Sandstones Aquifers System [1.4 ± 1.7%, Mohamed et al. 2017] using global groundwater mass balance based on GRACE data. The fluxes obtained here enable to propose a global groundwater budget for the Djeffara plain as shown in Table 3. This groundwater budget is characterized by an outflow exceeding the inflow in accordance with the overall groundwater storage depletion shown by GRACE data. In addition to the Tripoli area, seawater intrusion also occurs in the Zarzis–Djerba area (see Figure 1) which is consistent with geochemical evidences from Trabelsi et al. [2012]. In Libyan Djeffara, a lower seawater intrusion is calculated for cell 13 in comparison to cell 12 due to the domestic water leaks considered only for the most populated area (cell 13 Tripoli; see (13) and Table 2) while the remaining terms of the groundwater budget (including pumping) are rather similar. The overall seawater intrusion amounts to 193 × 106 m3⋅yr−1 which is larger than the 34.7 × 10⁶ m3⋅yr−1 estimated from the OSS model (2006). Total submarine groundwater discharge (SGD) is 339.6 × 10⁶ m3⋅yr−1 which is also higher than the value at 186 × 106 m3⋅yr−1 found with the OSS model (2006). These discrepancies can be explained by a more important recharge deduced here (10.2 mm⋅yr−1 including an artificial recharge) compared to the model by OSS] (2006]; 6.8 mm⋅yr−1 only comprising the natural contribution). This higher recharge, if taken into account in the hydrogeological model, would lead to larger lateral drainage (SGD) and impact the model calibration probably affecting the calculated seawater intrusion fluxes.
Distributed along the 450 km long coastline, this corresponds to a shore-length-normalized SGD flux 7.5 × 10⁵ m3⋅km−1⋅yr−1. This is one of the first semi-experimentally derived SGD estimates for the north African coastline, a region that presents a notorious data gap in coastal hydrological data [e.g., El-Gamal et al. 2012; see Figure 1 in Rodellas et al. 2015]. This value compares well with model-derived estimates for freshwater SGD on the scale of the entire Mediterranean basin of 8.1 × 10⁵ m3⋅km−1⋅yr−1 [Zektser and Everett 2004] and 1.1 × 10⁶ m3⋅km−1⋅yr−1 [Zektser et al. 2007], perhaps indicating that the aquifer system under investigation may be representative for the semi-arid Mediterranean basin. Indeed, the few studies carried out in the southern/eastern Mediterranean regions with similar semi-arid conditions also yield comparable results, e.g., 1.8 × 10⁶ m3⋅km−1⋅yr−1 [Weinstein et al. 2007]. This estimate obtained for Israel’s Carmel Coast using a combination of radon and salinity as tracers is a factor 2 of the flux estimates obtained here for the Djeffara. Larger scale estimates obtained from radium isotope mass balances such as those reported by Rodellas et al. [2015] ranging from 4.0 × 10⁵ m3⋅km−1⋅yr−1 to 3.7 × 10⁸ m3⋅km−1⋅yr−1 (average 3.7 × 10⁸ m3⋅km−1⋅yr−1) cannot be compared in a meaningful way to the above freshwater SGD fluxes because radium-derived estimates include both freshwater SGD and (saline) seawater recirculation flux, and are correspondingly significantly larger. Although a direct comparison between our results and the radium-derived estimates is difficult, several objective reasons can however support the hypothesis of lower SGD in the southern Mediterranean domain: more extensive groundwater exploitation, lower recharge rate (recharge to AAR ratio), and lower annual precipitation. All these factors contribute to a relatively modest lateral drainage in the aquifers and therefore to lower SGD values. The groundwater exploitation results in water being removed from the lateral natural groundwater flow to the coast. For the Djeffara plain, the net water withdrawn corresponds to the pumping minus the irrigation return flow, i.e., about 70% of the exploited volumes or about 0.7 km3⋅yr−1. This represents 1.56 × 10⁶ m3⋅yr−1⋅km−1 suggesting a still low “natural” SGD value. A recharge ratio of between 23 and 52% (average 35%) for karstified carbonates [Allocca et al. 2014; Arfib and Charlier 2016; Baudement et al. 2017; Martos-Rosillo et al. 2015; Polemio 2016; Zagana et al. 2007], and between 10 and 21% (average 16%) for detritic aquifer formations [Séraphin et al. 2016; Yagbasan 2016; Zagana et al. 2007] were reported in the north Mediterranean area (Spain to Turkey). Given that karstic aquifers represent almost 20% of the coastal areas in Mediterranean Europe [Goldscheider et al. 2020], an average value of about 20% for the recharge ratio, therefore tenfold higher than in the southern part of the Mediterranean domain (2 to 3%), can be considered. In addition, the average annual rainfall is generally two to three times higher on average in the coastal areas of north Mediterranean Sea. Together with the recharge ratio, this could readily explain lateral groundwater drainage toward the coasts and thus SGD values one order of magnitude higher in the north Mediterranean domain in comparison to southern parts. To date, SGD studies are primary carried out on a local scale (beach/embayment). There is an increasing interest in upscaling these coastal fluxes to, e.g., basin scale [e.g. Rodellas et al. 2015]. These large-scale estimates have their own limitations, e.g., the choice of approach which in the case of Rodellas et al. [2015] does not allow a determination of the freshwater fraction of SGD which is of interest to hydrological studies. Based on the results of this study, we propose that the correct unit to report SGD fluxes may be the catchment/aquifer scale as investigated here. It is important to note that in our GRACE-derived estimate, no SGD flux occurs from 3 out of 7 coastal cells of the Djeffara aquifer investigated in this study (Table 2). This spatial variability has to be considered when upscaling, and we suggest that GRACE data could be used in combination with local “point measurements” with other approaches to provide more accurate upscaling estimates in future studies elsewhere.
6. Conclusions
In this study, we proposed a downscaling approach for the GRACE-derived groundwater mass storage variations based on the pumping wells spatial distribution and rates of exploitation. In arid zones, where groundwater is the main or the only water resource, pumping is often the dominant term of the hydrological budget. This approach leads to a realistic spatial distribution of the groundwater storage variations averaged over the period 2002–2016 with lower values in the areas where large drawdown of the piezometric levels are reported, such as the Tripoli area. Downscaled groundwater storage variations were then introduced in a set of 21 discrete groundwater balance equations over the finer 0.5° × 0.5° (2580 km2) grid to obtain new estimates of the recharge and coastal fluxes (outflowing or incoming) independently from any hydrogeological model. Due to indetermination issues, the saline intrusion rate in the Tripoli region was identified separately using a local salt mass balance calculation. According to our calculations, the Tripoli and Djerba–Zarzis areas are subjected to a strong seawater intrusion. The remaining coastal zones produce a cumulated groundwater outflow (SGD) of 339.6 × 10⁶ m3⋅yr−1 for the 2002–2016 period. This geophysically based value fills an important gap in SGD estimations for the southern Mediterranean coastal area which remains unquantified to date, including by radiochemical tracers widely used elsewhere. The average recharge over the Djeffara plain was estimated at 4.3 ± 2.7 mm⋅yr−1 or 2.2 ± 1.4% which is consistent with the recharge to average annual rainfall ratio found for other Saharan aquifers. The GRACE-derived domain-averaged water budget which is obtained here, i.e., overall groundwater depletion at − 8.0 ± 0.2 mm⋅yr−1, not surprisingly confirms the unsustainable mining of groundwater in the Djeffara plain. Available options to stop this unsustainable mining include pumping limitations to prevent additional salinization effects, use of underexploited resources such as the Jurassic aquifer at the border of the Djeffara, exploitation of remote but unsustainable resources (GMMR), irrigation efficiency increase, and seawater desalinization. These are all ongoing (or future) options under consideration to improve water uses and access to water. Here, we have taken advantage of the alignment of the main groundwater flow directions (toward the coast) with the GRACE grids. This favorable situation can be found for other Mediterranean coastal aquifers enabling a similar approach of distributed mass balance using satellite gravity.
Acknowledgments
GRACE land data are available at http://grace.jpl.nasa.gov, supported by the NASA MEaSUREs Program. This study has been supported by the Labex OT-Med project of the French program “Investissement d’Avenir.” The two anonymous reviewers and the Editors are acknowledged for their relevant comments which largely improved the manuscript.
Vous devez vous connecter pour continuer.
S'authentifier