

1 Introduction
The Argentinean short-finned squid, Illex argentinus (Castellanos, 1960) is a neritic-oceanic species distributed along the continental shelf and slope of the western South Atlantic Ocean from 22°S to 54°S [1–3]. It is an important part of the diet of demersal fishes and marine mammals, plays an important role in the ecosystem [4,5], and supports an important commercial fishery. Catches of I. argentinus started in Argentinean waters around 1946 (5000 tons per year) as bycatch of Merluccius hubbsi, but it was in 1978 that the development of a directed trawler fishery produced an increase in the catches (200,000 tons per year), which continues to rise since 1993 when jigger fleet started to operate in Argentinean and international waters [2]. I. argentinus has been considered the world's most important cephalopod fishery in volume of landings of the last decade, with maximums of nearly 1,100,000 tons landed in 1999, of which two thirds of these captures were made by Argentine and the rest mainly by Asian and European countries [6]. Nowadays it is captured by jiggers and trawlers and it is exploited in the continental shelf off southern Brazil, Uruguay, and Argentine, as well as in international waters beyond 200 miles [4,7].
Since the 1980s, a large amount of studies have been conducted on I. argentinus to understand its population structure [7]. As a consequence, five reproductive stocks were described along its wide geographical distribution [7 and cites therein]. Each one of these stocks is characterized by distinct spawning seasons and areas, length at the first maturity and size structure [1–3]. Both Summer Spawning Stock (SSS) and South Patagonic Stock (SPS) are the most abundant and heavily fished stocks [2], but the degree of genetic isolation between them is unknown. The SSS is constituted by 15 to 25 cm mantle length squids, which spawn on the mid and outer shelf between 42°S to 46°S from December to February [1–3,8,9]. The SPS is characterized by squids of 18 to 37 cm mantle length that concentrate on the outer shelf of 44°S and spawn from June to November [1–3,8,9].
Genetic analyses have a lot to offer to fishery management, by helping to identify genetic stocks, to know population limits, and to define management units [10,11]. Also, genetic analyses can inform about the ability of the species to adapt to man-made pressure and environmental changes [12]. Therefore, genetic information is essential for the conservation and sustainable management of marine resources [11,13]. Previously published genetic data on I. argentinus applied to population's differentiation are scarce and limited to the analysis of samples from Malvinas/Falkland Islands Interim Conservation and Management Zone. Overall geographic genetic homogeneity was reported by analysing locations from commercial vessels using allozymes [14] and microsatellites [15] as molecular markers.
In this work, the two more abundant and exploited spawning stocks, SSS and SPS, have been genetically analysed using 40 protein-coding loci and two mitochondrial regions, cytochrome c oxidase subunit I (COI) and 16S rDNA. We examine the genetic diversity of SSS and SPS for the first time. We then address the question of whether SSS and SPS are genetic stocks. The results obtained are discussed in a context of available species’ biological and fisheries information.
2 Materials and methods
2.1 Sampling and tissue extraction
I. argentinus specimens (n = 202) corresponding to SSS (45°18'S 60°47’W; haul #73) and SPS (47°33'S; 64°03’W; haul #47) were taken during the survey “OB 02/94” by the R/V “Capitán Oca Balda” (INIDEP, Argentina) (Fig. 1). Individual assignment to stocks was done by size and maturity stage following Brunetti [1]. The skeletal muscle tissue was extracted from the mantle of each specimen and frozen at –20 °C until its arrival at the laboratory, where samples were kept at–80 °C until later analyses.
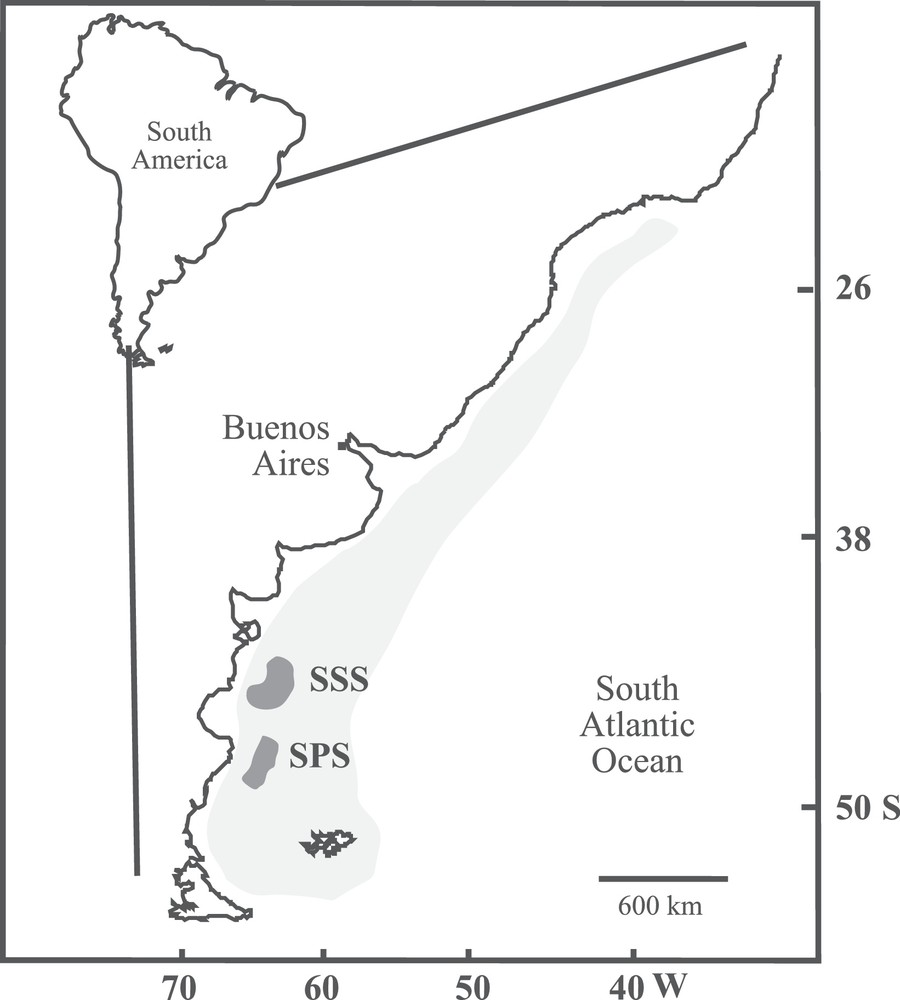
Geographical distribution of Illex argentinus (light grey) and sampling sites (dark grey): Summer Spawning Stock (SSS) and South Patagonic Stock (SPS).
2.2 Allozyme electrophoresis and data analysis
Electrophoresis conditions and allele scoring were carried out as detailed in Jerez et al. [16]. Genotype distributions of all loci were tested for conformance to the Hardy–Weinberg expectations using the exact probability test. Gametic associations for all possible pairs of alleles at distinct loci in each population were tested by computing the unbiased composite-linkage disequilibrium (D). Polymorphism was examined using the 95% criterion (P0.05). Within-sample variation was assessed by mean unbiased expected heterozygosity per locus (He) [17]. Differences in allele frequencies among samples were tested by the exact probability test, where the unbiased estimate of the P-value for each locus was obtained using a Markov chain method. All the above calculations were carried out using the population genetic software package GENEPOP [18 and references therein]. The sequential Bonferroni technique [19] was used to adjust significance levels for multiple simultaneous comparisons. Genetic differentiation of stocks was assessed by F-statistics [20]. Pairwise multi-locus comparisons between samples were calculated by Nei's genetic distance [21]. A Bayesian approach on polymorphic loci, as implemented in BAPS v5.1 [22], was used to detect hidden population substructuring by clustering genetically similar individuals into panmictic k groups.
2.3 DNA extraction, amplification, sequencing and data analysis
DNA isolation and polymerase chain reaction (PCR) methods for amplification of the mitochondrial COI and 16S rDNA regions followed the procedures outlined in Roldán et al. [23] and Fernández et al. [24]. A partial region of the mitochondrial COI gene (556 bp) was amplified using primers LCO1490 and HCO2198 [25]. A partial region of 16S rDNA (439 bp) was amplified using 16SF-Illex470 (5′-AAATAAAGAGTTGGGCCTGCT-3′) and 16SR-Illex470 (5′-CCTTACTAAAGCTTCTGCACCT-3′), primers designed by us. The 50-μL PCR reaction mixture for each of the two genes included 5 μL of 10 × PCR buffer, 3 μL (COI) or 4 μL (16S rDNA) of MgCl2 (50 mM), 4 μL of dNTP (10 mM), 2 μL of forward and reverse primers, 0.25 μL of 1.25 U EcoTaq DNA Polymerase (Ecogen) and 1 μL of template DNA (∼ 25 ng). PCR amplifications for each molecular marker were performed following similar conditions: initial denaturation for 4′ (COI) or 2′ (16S rDNA) at 94 °C, followed by 35 cycles of 45′′ (COI) or 1′ (16S rDNA) at 94 °C, 1′ at 51 °C (COI) or 50 °C (16S rDNA), and 1′ at 72 °C, with a final extension of 7′ (COI) or 5′ (16S rDNA) at 72 °C. PCR amplifications were confirmed by visualization on 1% agarose gel stained with ethidium bromide (0.5 mg/mL). Amplified DNAs were purified for sequencing using exonuclease I and thermosensitive alkaline phosphatase. DNA sequencing reactions were prepared with BigDye Terminator v3.1 Cycle Sequencing Kit (Applied Biosystems) according to the manufacturer's instructions. The labelled fragments were loaded onto an ABI PRISM 3130 Genetic Analyzer (Applied Biosystems) for sequencing at the Laboratori d’Ictiologia Genètica, Universitat de Girona, Spain.
Nucleotide sequences were edited using SeqScape v2.5 (Applied Biosystems) and aligned using BioEdit v7.1.3.0 [26], employing as a reference the COI and 16S rDNA sequences (GeneBank accession number HQ846077 for COI and HQ845988 for 16S rDNA) of I. argentinus. Each new haplotype was deposited in GenBank (accession numbers KC594174 to KC594180 for COI haplotypes and KC594167 to KC594173 for 16S rDNA haplotypes; Supplementary Material Table S1, S2).
The partition homogeneity test implemented in PAUP* v4.0b10 [27] showed no incongruence between COI and 16S rDNA fragments (P = 1); hence all analyses were ran on concatenated data (995 bp). The Bayesian Information Criterion (BIC) implemented in jMODELTEST 0.1.1 [28] was used to determine the optimal model of nucleotide substitution. The results showed that the most appropriate evolutionary model of nucleotide substitution was the F81 [29] for 16S rDNA data set and the HKY [30] for COI and concatenated data set.
Haplotype diversity (h), nucleotide diversity (π) and the distribution of molecular variance (AMOVA; [31]) within and among stocks was performed with Arlequin v3.5 [32]. The significance of ФST was assessed by a permutation test with 10,000 replicates. A median-joining network of haplotypes was constructed using NETWORK v4.5.1.6 [33]. A Bayesian approach, as implemented in BAPS v5.1 [22], was used to detect hidden population substructuring by clustering genetically similar individuals into panmictic k groups, hereafter called haplogroups (HGs), using the module Genetic mixture analysis with linked loci [34].
Demographic history was inferred by analysing the distribution of the number of site differences between pairs of sequences (mismatch distribution, MMD), which was carried out according to the procedure outlined in Rogers & Harpending [35], as implemented in Arlequin v3.5 [32]. The validity of the expansion model was evaluated using the parametric bootstrap approach of Schenider & Excoffier [36], using as test statistics the sum of square deviations (SSD) between the observed and the expected mismatch and the raggedness index (r) as proposed by Harpending [37]. Fu's [38] Fs and Tajima's [39] D statistics were also computed to assess population expansion and tested with coalescent simulations (10,000 replicates), as implemented in Arlequin v3.5.
3 Results
3.1 Allozyme analysis
Apparent Mendelian variation was detected at 20 (Table 1) out of 40 protein-coding loci. Five loci (ADA*, DIA-2*, IDHP-1*, MEP* and MPI-2*) were polymorphic according to the 95% criterion. In both stocks, the average proportion of polymorphic loci was 12.8% and presented a mean number of 1.5 alleles per locus. Overall average expected heterozygosity for all 40 loci was 0.038 ± 0.012 (SSS) and 0.034 ± 0.012 (SPS). For both stocks, tests for Hardy–Weinberg proportions with all polymorphic loci, and for gametic disequilibrium among the five most highly polymorphic loci, did not show significant departures from expected values (P > 0.05). Overall genetic differentiation was low as evidenced by FST (0.007), contingency test (χ2: 34.366, d.f.: 24, P = 0.063) and Nei's genetic distance (0.001). The Bayesian assignment of individuals to groups based on 5 polymorphic loci, detected six clusters (P = 1) and all clusters were present in both stocks (data not shown).
Allele frequencies and FST analysis of 20 polymorphic loci for Illex argentinus.
| Locus | n SSS | n SPS | Allele | SSS | SPS | F ST |
| ACP* | 103 | 99 | *100 | 0.995 | 0.995 | 0.000 |
| *225 | 0.005 | 0.005 | ||||
| ADA* | 103 | 99 | *100 | 0.898 | 0.889 | 0.000 |
| *69 | 0.102 | 0.111 | ||||
| CK-3* | 103 | 99 | *100 | 0.995 | 0.99 | 0.001 |
| *95 | 0.005 | 0.01 | ||||
| DIA-2* | 101 | 92 | *100 | 0.881 | 0.913 | 0.002 |
| *95 | 0.109 | 0.087 | ||||
| *103 | 0.01 | |||||
| G6PDH* | 103 | 99 | *100 | 1 | 0.99 | 0.005 |
| *107 | 0.01 | |||||
| GPI* | 103 | 99 | *100 | 1 | 0.995 | 0.003 |
| *111 | 0.005 | |||||
| IDDH* | 102 | 99 | *100 | 0.985 | 1 | 0.007 |
| *113 | 0.015 | |||||
| IDHP-1* | 101 | 96 | *100 | 0.856 | 0.911 | 0.007 |
| *68 | 0.144 | 0.089 | ||||
| IDHP-2* | 103 | 97 | *100 | 0.976 | 0.964 | 0.001 |
| *94 | 0.024 | 0.036 | ||||
| MDH-3* | 103 | 99 | *100 | 1 | 0.995 | 0.003 |
| *160 | 0.005 | |||||
| MEP* | 103 | 99 | *100 | 0.859 | 0.924 | 0.011 |
| *95 | 0.141 | 0.075 | ||||
| MPI-2* | 103 | 99 | *100 | 0.83 | 0.732 | 0.014 |
| *85 | 0.17 | 0.268 | ||||
| PEP-A* | 103 | 99 | *100 | 0.971 | 0.995 | 0.007 |
| *95 | 0.024 | 0.005 | ||||
| *105 | 0.005 | |||||
| PEP-D* | 103 | 99 | *100 | 0.99 | 0.99 | 0.000 |
| *90 | 0.005 | 0.005 | ||||
| *80 | 0.005 | 0.005 | ||||
| PEP-S-1* | 103 | 98 | *100 | 0.995 | 0.99 | 0.001 |
| *114 | 0.005 | 0.01 | ||||
| PEP-S-2* | 103 | 99 | *100 | 0.99 | 1 | 0.005 |
| *92 | 0.01 | |||||
| PEP-S-3* | 103 | 99 | *100 | 0.985 | 0.995 | 0.002 |
| *90 | 0.015 | 0.005 | ||||
| PGDH* | 103 | 99 | *100 | 1 | 0.995 | 0.003 |
| *105 | 0.005 | |||||
| PGM* | 103 | 99 | *100 | 0.985 | 0.995 | 0.004 |
| *114 | 0.015 | |||||
| *64 | 0.005 | |||||
| TAT-2* | 94 | 75 | *100 | 0.957 | 0.967 | 0.001 |
| *89 | 0.043 | 0.033 | ||||
| Total | 0.007 |
3.2 Mitochondrial DNA analysis
The analysis of COI (556 bp) and 16S rDNA (439 bp) mitochondrial markers revealed the existence of seven different haplotypes for each molecular marker (Supplementary material, Table S1; S2); three of these seven haplotypes were shared by individuals from both stocks, for both COI and 16S rDNA. Only 16S rDNA region presented indel positions (7), which were included in all analyses. The analysis of the concatenated data set (995 bp) detected 15 different haplotypes due to 15 polymorphic sites: nine singletons and six parsimony informative sites (Table 2). SSS stock presented higher values of haplotype and nucleotide diversity than SPS stock for all sets of data (Table 3). The AMOVA analyses indicated an absence of genetic divergence between the two stocks (Table 4) where more than 99% of the observed genetic variance is explained by differences within each stock. The median-joining network of concatenated sequences (networks of single genes are included in Supplementary material, Fig. S1; S2) showed a star-like phylogeny where six haplotypes, including the three most frequent (Iah1, Iah2, Iah3) were shared by individuals from both stocks (Fig. 2A). SSS shows 8 private haplotypes (Iah7-Iah14) and SPS only one (Iah15).
Variable nucleotide positions defining 15 haplotypes for the concatenated COI and 16S rDNA sequences (995 bp) for Illex argentinus. Identical nucleotide is indicated with a dot (·) and absence of nucleotide is indicated with a dash (−).
| Variable nucleotide position | |||||||||||||||
| Haplotype Code | 136 | 195 | 225 | 330 | 348 | 402 | 563 | 624 | 662 | 756 | 757 | 758 | 819 | 854 | 855 |
| Iah1 | C | A | T | A | C | G | − | − | C | − | − | − | T | − | − |
| Iah2 | · | · | · | · | · | · | T | − | · | − | − | − | · | − | − |
| Iah3 | · | · | · | G | · | · | − | − | · | − | − | − | · | − | − |
| Iah4 | · | · | · | · | · | · | − | − | · | − | − | − | · | T | A |
| Iah5 | · | · | C | · | · | A | − | − | · | − | − | − | · | − | − |
| Iah6 | · | · | · | G | T | · | − | − | · | − | − | − | · | − | − |
| Iah7 | T | · | · | · | · | · | − | − | · | − | − | − | · | − | − |
| Iah8 | · | · | · | G | · | · | − | − | · | − | − | − | · | T | A |
| Iah9 | · | · | · | · | · | · | T | G | · | − | − | − | · | − | − |
| Iah10 | · | · | · | · | · | A | − | − | · | − | − | − | · | − | − |
| Iah11 | · | · | · | G | · | · | − | − | T | − | − | − | · | − | − |
| Iah12 | · | · | · | G | T | · | − | − | · | − | − | − | · | T | A |
| Iah13 | · | · | · | · | · | · | − | − | · | T | T | A | · | − | − |
| Iah14 | · | G | · | · | · | · | − | − | · | − | − | − | · | − | − |
| Iah15 | · | · | · | · | · | · | − | − | · | − | − | − | C | − | − |
Estimates of genetic diversity of Illex argentinus for COI (556 bp), 16S rDNA (439 bp) and concatenated COI-16S rDNA (995 bp) sequences with indel mutations.
| Gene | |||||||||||||
| COI | 16S rDNA | COI-16S rDNA | |||||||||||
| Stock | n | n h | n p | h ± SD | π ± SD | n h | n p | h ± SD | π ± SD | n h | n p | h ± SD | π ± SD |
| SSS | 85 | 7 | 6 | 0.405 ± 0.065 | 0.0011 ± 0.0010 | 6 | 8 | 0.366 ± 0.063 | 0.0014 ± 0.0012 | 14 | 14 | 0.637 ± 0.057 | 0.0012 ± 0.0009 |
| SPS | 81 | 3 | 3 | 0.204 ± 0.057 | 0.0005 ± 0.0006 | 4 | 4 | 0.320 ± 0.061 | 0.0009 ± 0.0010 | 7 | 6 | 0.483 ± 0.062 | 0.0007 ± 0.0006 |
| Total | 166 | 7 | 6 | 0.310 ± 0.045 | 0.0008 ± 0.0008 | 7 | 9 | 0.342 ± 0.044 | 0.0011 ± 0.0011 | 15 | 15 | 0.563 ± 0.043 | 0.0010 ± 0.0007 |
Analysis of molecular variance (AMOVA) for COI (556 bp), 16S rDNA (439 bp) and concatenated COI-16S rDNA (995 bp) sequences of Illex argentinus.
| Gene | Source of variation | df | Components of variance | % of variance | Φ-statistics | P |
| COI | Among stocks | 1 | 0.00223 | 0.99 | ΦST = 0.00992 | 0.136 |
| Within stocks | 164 | 0.22261 | 99.01 | |||
| 16S rDNA | Among stocks | 1 | –0.00131 | –0.53 | ΦST = –0.00526 | 0.642 |
| Within stocks | 164 | 0.25115 | 100.53 | |||
| COI–16S rDNA | Among stocks | 1 | 0.00092 | 0.19 | ΦST = 0.00193 | 0.312 |
| Within stocks | 164 | 0.47376 | 99.81 |
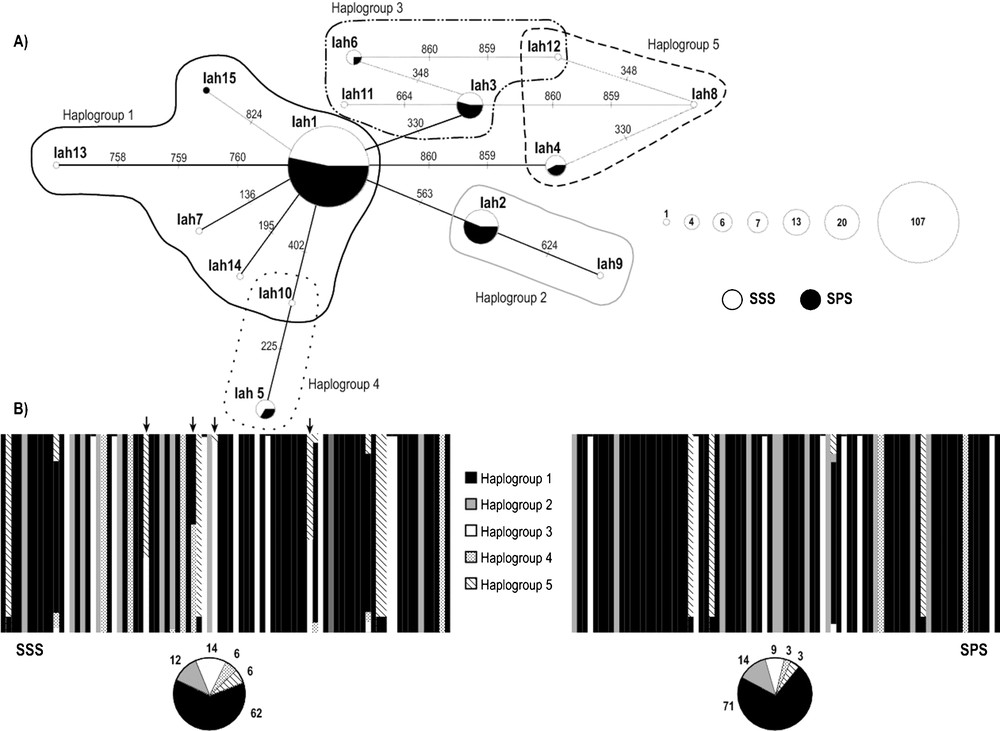
(A) Median-joining network of 15 haplotypes detected for the concatenated COI and 16S rDNA sequences (995 bp) of Illex argentinus. The area of each circle is proportional to the number of individuals exhibiting that haplotype. Each line segment represents one mutational step. Summer Spawning Stock (SSS), South Patagonic Stock (SPS). (B) Bayesian assignment analysis for concatenated COI and 16S rDNA sequences of the two stocks sampled. Each bar represents an individual and its associated probability of belonging to one of the five genetic clusters detected (P = 1). Black arrows indicate individuals with haplotypes Iah10 and Iah12. Pie charts indicate percentages of the haplogroups contributing to each sample. Masquer
(A) Median-joining network of 15 haplotypes detected for the concatenated COI and 16S rDNA sequences (995 bp) of Illex argentinus. The area of each circle is proportional to the number of individuals exhibiting that haplotype. Each line segment represents one ... Lire la suite
The Bayesian analysis of population structure showed evidence for five underlying haplogroups (K = 5, P = 0.99). All five haplogroups were present in both stocks and almost each individual was assigned to a particular haplogroup (P > 0.05), except for individuals with haplotypes Iah10, Iah12 (Fig. 2B). Individuals represented by the most frequent haplotype Iah1 and with haplotypes Iah7, Iah13, Iah14, Iah15 were assigned to HG1; individuals with haplotypes Iah2, Iah9 were assigned to HG2; individuals with haplotypes Iah3, Iah6, Iah11 were assigned to HG3; individuals with haplotypes Iah5 were assigned to HG4; and individuals with haplotypes Iah4, Iah8 were assigned to HG5 (Fig. 2B).
Overall, the I. argentinus dataset here studied presented signs of a recent demographic expansion, as indicated by MMD and neutrality tests (Fig. 3; Table 5). The total dataset and the SPS presented unimodal observed mismatch distributions that fitted the curve expected under the expansion model described by Rogers & Harpending [35] (Fig. 3). This was corroborated by the non-significant Sum of Squared Deviations (SSD) test and raggedness index (r). In contrast, SSS presented a significant deviation from the expected curve, as corroborated by SSD. Tajima's D and Fu's Fs presented negative values and were significant for the total data set and Tajima's D for SPS, indicative of a recent population expansion (Table 5).
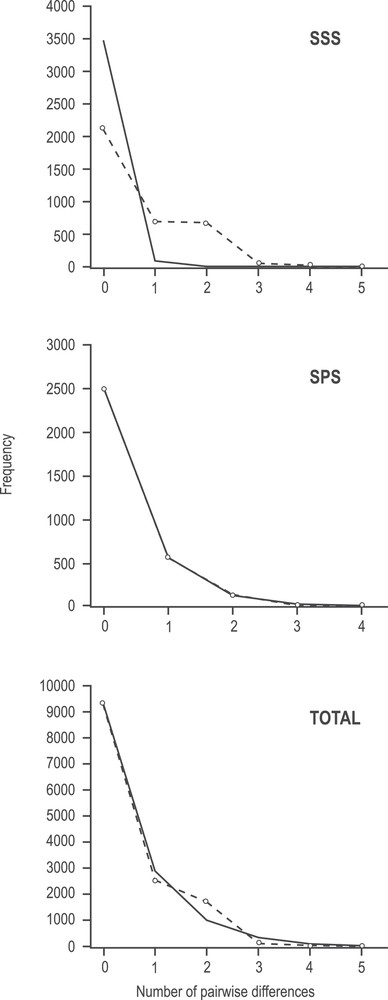
Mismatch distribution of haplotypes for the concatenated COI and 16S rDNA sequences. Observed frequency distribution (dashed line) for the number of pairwise differences among individuals of both stocks and total. Solid line shows the expected Poisson distribution under an assumption of population expansion.
Sum of squared deviations (SSD) between the observed and expected mismatch distributions of pairwise differences and raggedness index (r) of the observed mismatch distribution.
| Stocks | SSD | r | D | F S |
| SSS | 0.241* | 0.189a | –1.289a | –4.119a |
| SPS | 0.589a | 0.377a | –1.338* | –1.862a |
| Total | 0.004a | 0.261a | –1.501* | –6.189** |
a Non-significant.
* P < 0.05.
** P < 0.01.
4 Discussion
4.1 Patterns of genetic variation
This work characterizes I. argentinus as a species with low mean levels of genetic diversity which are similar to previously reported values with the same molecular markers for Argentinean short-finned squid or others closed related squids. On the one hand, analysing commercial samples of I. argentines, lower levels of allozymic variation were observed previously (He = 0.011 [14]; He = 0.020 [40]). Adcock et al. [15] found relatively high levels of gene diversity at microsatellites markers (He = 0.84) and stated that selective forces are constraining allozyme diversity in I. argentinus. On the other hand, our analysis of mitochondrial markers found high levels of haplotype diversity and low levels of nucleotide diversity for combined COI-16S rDNA and total data (Table 3). No previous mitochondrial published data on I. argentinus exists, yet a similar trend was noted for other squids as Loligo bleekeri (h = 0.670, π = 0.003) [41], and Loligo edulis (h = 0.436, π = 0.0011) [42].
Considering each stock separately, two different scenarios will be inferred according to interpretation of haplotypes and nucleotide diversity levels given in Grant & Bowen [43]. A recent demographic bottleneck followed by a rapid population growth may account for the levels of genetic diversity observed for SSS, and a recent demographic bottleneck or founder event by single or few mitochondrial lineages for SPS (Table 3). I. argentinus presents a short life cycle, where both males and females died after spawn at the age of one year. The estimated individual fecundity of the full mature female ranges between 75,000 and 1,200,000 eggs [2]. The observed low levels of diversity (Table 3) could be explained by the fact that populations are recovered every year based on high quantities of descendants from few successful spawners of the previous generation [43]. Hence our results may reflect temporal chaotic patchiness as described by Johnson & Black [44].
4.2 Complex stock structure and management implications
Critical knowledge for the long-time management and conservation of resources must include information about the genetic diversity and evolutionary history of populations [11]. The detection of different genetic stocks and its corresponding barriers to gene flow is important for the correct management of populations, as the exploitation of two different genetic stocks as a single one may result in local overexploitation diminishing the overall fishery yield [11]. Furthermore, overexploitation of undetected stocks may cause extinction of local populations with a consequent loss in genetic diversity and adaptive potential for the species [45].
I. argentinus, like other ommastrephids, presents a complex population structure based on species biology and life-history traits [2]. Since the 90s, five fishing stocks of short-finned squid have been designated based on distinct spawning seasons and areas, length of the first maturity and size structure [1–3,8,9]. A five-stock hypothesis provides a more conservative approach to harvest management since it focuses attention on the maintenance of local population levels in the short term and on the preservation of local adaptations in the long-term.
The nuclear and mitochondrial data reveal that SSS and SPS stocks are not genetic stocks as well as they are not genetically distinct. Absence of genetic differentiation seems to be common within squids, as different authors have reported similar findings in species as Loligo forbesi [46] and Loligo gahi [47]. The lack of genetically detectable stock differentiation for I. argentinus might arise from three scenarios:
- • a recent divergence of both stocks makes divergence not yet detectable or;
- • both stocks are part of the same population or;
- • genetic structure of populations follows a spatial and temporal chaotic patchiness.
The first scenario is supported by our mitochondrial results, as total data set fit to a unimodal pattern of MMD which does not rule out a recent shared ancestry (Fig. 3). We do not miss out the fact that in some studies microsatellites have revealed genetic differentiation between populations where previously allozymes or mitochondrial markers had not been detected (e.g., Sepia apama [48]). However, it does not seem to be the case of I. argentinus as microsatellites (7 microsatellites [15]) applied to the same individuals previously analysed with allozymes (12 allozyme polymorphic loci [14]) did not reveal any hidden genetic differentiation between commercial samples within or near the Malvinas/Falkland Islands Interim Conservation and Management Zone.
In support of the second scenario, Crespi-Abril & Barón [49] proposed, based on the modelling of spatio-temporal suitability for spawning and nursery, that what had been distinguished as two different stocks, SPS and BNPS, should be considered a single spawning group. Apparently, several ommastrephid squids present continuous spawning activity with seasonal peaks; therefore this condition would not be surprising for I. argentinus [49]. Given a continuous reproduction of I. argentinus, contact between squids from SSS and SPS stocks as a consequence of adult migration, larvae distribution and oceanographic conditions could not be rejected.
Our data and several aspects of the species biology, discrete generations and high variance of reproductive success, cope with the third scenario. The lack of genetic differentiation would be explained by the fact that mutations cannot accumulate as most of them are lost at each generation and as the genetic pattern of the new cohort is due to relatively few successful spawners.
Finally, the absence of genetic information from the other Argentinean BNPS, SpSS stocks and the Brazilian SBS stock restricts further hypotheses on the genetic structure of stocks and the level of gene flow among them. Hence, these fishing stocks need to be further investigated in order to know the real degree of connectivity (gene flow) before they can be elevated to the status of genetic stocks (i.e., completely isolated reproductive populations of the same species).
To conclude, SSS and SPS spawning stocks of I. argentinus could not be elevated to the level of genetic stocks. In addition, spatial and temporal sampling of the five stocks is required to more firmly resolve the questions raised by this study.
Disclosure of interest
The authors declare that they have no conflicts of interest concerning this article.
Acknowledgements
We thank N.E. Brunetti (INIDEP, Mar del Plata, Argentina) for encouraging this work and for sampling collection on board and identification of stocks. We also thank technical assistance of M. Sero in DNA extractions and B. Jerez in electrophoretic runs. The final version of this work was improved by useful comments of two anonymous reviewers.