

1 Introduction
In many organic conductors, the transfer integrals between neighbouring molecules are comparable to the on-site (U) and inter-site (V) Coulomb interaction energies; therefore, electron correlations play an important role in these materials. The inter-site Coulomb interactions in organic conductors can be responsible for changes of average electron density on molecules, i.e. charge ordering (or charge disproportionation) phenomena [1, 2]. The charge ordering states can be widely realised in two-dimensional charge transfer salts formed by the organic donor bis(ethylenedithio)tetrathiafulvalen (BEDT–TTF or ET) with various inorganic anions. In BEDT–TTF salts the inter-site Coulomb repulsion can give rise to stripe-type charge ordered states, where the sites with more and less amount of charge are arranged in rows alternately. As shown by recent theoretical calculations [3], both energies U and V together with the anisotropy of transfer integrals are necessary for the understanding of charge distribution patterns inside the conducting BEDT–TTF layers.
Infrared and Raman spectroscopies are good experimental methods for investigations of the charge ordering phenomena [4–6]. In BEDT–TTF salts, the positions of vibrational bands, especially those related to the C=C stretching vibrations of BEDT–TTF, can be used for determination of the charge density [7]. The neutral BEDT–TTF molecule has two Raman active C=C modes: ν2(ag)=1551 cm–1 and ν3(ag)=1493 cm–1 [8]. On increasing the average oxidation state of BEDT–TTF, the frequencies of these bands are shifted down, reaching the values ν2(ag)=1455 cm–1 and ν3(ag)=1431 cm–1 for BEDT–TTF+1 cation [9]. As shown recently, for estimation of charge density in the BEDT–TTF salt, the ν2(ag) Raman band is more reliable than ν3(ag), because of weaker coupling with electrons, which yields an additional frequency shift towards lower frequencies [6]. On the other hand, the charge ordering can be responsible for the formation of a new energy gap in electronic spectrum or the appearance of new charge-transfer bands, and these phenomena can be observed in infrared spectra.
The salts κ-[Et4N](BEDT–TTF)4M(CN)6·3 H2O (M = CoIII, FeIII) are isostructural and exhibit very similar semiconducting properties [10–12]. In conducting layers, the BEDT–TTF molecules are arranged in almost perpendicular dimers (so-called κ–phase structure) and alternate with insulating layers of hexacyanometalate trianions M(CN)63–. Both crystals undergo analogous phase transitions at about T = 240 K and T = 150 K. At room temperature, the organic conducting layer is built of two different kinds of BEDT–TTF molecules forming two kinds of dimers (labelled A and B). At 240 K, the unit cell is doubled and there exist four different kinds of dimers (labelled A, B, C and D). The phase transition at 150 K has no distinguishable influence on the crystal structure; however, it was evidenced by heat-capacity and paramagnetic-susceptibility measurements. The analysis of the bond lengths of BEDT–TTF donors suggested that at room temperature both A and B molecules bear a charge +0.5 (i.e. charge distribution is: ...A+0.5A+0.5...B+0.5B+0.5...); but below 240 K a charge redistribution takes place leading to the following pattern: ...A0A0...B+0.5B+0.5...C+0.5C+0.5...D+1D+1...[12].
Recently, the charge ordering phenomena in the FeIII salt were studied by IR and Raman spectroscopy. The existence of charge redistribution inside BEDT–TTF layers was confirmed by the FT–NIR Raman experiment (excitation: λ = 1064 nm) on powdered crystals dispersed in KBr matrix [13] as well as by the IR reflectance from single crystals [14]. Here, we report on IR and Raman investigations of the CoIII and FeIII single crystals. Preliminary spectroscopic data for the CoIII salt have been described in [15].
2 Experimental
Single crystals of the salts κ–[Et4N](BEDT–TTF)4M(CN)6·3 H2O (M = CoIII, FeIII) were grown on platinum electrodes by an electrocrystallisation technique, as previously described in [10]. The crystals were in the form of shiny platelets with the best-developed crystal face (001) being parallel to the conducting BEDT–TTF layers.
Raman spectra of the single CoIII and FeIII crystals were recorded in the spectral range from 1200 to 1800 cm–1 using a Renishaw Ramascope System 1000. The excitation light from a NIR diode laser (λ = 785 nm) was focused on the (001) crystal face. The scattered light was collected in a backscattering geometry. The power of the laser beam was kept below 240 μW to avoid sample overheating.
Polarised reflectance spectra of the CoIII single crystals were measured from the (001) crystal face, in the frequency region from 600 to 10 000 cm–1, using a FT–IR Nicolet Magna 760 spectrometer. The spectrometer was equipped with an IR microscope Spectratech IR Plan. The electrical vector of the polarised light was either parallel (E∥) or perpendicular (E⊥) to the direction corresponding to the maximum of reflected energy. The frequency-dependent conductivity was determined by Kramers–Kronig analysis of the reflectance data. The low-frequency data were extrapolated to zero-frequency assuming a constant value, a common procedure for semiconducting materials. The high-frequency data in the region 10 000–30 000 cm–1 were extended on the basis of room temperature data of the FeIII salt [14] and above 30 000 cm–1 a constant reflectance was assumed.
Low temperature IR and Raman measurements were performed with samples mounted with vacuum grease in helium cryostats. Previous investigations have shown that in both compounds the intensity of the phase transition at 150 K strongly depends on the cooling or warming rates and it is accompanied by a large thermal hysteresis, whereas the transition at 240 K remains unchanged [10–12]. These effects were not studied in our experiments: the sample temperature was carefully decreased with the cooling rate below 1 K min–1. We observed frequently that the crystals cracked in cryostat during evacuation at room temperature. The cracking was related to a process of loosing water molecules by sample under vacuum (there are three water molecules in the unit cell). Subsequently, we have found that this problem can be avoided when the sample temperature was reduced down to about 275 K before cryostat evacuation. Our present experiments were carried out following such a procedure.
3 Results
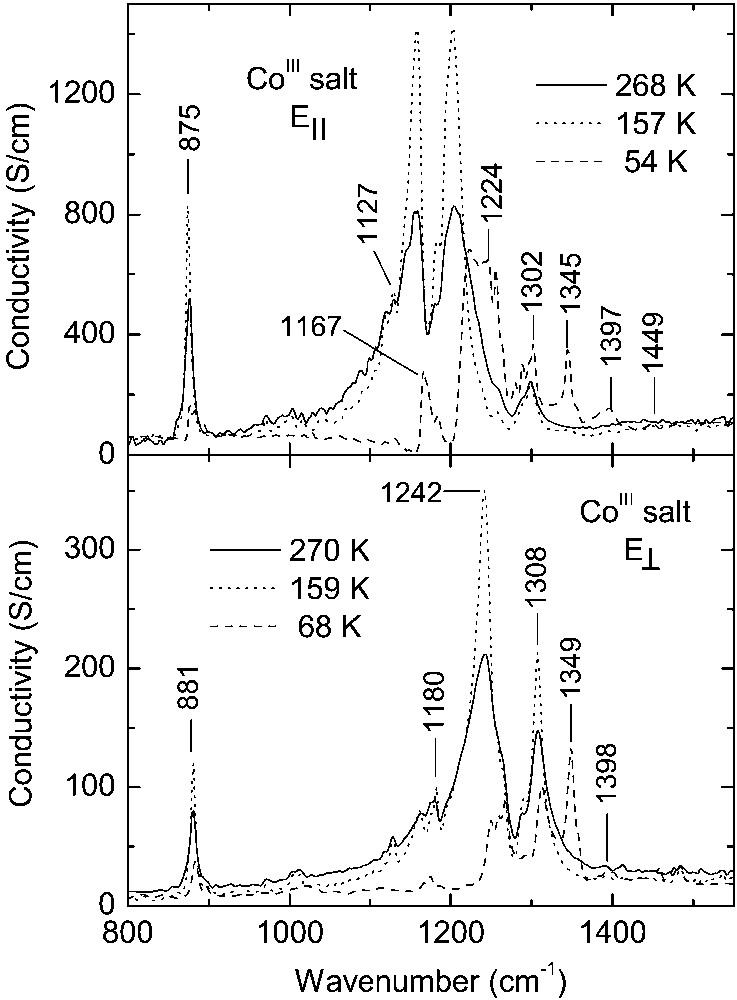
Raman spectra of the CoIII and FeIII crystals as a function of temperature are shown in Figs. 1 and 2, respectively. At room temperature, the spectra of both salts are very similar. On cooling down they undergo analogous modifications due to the charge ordering, nevertheless, they show different temperature dependence.
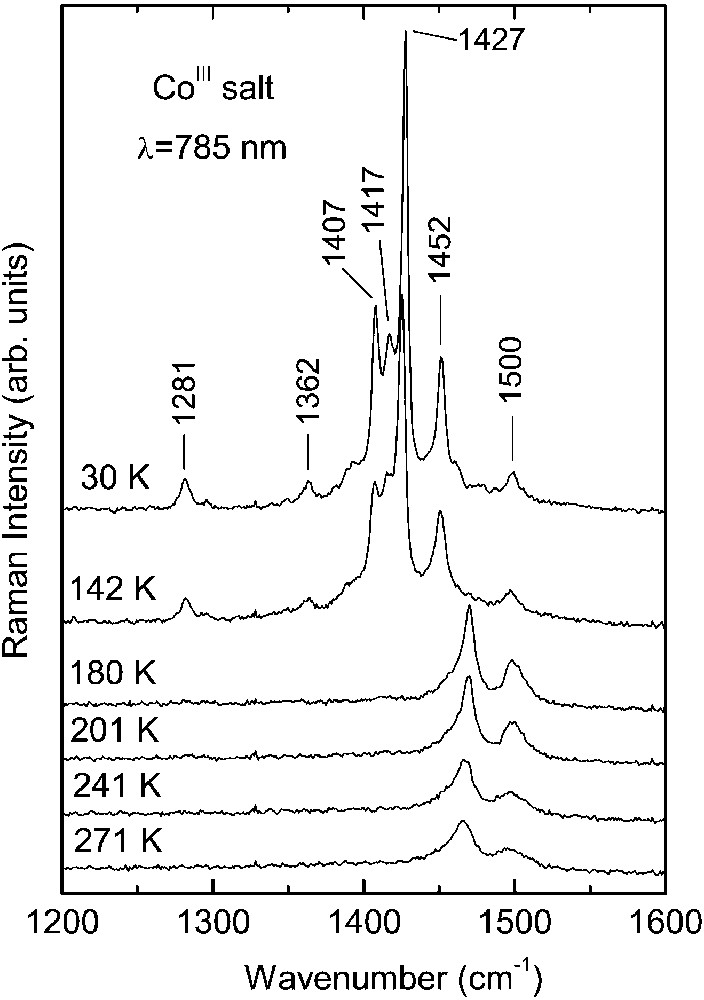
Temperature dependence of the Raman spectra of κ–[Et4N](BEDT– TTF)4Co(CN)6·3 H2O salt (NIR excitation: = 785 nm).
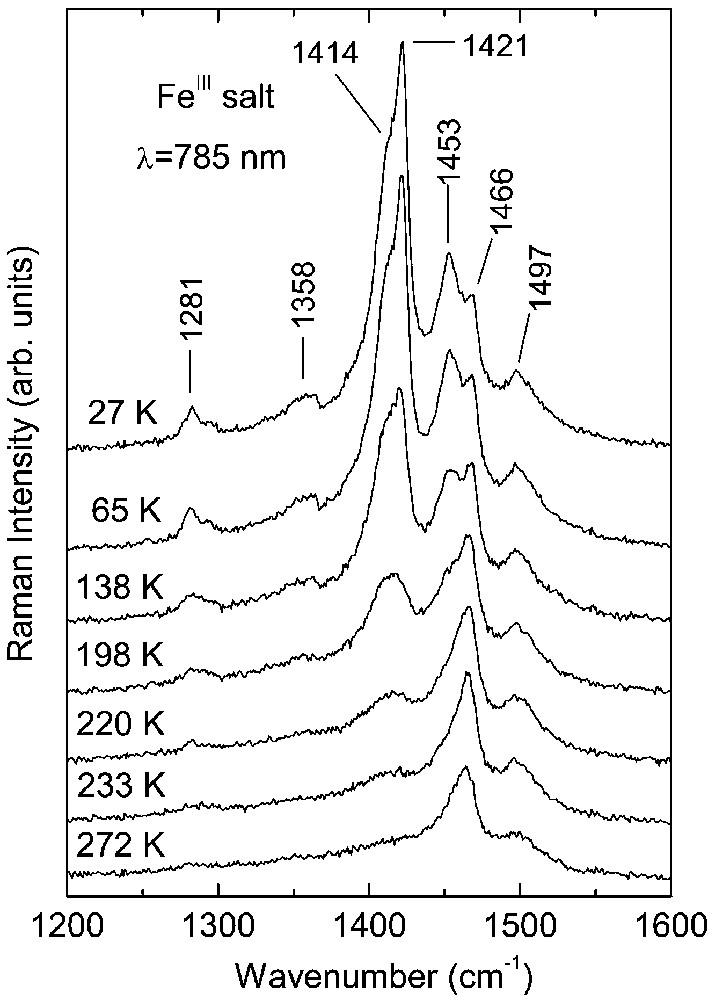
Temperature dependence of the Raman spectra of κ–[Et4N](BEDT– TTF)4Fe(CN)6·3 H2O salt (NIR excitation: λ = 785 nm).
As seen in Fig. 1, the room temperature spectrum of CoIII salt is dominated by two bands at 1495 and 1465 cm–1, corresponding to the ν2(ag) and ν3(ag) modes of BEDT–TTF molecule with charge +0.5, respectively, in agreement with the stoichiometry and the crystallographic data. In the salt κ–(BEDT–TTF)2Cu(SCN)2 containing (BEDT–TTF+0.5)2 dimers, the ν2(ag) and ν3(ag) Raman bands were observed at 1491 and 1466 cm–1 [16].
The phase transition at T = 150 K has a drastic influence on the Raman spectrum of the CoIII salt (Fig. 1): the bands related to molecules with charge +0.5 nearly disappear and simultaneously new strong lines grow, which are related to molecules with charge +1. Below 150 K, the band ν3(ag) = 1465 cm–1 is nearly not seen, i.e. the number of molecules with the charge +0.5 decreases considerably. A similar process occurs with the ν2(ag) = 1495 cm–1 band – we suggest that the spectral feature at about 1500 cm–1 should be attributed to the ν3(ag) mode of neutral molecule. Additionally, on closer analysis of the Raman spectra, we find a weak and broad band centred at about 1540 cm–1, related to the ν2(ag) mode of neutral molecule. Simultaneously, below 150 K we see the appearance of new lines at 1452, 1427, 1417, 1407 cm–1 related to molecules with charge +1. The bands 1452 and 1427 cm–1 should be assigned to the ν2(ag) and ν3(ag) modes of BEDT–TTF+1 cation, respectively. The other two lines at 1417 and 1407 cm–1 should be related to the ν3(ag) mode of BEDT–TTF+1. Our Raman data show that the charge separation is much stronger than that one suggested previously by the X–ray investigations. The nearly disappearance of bands attributed to molecules with charge +0.5 and the existence of three lines related to the ν3(ag) mode of molecules with the charge +1 proves that not only the molecules D, but also other molecules in the unit cell should bear the charge +1. The existence of three separate ν3(ag) lines can be due to the following reasons: (1) different (BEDT–TTF+1)2 dimers are not equivalent; (2) different dimers are in non-equivalent positions in the unit cell; (3) different dimers possess different charge. The ν2(ag) and ν3(ag) Raman bands were found respectively in a salt with (BEDT–TTF+0.9)2 dimers at 1455 and 1425 cm–1 [17] and in salts with (BEDT–TTF+1)2 dimers at 1460 and 1418 cm–1 [18]; or 1451 and 1408 cm–1 [19] (room-temperature data).
The Raman bands of the FeIII salt (Fig. 2) are much broader in comparison to those recorded for the CoIII salt. This difference can be related to a larger degree of disorder in the FeIII crystals; e.g. this disorder can be created by (Et4N)+ cations. As results from the crystallographic investigations, the (Et4N)+ cations show a great disorder, which was not determined even at low temperature [11, 12]. In the room temperature Raman spectrum of FeIII salt (Fig. 2), we observe also two bands at 1497 and 1466 cm–1, attributed to the ν2(ag) and ν3(ag) modes of BEDT–TTF+0.5, respectively. The spectral modifications due to charge ordering are analogous to those observed for the CoIII salt. An important difference is that the modifications in the FeIII salt are not directly related to the phase transition at 150 K, but they grow gradually on decreasing temperature below about 240 K. In the FeIII spectra, we observe also the appearance of new lines assigned to BEDT–TTF+1 cations: ν2(ag) = 1453 cm–1 as well as ν3(ag)=1421 cm–1 and 1414 cm–1. Similarly to the case of the CoIII salt, the splitting of the ν3(ag) band suggests an existence of different BEDT–TTF dimers consisting of molecules with the charge +1. Nevertheless, in the FeIII salt the line 1466 cm–1, attributed to the ν3(ag) mode of BEDT–TTF+0.5, does not disappear even at lowest temperatures, providing thus evidence that the charge separation is not complete.
Fig. 3 displays temperature dependence of the reflectance spectra of CoIII crystals over the entire spectral range for two perpendicular polarisations, corresponding to the maximum (E||) and minimum (E⊥) of reflected energy. For polarisation E|| the electrical vector was parallel to the direction [110]. Conductivity spectra obtained by Kramers–Kronig transformation of the reflectance data are shown in Fig. 4. These spectra are very similar to the reflectance spectra of other κ–phase BEDT– TTF crystals [20–22].
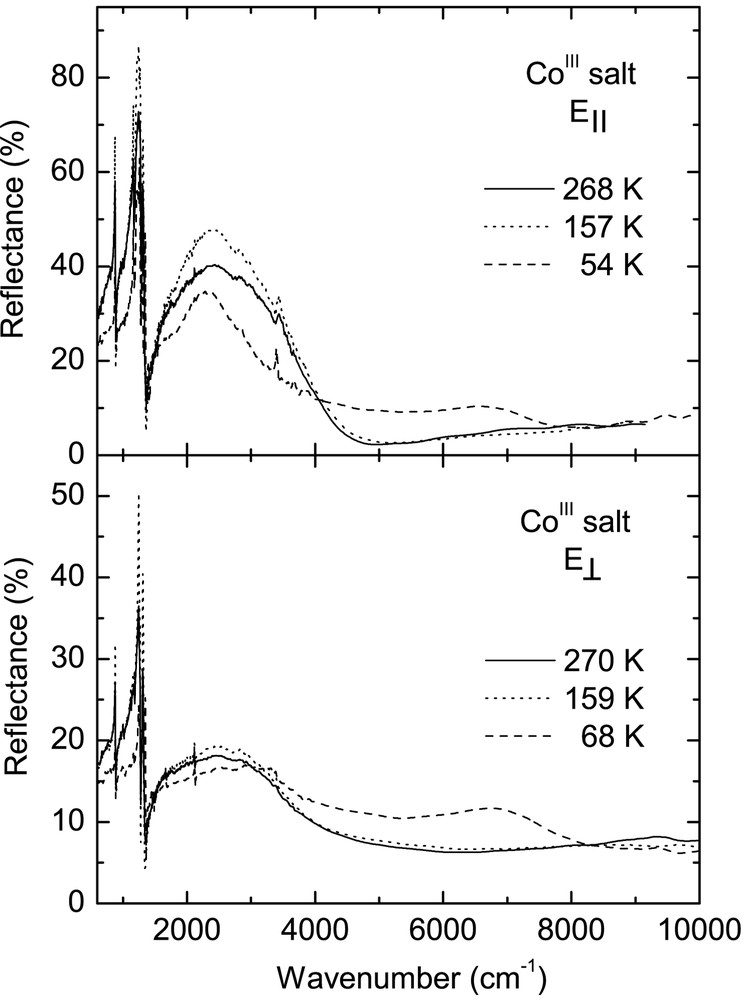
Temperature dependence of the polarised reflectance spectra of κ–[Et4N](BEDT–TTF)4Co(CN)6·3 H2O salt for two perpendicular orientations of the electrical vector of the incident IR beam.
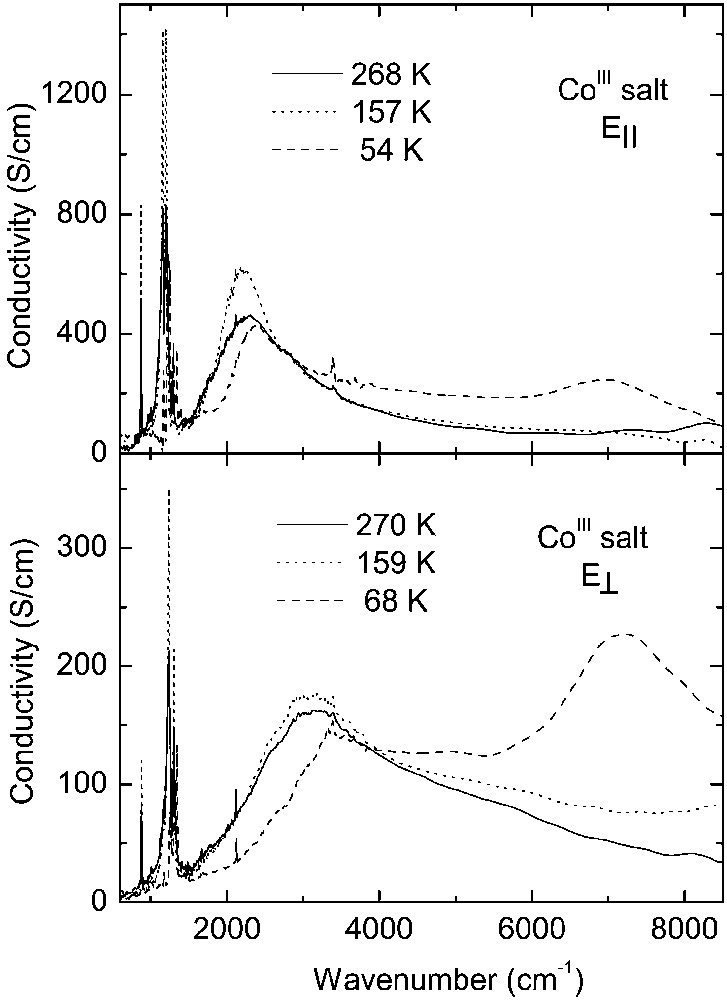
Optical conductivity spectra of κ-[Et4N](BEDT–TTF)4Co(CN)6·3 H2O derived by Kramers–Kronig analysis of the reflectance spectra.
In the room-temperature spectra of the CoIII salt, we observe a broad mid-infrared electronic band with maximum at about 2200 cm–1 for E|| and 3100 cm–1 for E⊥, corresponding to charge transfer transition between charged and neutral BEDT–TTF molecule (CT2), as well as several vibrational features below 1400 cm–1. The phase transition at 240 K causes some modifications of the CoIII spectra, similarly to those observed previously for the FeIII crystals [13]. However, the most important changes occur as a result of the phase transition at 150 K. Below 150 K, the mid-infrared electronic band decreases its intensity, changes shape and shifts towards higher frequency (Fig. 4). This is a consequence of opening of a new energy gap. By fitting the reflectance spectra with a Drude–Lorentz dielectric function (as described previously for FeIII salt [13, 14]), we estimated the energy gaps (Δ) for two perpendicular directions: at 160 K, Δ|| = 0.27 eV and Δ⊥ = 0.40 eV, whereas at 120 K Δ|| = 0.30 eV and Δ⊥ = 0.48 eV. However, the most striking spectral change is the appearance of a new near-infrared electronic band with maximum at about 7000 cm–1 for E|| and 7200 cm–1 for E⊥, related to charge transfer between BEDT–TTF+1 cations (CT1), providing thus a proof of existence of (BEDT–TTF+1)2 dimers below 150 K.
Above 150 K, for both polarisations, the IR spectra of CoIII salt within the region of strong vibrational bands (Fig. 5) are very similar to those of other κ–phase BEDT–TTF salts [20–22]. The assignment of main vibrational features in the CoIII spectra is carried out on the basis of references [16, 21–23]. For polarisation E||, we observe a broad and strong band in the region 1130–1230 cm–1 related to the ν3(ag) mode of BEDT–TTF, activated by coupling with the charge transfer transition CT2. An antiresonance dip at about 1170 cm–1 is due to the ν67(b3u) mode. A doublet at 1286 and 1299 cm–1 is attributed to the ν5(ag) mode (CH2 vibrations), whereas a strong band at 875 cm–1 is attributed to the activated ν60(b3g) mode, according to the proposition made in [23]. The charge ordering at 150 K induces considerable modifications of the vibrational bands. Below 150 K the spectral feature related to the ν3(ag) mode has weaker intensity and lies in the higher-frequency region 1210–1270 cm–1; the intensity of this band is nearly temperature independent. Such a strong effect, together with the Raman data, suggest that (BEDT–TTF+0.5)2 dimers are nearly absent; therefore, the 1210–1270 cm–1 band can be associated with coupling of the ν3(ag) mode of charge-poor molecule with charge transfer between neighbouring dimers (CT2-type transition). For the mode ν67(b3u), we can see a band at 1167 cm–1 instead of the dip. The band ν60(b3g) reduces strongly its intensity, confirming thus an interaction of the ν60(b3g) mode with the CT2. Additionally, below 150 K we observe a new band at 1345 cm–1, related to the ν3(ag) mode of BEDT–TTF+1 cation, which is activated by coupling with the charge transfer transition CT1, as well as relatively weaker lines at about 1397 and 1449 cm–1, related to the ν45(b2u) and ν27(b1u) modes of BEDT–TTF+1, respectively. However, it is also possible that the band at 1449 cm–1 is due to the ν2(ag) vibration. In the IR spectra of a salt containing (BEDT–TTF+1)2 dimers, the ν27(b1u), ν2(ag), ν45(b2u), ν3(ag) bands were found at 1454, 1452, 1408, 1343 cm–1, respectively [18].
Optical conductivity spectra of κ–[Et4N](BEDT–TTF)4Co(CN)6·3 H2O within the region of strong vibrational bands.
Above 150 K, in the CoIII spectrum for polarisation E⊥ (Fig. 5), we observe strong bands at 1308 and 1242 cm–1 related to the ν3(ag) and ν5(ag) modes of BEDT– TTF+0.5, respectively, and the band ν60(b3g) at 881 cm–1. The phase transition has a strong influence on these bands: the band ν3(ag) is observed at 1314 cm–1 and it is of weaker intensity; a spectral feature consisting of three lines (1250, 1259 and 1267 cm–1) is related to the ν5(ag) mode; the band ν60(b3g) gets much weaker. However, for polarisation E⊥, the most important spectral change is the appearance of a relatively strong band at 1349 cm–1 as well as a weak band at 1398 cm–1, respectively, related to the ν3(ag) and ν45(b2u) modes of BEDT–TTF+1 cation.
Due to the phase transition at 150 K, the infrared spectra of the FeIII salt undergo analogous modifications to those observed for the CoIII salt (Figs. 6 and 7). In the vibrational spectra of the FeIII salt (both above and below 150 K), we find nearly all the spectral features described above for the CoIII salt: for example, below 150 K we observe the bands at 1342 cm–1 (E||) and 1344 cm–1 (E⊥), related to the ν3(ag) mode of BEDT–TTF+1 cation. It is important to emphasise, that in the case of FeIII salt, the spectral modifications are directly related to the phase transition at 150 K, although, as shown by Raman experiment, the charge redistribution occurs gradually below 240 K. For example, for polarisation E||, for bands related to the ν3(ag) mode, the disappearance of the spectral feature at 1170–1230 cm–1 and the appearance of a peak at 1227 cm–1 occurs at the phase-transition temperature 150 K (Fig. 7). Analogous conclusion results from the analysis of temperature dependence of electronic absorption [14]. Below 150 K, for the FeIII salt, the spectral features 1227 cm–1 (E||) and 1308 cm–1 (E⊥), attributed to the ν3(ag) mode activated by a CT2-type transition, are much stronger than those for the CoIII salt (see also Fig. 5), and considerably decrease their intensities when temperature goes down. Such behaviour can be related to a process of further charge redistribution intervening in the FeIII salt below 150 K.
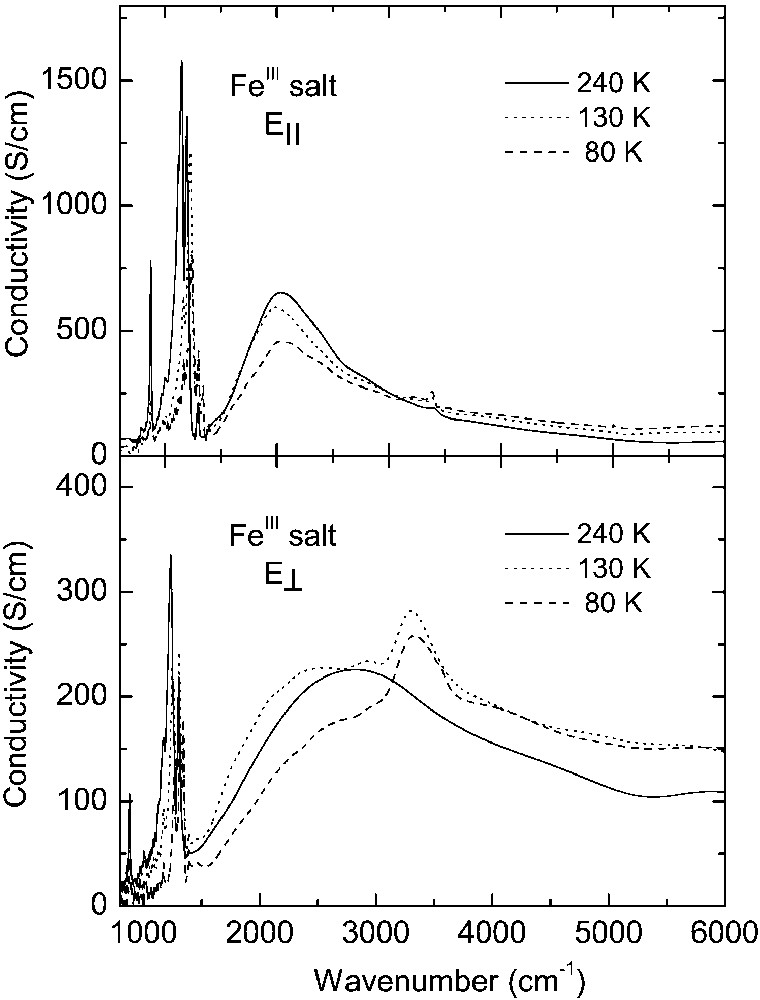
Optical conductivity spectra of κ–[Et4N](BEDT–TTF)4Fe(CN)6·3 H2O salt for two perpendicular polarisations corresponding to the maximum (E||) and minimum (E⊥) of reflected energy.
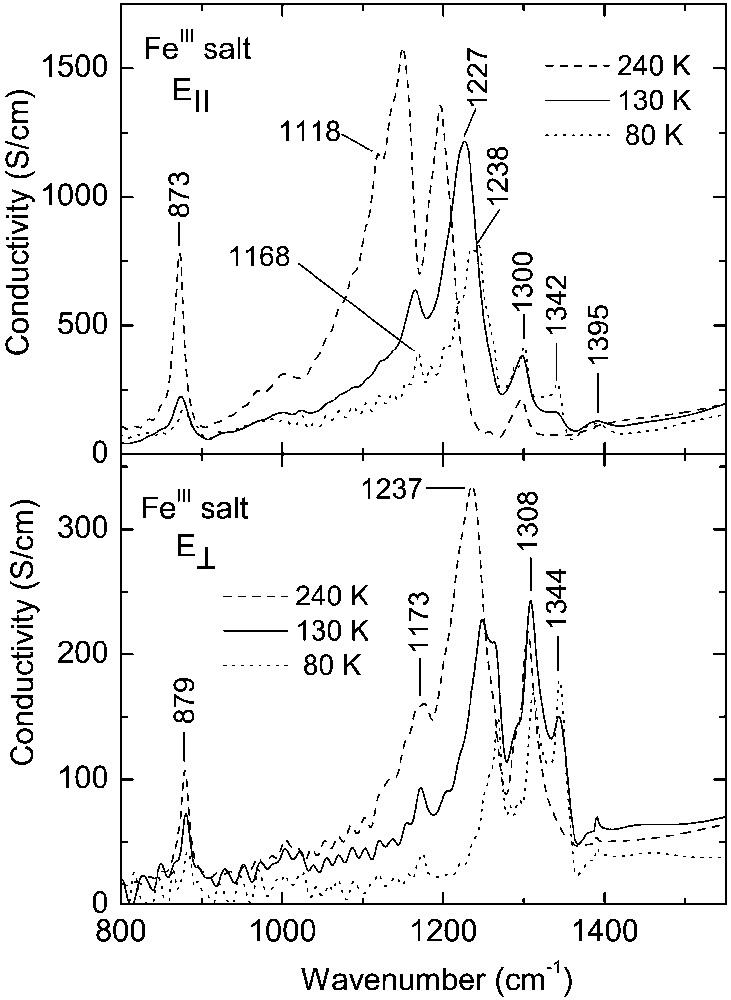
Optical conductivity spectra of κ–[Et4N](BEDT–TTF)4Fe(CN)6·3 H2O salt within the region of strong vibrational bands.
4 Discussion
The studied salts are isostructural, exhibit very similar physical properties and undergo analogous phase transitions at about 240 and 150 K, but the charge ordering inside conducting BEDT–TTF layers arises in different ways. The Raman spectra show that, in the CoIII salt, the charge redistribution occurs at the phase-transition temperature, i.e. 150 K. In this salt, above 150 K, the charge is distributed more or less uniformly among BEDT–TTF molecules (charge +0.5), while below 150 K most molecules are either neutral or possess a charge +1. On the other hand, in FeIII salt the charge redistribution starts already below 240 K, then develops gradually on temperature lowering and is even further continued below 150 K. In this case, the phase transition at 150 K has no drastic influence on the Raman spectrum. Nevertheless, the charge redistribution in FeIII salt seems to lead to analogous charge patterns as in the CoIII salt.
The differences between charge-ordering mechanisms in the studied compounds, as revealed by Raman experiment, are not directly observed in IR spectra. The IR electronic and vibrational features of both crystals change abruptly at the phase transition temperature T = 150 K. Such an effect should be expected in the CoIII salt, but is rather surprising in the FeIII salt. We suppose that in the FeIII salt, in the temperature range 240–150 K, the charge ordering is dynamical and does not lead to the formation of stable (BEDT–TTF+1)2 dimers. Such stable dimers are just created at 150 K, yielding modifications of the electronic and vibrational spectral features of the FeIII salt. The phase transition at 150 K causes modifications of the electronic structure. On the other hand, the vibrational bands are mainly due to the effect of coupling of BEDT–TTF vibrations with electrons; therefore, they are considerably modified when charge transfer transition between BEDT–TTF+1 cations is activated. Previous investigations of the ESR spectra and the magnetic susceptibility [10–12] have shown that the results for the FeIII salt were similar to those for the CoIII salt, but the experimental signatures of the phase transitions for FeIII salt were less clear and appeared in a wider temperature range. Our spectroscopic measurements confirm these observations.
Now we discuss possible reasons of the charge-ordering effect. The theoretical studies have shown that the insulating state of quarter-filled κ–phase BEDT–TTF salts is stabilised by the strong on-site Coulomb (U) interaction and strong dimerisation of conducting BEDT–TTF layers [24]. The presence of relevant values of the inter-site interactions (V) can be also expected in κ-phase salts; however, the stability of their insulating state is proved by the mean-field calculations by considering only U (without V). Consequently, the electronic states of these compounds can be considered by taking each dimer as a unit (dimer model). The important parameter of dimer model is the so-called on-site Coulomb interaction energy of the dimer (Ueff), which grows when t increases (t is intra-dimer transfer integral). Strong dimerisation leads to a phase with half-filled band, in which the Mott insulator is stabilised for strong electron correlations [24]. Consequently, in a typical κ-phase salt, the charge distribution is uniform among BEDT–TTF molecules and no charge-ordering phenomenon is expected.
Within the family of κ-phase BEDT–TTF salts the studied crystals κ–[Et4N](BEDT–TTF)4M(CN)6·3 H2O (M = CoIII, FeIII) are exceptional, since the degree of dimerisation of BEDT–TTF molecules is relatively weak [12]. The analysis of the crystallographic data at T = 115 K shows that the intra-dimer interaction is weaker than that one in typical κ-phase salts; moreover, it is weaker than the interaction between molecules belonging to neighbouring dimers. Consequently, the parameters Ueff and V are respectively smaller and larger, in comparison with a typical κ–phase salt; therefore, the Mott insulting state can be unstable. In this situation, the inter-site Coulomb interaction V plays an important role and gives rise to the charge ordering.
Theoretically, it was argued that inter-site Coulomb interactions (V) can stabilise charge ordered states in organic conductors based on BEDT–TTF donor [3]. Therefore, we suggest that, in the studied salts at T = 150 K, the parameter V/t becomes large enough to induce charge redistribution. If we assume that the degree of disorder in the FeIII salt is higher than in the CoIII salt (e.g. due to Et4N+ cations), the larger distribution of t can be expected and the charge redistribution can occur at different temperatures in different unit cells of the crystal lattice. In this way, one can explain differences between the charge redistribution phenomena in both compounds. Nevertheless, it is important to emphasise that the phase transition in both salts occurs at 150 K.
Acknowledgements
This work was partially supported by KBN under SPUB–M (COST D14) and POLONIUM project No. 03273NK.