

1 Introduction
Microemulsion polymerization is beside seeded emulsion polymerization the only heterophase polymerization technique with a well-defined initial state that is a thermodynamically stable dispersion of monomer droplets in an immiscible liquid as continuous phase. A microemulsion is phenomenologically described as transparent dispersion of two immiscible liquids in the presence of suited surfactant (sometimes in combination with a cosurfactant) which forms spontaneously when the components are brought together in a proper ratio [1]. In the case of seeded emulsion polymerization preformed polymer particles (so-called seed particles) are allowed to swell with monomer(s) before the polymerization is started under properly chosen conditions in order to avoid the nucleation of any new particles. Swelling is a spontaneous process also driven by thermodynamics and leads to monomer – polymer particles with a volume ratio of about 1:1. During swelling the solid seed particles are converted into liquid emulsion droplets with increased size. Any other heterophase polymerization technique such as emulsion and suspension polymerization is started from a dispersed state made by comminution and is in a thermodynamic sense unstable. Hence, in these cases the control of droplet size and composition is compared with the thermodynamically stable emulsions much more complicated [2].
The first microemulsion polymerization was described only more than 30 years after the appearance of Schulman’s introductory article to the topic in the scientific literature [3]. In a series of three papers Stoffer and Bone described in 1980 first polymerization experiments with water in oil microemulsions where the monomer (methyl methacrylate (MMA) or methyl acrylate) formed the continuous phase [4–6]. They employed sodium dodecyl sulphate (SDS) as surfactant and pentanol as cosurfactant [4,5] but also surfactant mixtures with polymerizable surfactants such as sodium 10-undecenoate and 4-penten-1-ol [6]. Already shortly later, in 1981 Thomas and co-workers reported the first microemulsion polymerization where the monomer (styrene) was thermodynamically stable dispersed in an aqueous cetyltrimethylammonium bromide (CTAB) solution with 1-hexanol as cosurfactant [7]. These authors obtained the first polymer latexes particles made by microemulsion polymerization with the special characteristic of extremely small particle sizes with diameters between 40 and 20 nm. Since this time, microemulsion polymerization attracts researches continuously for at least the following reasons. First, the initial state is thermodynamically stable and more or less well defined. Second, only by changing the molar fractions of the components and not the chemical composition the initial state can be shifted from an oil in water to a water in oil microemulsion via several intermediate bicontinuous states. Third, the particle size is at the lower end of the scale of polymer particles that are accessible by heterophase polymerizations. Fourth, the large surface area of the polymer latex particles – for instance, polystyrene particle with an average diameter of 20 nm posses a surface area of about 300 m2 g–1 – offers a variety of potential applications. But the price for this high interface is an extremely high amount of surfactant, which in fact is much higher than the minimum amount needed for stabilizing the final polymer particles.
Overviews of polymerizations in microemulsions with emphasis to the mechanism, special features, and possible applications can be found in [8–14]. With regard to the mechanism of microemulsion polymerization, there is agreement that despite the solubility of the initiator the reaction takes place in all phases that is the continuous phase, the monomer droplets, and the polymer particles (initiated former drops) and that exchange processes govern the kinetics. In the most unfavourable case, particle nucleation is considered as two-stage process where the first state is homogeneous nucleation characterized by a very slow increase in conversion and the second stage is entry of radicals into monomer droplets (swollen micelles) causing a much higher polymerization rate [14]. How much both effects contribute in a particular microemulsion polymerization depends mainly on the solubility of the monomer in the continuous phase.
The aim of this contribution is, based on experimental results of butyl acrylate microemulsion polymerization, to discuss the influence of the surfactant to monomer ratio on the process. This ratio is of special importance as it is much higher than in any other heterophase polymerization technique and above a certain limit it may cause some unusual effects with regard to kinetics and mechanism. After reconsidering published data on properties of microemulsions with monomers as dispersed oil phases and some results on microemulsion polymerizations, our own experimental results obtained with butyl acrylate at various surfactant concentrations will be discussed.
2 Microemulsion polymerization: some general aspects
2.1 Shape and structure of microemulsion droplets
With regard to the initial state that is the structure and shape of microemulsions droplets before the polymerization both the overall surfactant concentration in the mixture and the water to oil ratio plays a crucial role [15–17]. Low values of both favour the formation of isolated spheres of the disperse phase. But with increasing values a transition to bicontinuous lamellar structures via rod-like globules is in many cases observed.
According to de Gennes [16], microemulsions are formed when the following principles are satisfied. First, the surfactant saturates the interface rather than building up pure structures in either phase. Second, the interface is highly fluid that is the rigidity is low. Third, if a cosurfactant is present it increases the disorder of the interfacial film in accordance with ideas of Schulman [18]. Fourth, long-range interactions are weak so that any crystallization between the droplets is suppressed.
Carnali and Fowkes carried out a detailed experimental analysis of the composition of MMA swollen micelles and microemulsion droplets of MMA in aqueous SDS solution with 1-hexanol by combining nuclear magnetic resonance spectroscopy (NMR), headspace analysis with gas chromatography, and small angle X-ray scattering (SAXS) [19]. In particular, the authors showed that:
- • (a) the monomer is distributed among all phases and interfaces verifying that the interfacial layers are not impenetrable;
- • (b) the core of the microemulsion droplets is basically a water saturated MMA 1-hexanol mixture;
- • (c) both the monomer and the cosurfactant have three solubilization sites, which are the droplet core, the interface, and the continuous aqueous phase;
- • (d) 1-hexanol is rather evenly distributed between the core and the interface with only a slight preference for the core;
- • (e) a substantial amount of the MMA is solubilized in the interface (especially at lower monomer concentration) but the relative amount decreases with increasing total amount leading to an accumulation of the MMA in the core, which causes the surface to volume ratio to decrease of the drops;
- • (f) at higher MMA concentration the shape of the drops deviates from a sphere and ellipsoidal-like drops are formed.
These results lead to important conclusions with regard to the formation of microemulsions especially with regard to the role of the 1-hexanol cosurfactant in the enhanced solubilization of MMA compared with neat SDS micelles. Micelles of single surfactants will solubilize only such an amount of oil molecules until a pure oil core is formed. Beyond this point, additional oil molecules will form a bulk phase as no energy gain is any longer obtained due to the vanishing entropy of mixing between the oil molecules and the surfactant tails. However an enhanced solubilization of oil is possible in the presence of cosurfactant. The cosurfactant molecules in the core provide additional entropy of mixing and those on the interface additional stabilizing area thus, both effects allowing a further growth of the swollen micelles. It is necessary to mention that the distribution of the monomer between the different phases and among the drops is strongly influenced by the hydrophilicity (water solubility) of the monomer. So, hydrophobic monomers are more distributed inside the hydrophobic core of the drops and not that much in the interface whereas hydrophilic monomers such as MMA may act additionally as cosurfactant.
The above results suggest a continuous transition between swollen micelles and microemulsion droplets which is proved by the plot in Fig. 1 that shows experimental data how the droplet size (D) changes in dependence on the amount of MMA (CMMA) according to [19]. D is the overall or outer diameter of the micelle/droplet (cf. discussion below) as determined by SAXS measurements. These data clearly reveal that there is indeed continuity between neat micellar solutions (CMMA → 0), swollen micelles (0 < CMMA ≤ 100), and microemulsions (CMMA > 0) as also discussed in [20,21]. Note that CMMA up to 100 % corresponds to swollen micelles (3-component system), whereas CMMA > 100 % means the increase in monomer uptake by the addition of the co-surfactant (microemulsion region).
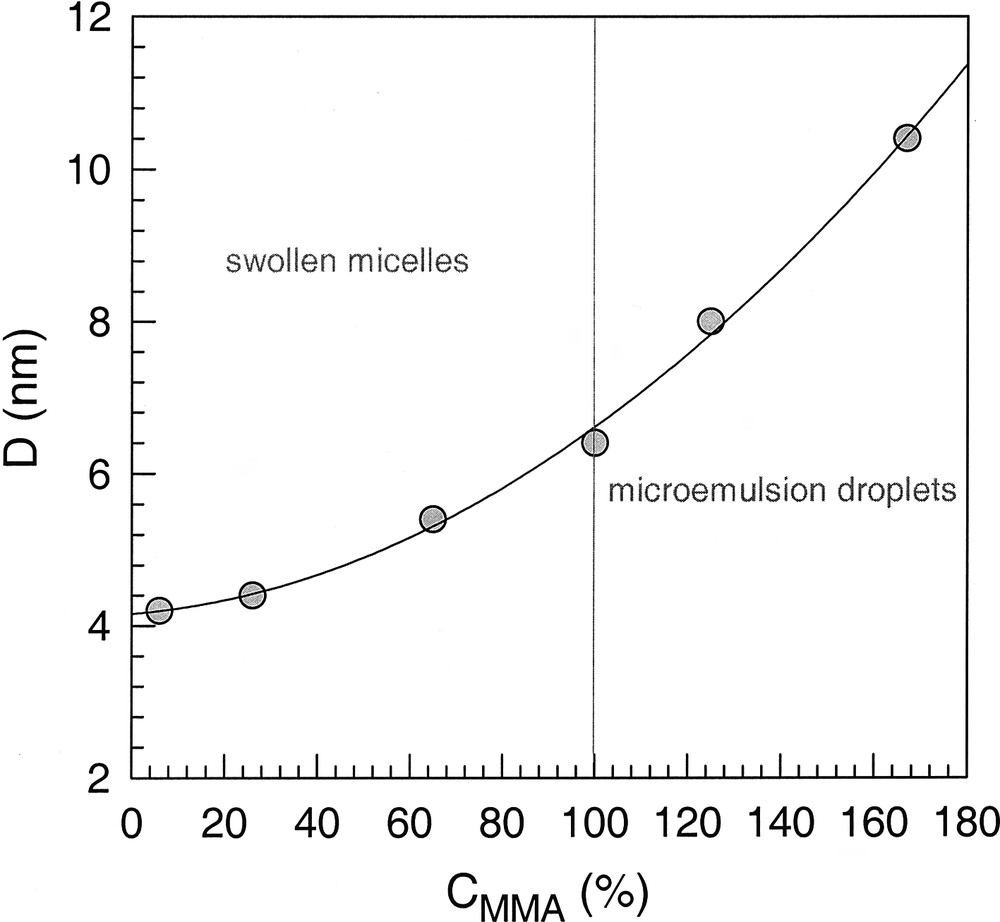
Diameter of swollen SDS micelles in dependence on the amount of MMA relative to the saturation concentration; values of CMMA above 100% are obtained for microemulsion with 1-hexanol [19]. Dots: experimental data line; regression (D in nm; CMMA in %).
D=4.1579+5.0618× 10− 3CMMA+1.9465× 10− 4CMMA2
Using the nomenclature of Winsor for equilibrated microemulsion systems batch ab-initio emulsion polymerizations (that is unseeded) and microemulsion polymerizations (the kind that is the object of this contribution) might be considered as Winsor-type I and Winsor-type IV systems, respectively [22]. In other words, ab-initio batch emulsion polymerization can be classified as Winsor-type I (swollen micelles, that is micelles containing the saturation amount of solubilized monomer) in equilibrium with excess of monomer. This contribution is restricted to oil in water microemulsion polymerizations where the initial state before polymerization is a Winsor-type IV microemulsion composed of spherical monomer droplets in a continuous aqueous phase. The assumption of spherical droplets requires that the volume fraction of the dispersed monomer phase is low and hence, the average diameter of the neat monomer drops (Dmon) is given by Eq. (1):
| (1) |
Eq. (1) is based on the idea that Dmon is the size of a pure oil or monomer drop that can be stabilized by ns surfactant molecules each stabilizing an area of as. This consideration implies two important features. First, the volume of a droplet (precisely its hydrophobic portion) is composed of the monomer volume (vmon) plus the volume of the hydrophobic tails of the surfactant. Second, the extension of the hydrophilic groups into the aqueous phase adds to the overall size of the drops. However, the structure of microemulsion droplets especially the location of the molecules of the surfactant and cosurfactant is a matter of controversial discussion. To illustrate the problem, Fig. 2 shows three sketches how microemulsion droplets might look like where different circles schematize various definition of drop sizes. Full lines describe the dimension of the monomer core independent of its composition as it is the basic assumption for Eq. (1), dashed lines mark the dimensions including the surfactant layer, and the outer dotted lines illustrate the hydrodynamic dimensions as measured by dynamic light scattering or calculated from viscosity data. The difference between the structures A and C is in the composition of the core and the interface. In all cases, the interface is composed of the surfactant and cosurfactant molecules. The difference is in the degree of mixing between the hydrocarbon tails of the surfactant/cosurfactant and the monomer molecules. Structure A is very schematic and rather unlikely as it is known, that adsorbed surfactant layers are able to solubilize oil molecules – a process which is known as adsolubilization [23]. With regard to the requirements for the formation of microemulsion droplets, structure C has the highest entropy of mixing and should be the most likely one. This structure is also in accordance with the experimental data of Carnali and Fowkes [19]. The important consequence for a subsequent polymerization reaction in microemulsions is that the monomer inside the droplets is practically diluted, which might influence the kinetics if the volume ratio monomer to surfactant (hydrocarbon tail) is an extremely small number.
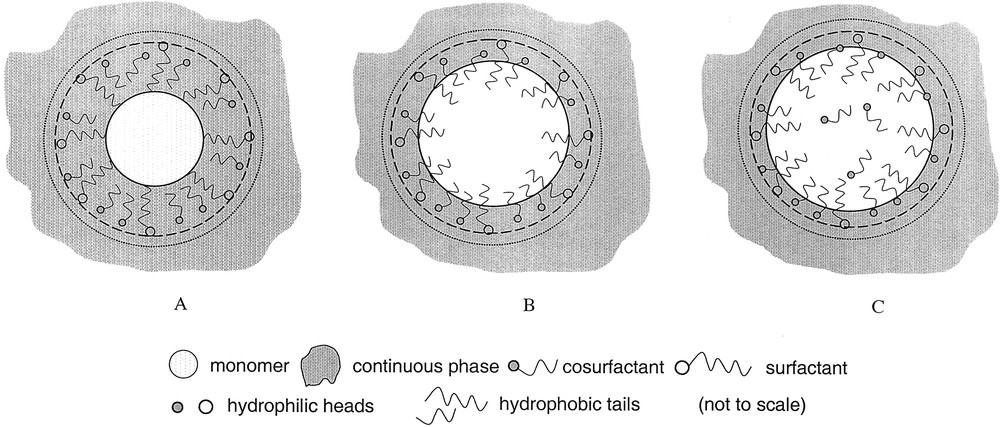
Schematic drawing of possible morphologies of microemulsion droplets (not to scale). Full circle: size of the monomer core. Dashed circle: size of the monomer core plus the surfactant layer. Dotted circle: hydrodynamic size of the droplet. A: Surfactant and cosurfactant stick at the monomer – water interface according to [39]. B: Surfactant and cosurfactant tails dip about half into the monomer phase according to [40]. C: Surfactant and cosurfactant tails dip almost completely into the monomer phase according to [19].
2.2 Microemulsions before and after polymerization
On the base of continuity between swollen micelles and microemulsions, one might also expect continuity between various kinds of ab-initio batch heterophase polymerizations with increasing stabilizer concentration. The scheme depicted in Fig. 3 tries to classify heterophase polymerization techniques in a kind of phase diagram with respect to the mass ratios monomer/water (mmon/mw) and surfactant/monomer (ms/mmon). In that phase diagram the average droplet and/or particles size decreases with decreasing mmon values along both axes. That is, reducing the amount of monomer for a given recipe and polymerization techniques or increasing the stabilizer concentration for a given mass of monomer leads to a decrease in the average size of the disperse phase. Although there are no sharp criteria to distinguish all the heterophase polymerization techniques [2] emulsion polymerization allows within the frame of that scheme to vary the average particle size over the widest range and hence, it acts like a ribbon holding together all the various techniques.
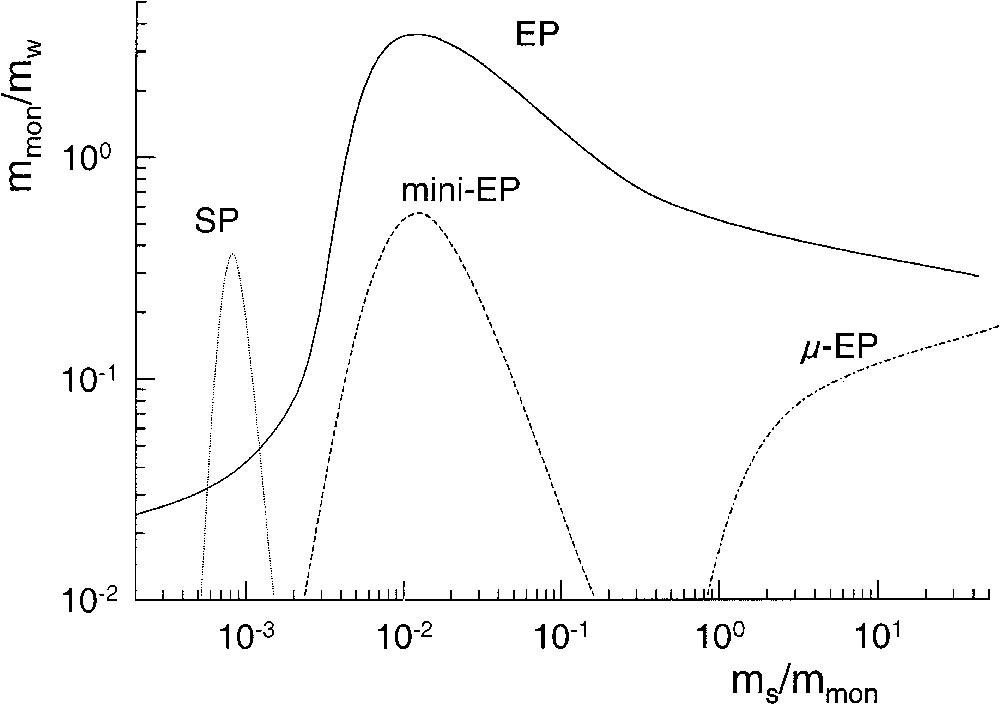
Schematic phase diagram sketching semi-quantitatively areas of different heterophase polymerizations with respect to the mass ratios monomer/water (mmon/mw) and surfactant/monomer (ms/mmon); SP: suspension polymerization, mini-EP: miniemulsion polymerization, EP: emulsion polymerization, μ-EP: microemulsion polymerization.
The recipes summarized in Tables 1 and 2 clearly prove the position of microemulsion polymerizations in the lower right corner of the phase diagram as depicted in Fig. 3. The values for nsubM0/nsubS0 and Dmon are surely good estimates, but they are not exact because for the calculations the cosurfactant was neglected and the overall surfactant concentration was used without correction for the cmc. The latter approximation introduces an error, which is less than 10 % and is justified for at least two reasons. First, the cmc of the surfactants mentioned in Table 1 is in the mM-range and compared to the overall concentrations negligible [25]. Second, any reasonable correction for the cmc of the surfactants requires the cmc under the particular conditions with respect to temperature, ionic strength, and composition of the aqueous phase. However, the data in Tables 1 and 2 prove the influence of the solubility of the monomer in water especially if it is relatively high as in the case of MMA and the overall monomer concentration is low [examples 3/3c) and 4/4c)]. For the monomers mentioned in Tables 1 and 2, the following solubilities in water have been used: 0.15 M for MMA [26], 0.01 M for BA [27], and 0.003 M for styrene [24]. A comparison between examples 12 and 12b) in Tables 1 and 2 reveals that already for BA the consideration of the water solubility leads to changes which are smaller than the uncertainty of these calculations. Nevertheless the data in Tables 1 and 2 contain important information with respect to the mechanism of microemulsion polymerization. The monomer droplets as potential reaction loci are quite small and the number of monomer molecules per droplet is for Dmon < 5 nm less than 500 and for the smallest drops in Table 2 (example 7) only between 20 and 1. On the other hand the drop numbers (Nd) are so high that the average distance between two drops (dpp) is in many cases below 10 nm, which means short free diffusion paths in the aqueous phase. Furthermore, the small drop size favours a high Laplace pressure . However, this effect is counterbalanced by the extremely low or even vanishing interfacial tension (σ) in microemulsions (cf. [16–22]). But already slight deviation from the microemulsion equilibrium causes an increase in the interfacial tension and hence, a high Laplace pressure builds up. In other words, as soon as a Laplace pressure is building up the microemulsion moves towards instability, which might be partly counterbalanced by osmotic effects due to the presence of the cosurfactants but much more effectively by extremely lyophobic, low molecular weight compounds such as used during activated swelling procedures [46]. The characteristic time of the exchange of monomer molecules from droplets during Ostwald ripening (τex) is given by Eq. (2), where ϕw is the dimensionless solubility of the monomer in water and Dm is the monomer diffusion coefficient.
| (2) |
Microemulsion polymerization recipes with regard to kind of surfactant/cosurfactant, monomer, and number of monomer to surfactant molecules (nsubM0/nsubS0)
| # | Surfactant system a) | Monomer | Water | nM0/nS0 | Ref. |
| 1 | 1 g CTAB 0.5 g 1-hexanol | 1 g styrene | 50 g | 3.5 | [7] |
| 2 | 2.75 g SDS 1.169 g 1-pentanol | 1.475 g styrene | 25 g | 1.5 | [30] |
| 3 | 1–10 g CTAB | 5–4.55 g MMA | 94–85.45 g | 18.2–1.7 | [35] |
| 3 b) | 1–10 g CTAB | 3.59–3.27 g MMA | 94–85.45 g | 13–1.2 | [35] |
| 4 | 3–12 g CTAB | 9.7–8.8 g MMA | 87.3–79.2 g | 11.8–2.7 | [35] |
| 4 b) | 3–12 g CTAB | 8.39–7.61 g MMA | 87.3–79.2 g | 10.2–2.3 | [35] |
| 5 | 0.4–6 g CTAB | 2 g styrene | 97.6–92 g | 17.5–1.2 | [40] |
| 6 | 2–33 g CTAB | 10 g styrene | 88 - 67 g | 17.5–1.1 | [39] |
| 7a | 5–20 g DTAB | 2 g styrene | 93–78 g | 1.2–0.3 | [44] |
| 7b | 14.4–13.8 g DTAB | 4–8 g styrene | 81.6–78.2 g | 0.85–1.78 | [44] |
| 8 | 38.5 g SDS 16.36 g 1-pentanol | 20.65 g styrene | 350 g | 1.5 | [31] |
| 9 | 20 g SDS | 10 g BA | 100 g | 1.1 | [38] |
| 10 | 9.27–18.54 g SDS 3.14–6.28 HPMAc) | 3.37–6.64 g styrene | 84.23–68.44g | 1 | [34] |
| 11 | 7.92–6.8 g SDS 6.78–5.82 1-pentanol | 8.5–1.47 g styrene | 75.9–81.81 g | 3–0.6 | [34] |
| 12 | 5–10 g SDS/AOT (3/1 : w/w) mixture | 2 g BA | 95–90 g | 1.2–0.60 | this work |
| 12b) | 5–10 g SDS/AOT (3/1 : w/w) mixture | 1.8782 - 1.8846 g BA | 95–90 g | 1.1–0.56 | this work |
Initial conditions of microemulsion polymerizations according to the recipes summarized in Table 1.
| # | Dmon (nm) | Dd (nm) | Nd (cm–3) | dpp (nm) | Ref. |
| 1 | 8.4 | 10 | 7.2 × 10¹⁶ | 24 | [7] |
| 2 | 2.5 | 4.7 | 8.0 × 10¹⁸ | 7.1 | [30] |
| 3 | 30–2.7 | 31–3.7 | 4.1 × 10¹⁵–5.5 × 10¹⁸ | 62–5.7 | [35] |
| 3 b) | 22–2 | 23–2.9 | 8.0 × 10¹⁶–1.0 × 10¹⁹ | 50–4.5 | [35] |
| 4 | 19.5–4.4 | 21–5.5 | 3.2 × 10¹⁶–2.7 × 10¹⁸ | 31.5–7.1 | [35] |
| 4 b) | 16.8–3.8 | 18–4.9 | 4.3 × 10¹⁶–3.7 × 10¹⁸ | 28.6–6.5 | [35] |
| 5 | 42–2.8 | 44–4.1 | 5.9 × 10¹⁴–2.1 × 10¹⁸ | 120–8 | [40] |
| 6 | 42–2.5 | 44–3.8 | 3.5 × 10¹⁵–1.9 × 10¹⁹ | 70–4 | [39] |
| 7a | 2.8–0.71 | 3.9–1.4 | 1.9 × 10¹⁸–1.5 × 10²⁰ | 7.9–1.9 | [44] |
| 7b | 2.0–4.1 | 2.9–5.2 | 1.4 × 10¹⁹–3.1 × 10¹⁸ | 4.1–6.9 | [44] |
| 8 | 3.6 | 4.7 | 2.8 × 10¹⁸ | 3.6 | [31] |
| 9 | 3.3 | 4.4 | 5.8 × 10¹⁸ | 3.3 | [38] |
| 10 a) | 8.9–4.6 | 10.2–5.8 | 4.4 × 10¹⁷–4.0 × 10¹⁸ | 13.1–6.3 | [34] |
| 11 | 7.1–1.4 | 8.4–2.3 | 6.5 × 10¹⁷–1.3 × 10¹⁹ | 11.5–4.3 | [34] |
| 12 | 2.7–1.3 | 3.7–2.2 | 2.4 × 10¹⁸–2.0 × 10¹⁹ | 7.5–3.7 | this work |
| 12 b) | 2.5–1.3 | 3.5–2.1 | 2.7 × 10¹⁸–2.2 × 10¹⁹ | 7.2–3.5 | this work |
As the number of droplets is in some cases as high as up to 1020 cm–3 an initiation in all droplets within a period of time that corresponds to the average lifetime of a growing macromolecule (τl) is practically impossible. Assuming an average degree of polymerization of 104 and a polymerization temperature of 60 °C τl is 5 × 10⁻², 2, and 5 s for BA, MMA, and styrene, respectively. The calculations were carried out according to where kp is the propagation rate constant and CMp the monomer concentration. CMp = 6 M was used for all monomers and 33 700, 833, and 341 l mol–1 s–1 as propagation rate constants for BA, MMA, and styrene, respectively [28]. The maximum number of radicals produced by thermal decomposition of initiators such as 2,2'-azobisisobutyronitrile (AIBN) or potassium peroxodisulphate (KPS) is about 3 × 10¹⁴ s–1 cm–3 at 60 °C, which is still below the value required for producing one radical per drop within τl. (The initiator decomposition rate constant and the initiator concentration were assumed to be 5 × 10⁻⁵ s–1 and 10–2 M, respectively, where both values represent upper limits.) These estimations lead to the conclusion that the fixation of microemulsion droplets by radical polymerization is practically impossible, unless extremely high but unrealistic initiation rates can be realized. Furthermore, particles that are formed during an early stage of the reaction will soak up monomer from virgin droplets and the monomer is quickly delivered from the droplets due to their small size (cf. above). Additionally, exchange processes are supported by the small distance between the droplets / particles (dpp in Table 2) during the early reaction. The data compared in Table 3 give clear evidence that at the end of microemulsion polymerizations the size of the particles is larger than the estimated size of the droplets and consequently the number of particles is smaller than the number of initial droplets. If the number of droplets would have been preserved during the polymerization reaction one would expect shrinkage of droplets due to the higher density of the polymers compared with their monomers according to ΔD=Dmon(1− (ρm/ρp)1/3) where ΔD is the shrinkage and ρm and ρp are the monomer and polymer densities, respectively. Independent experimental support is caused by the molecular weight data. The preservation of the droplet number requires particles consisting of only a single chain (chain transfer without subsequent radical exit is neglected) with a chain length corresponding to the number of monomer molecules per initial drop. Accordingly, particles with diameters of 20, 50, and 100 nm should contain single chains with MW of 2.7 × 10⁶, 4.1 × 10⁷, and 3.3 × 10⁸ g mol–1, respectively. The experimental molecular weight data are on the one hand smaller than the expected values for single chain particles and on the other hand larger than the estimated number of monomer molecules per initial drop (nm). This behaviour is in accordance with Antonietti’s typical behaviour for fragile microemulsions, that is the initial microemulsion breaks during the polymerization into a ‘normal’ polymer dispersion [11]. On the contrary, ‘sturdy’ microemulsions preserve their properties (or keep their place in the phase diagram) throughout the polymerization process. The authors discuss two possibilities to preserve microemulsion polymerization either to increase the rate of initiation (which however requires unrealistically high values, cf. above) or to restrict the monomer exchange between virgin droplets and polymerizing particles by reducing the swelling ability of the latter due to cross-linking. But also cross-linking cannot preserve the initial microemulsion state with regard to size and number, as examples 5 and 6 in Tables 1–3 show. Furthermore, the authors also in the presence of cross-linker observed a clear decrease in the final particle size with increasing initiator concentration, which can only be explained with a certain degree of fragility of the systems [11]. For the sake of completeness, it should be mentioned that some authors obtained experimental evidence that there might be microemulsion polymerization systems leading to particles with one or at least a very low number of molecules per particles [29,30]. For the microemulsion polymerization of tetrahydrofurfuryl methacrylate [29], the authors found that extrapolation of mass average molecular weight to 0 % conversion (3.2 × 10⁶ g mol–1) coincides with a single chain particle of 20 nm diameter (ρp = 1.22 g cm–3), which almost corresponds to the smallest particle fraction observed in electron microscopy pictures. But these single chain particles are not the characteristic feature of this microemulsion polymerization as the authors found increasing molecular weight and increasing particle sizes with progressive conversion clearly supporting that exchange processes dominating the polymerization. The dynamics during microemulsion polymerization must not necessarily lead to an increase in the average particle size with increasing conversion but the average particle size can also stay constant or even decrease if continuous particle nucleation takes place. Both scenarios are described by Nomura for microemulsion polymerizations of styrene in SDS/1-pentanol surfactant system with various types of initiators where the size of the polymer particles (Dp) stays almost constant [31,32] and in the presence of chain transfer agents where Dp decreases [33].
Comparison of droplet sizes (Dd), droplet numbers (Nd), and number of molecules per droplet (nm) before polymerization (estimated values) with particle sizes (Dp), particle numbers (Np), and molecular weights (MW) after polymerization (experimental values)
| # | Dd (nm) | Dp (nm) | Nd (cm–3) | Np (cm–3) | nm | MW (g mol–1) | Reference |
| 1 | 10 | 20–40 | 7.2 × 10¹⁶ | n.m. | 1.7 × 10³ | n.m. | [7] |
| 2 | 4.7 | 20–30 | 8.0 × 10¹⁸ | ~6 × 10¹⁵ | 128 | 105–106 | [30] |
| 3 | 31–3.7 | 50–30 | 4.1 × 10¹⁵–5.5 × 10¹⁸ | 1–7 × 10¹⁵ | 7.7 × 10⁴–58 | ~5 × 10⁶ | [35] |
| 4 | 21–5.5 | 62–60 | 3.2 × 10¹⁶–2.7 × 10¹⁸ | 1–2 × 10¹⁵ | 2 × 10³–243 | ~6 × 10⁶ | [35] |
| 5 | 44–4.1 | 110–20 | 5.9 × 10¹⁴–2.1 × 10¹⁸ | n.m. | 2 × 10⁴–62 | cross-linked | [40] |
| 6 | 44–3.8 | 110–20 | 3.5 × 10¹⁵–1.9 × 10¹⁹ | n.m. | 2 × 10⁴–47 | cross-linked | [39] |
| 7a | 3.9–1.4 | n.m. | 1.9 × 10¹⁸–1.5 × 10²⁰ | n.m. | 65–1 | n.m. | [44] |
| 7b | 3–5.2 | 20–30 | 1.1 × 10²¹–2.4 × 10²⁰ | n.m. | 22–198 | ~ 4 × 10⁵ | [44] |
| 8 | 4.7 | 40 | 2.8 × 10¹⁸ | ~1015 | 128 | ~7 × 10⁶ | [31] |
| 9 | 4.4 | 50 | 5.8 × 10¹⁸ | ~1015 | 104 | ~1 × 10⁶ | [38] |
| 10 | 10.2–5.8 | 20–15 | 4.4 × 10¹⁷–4.0 × 10¹⁸ | n.m | 2 × 10³–282 | n.m. | [34] |
In conclusion of this part, published results for polymerization of oil in water microemulsions stabilized with ionic surfactant systems (including if needed a cosurfactant) show that with regard to size and number of the dispersed state the final polymer latex has nothing in common with the initial microemulsion of the monomer. The polymerization reaction drives the initial microemulsion, obviously caused by the change in composition, out of the equilibrium. This behaviour was even found for microemulsion polymerizations of styrene with various hydroxyalkyl acrylate and methacrylate monomers as reactive cosurfactants (cf. example 10 in Tables 1 and 2) where one might expect that the initial microemulsion droplets would be preserved due to the ability of cosurfactants to polymerize [34].
2.3 The influence of the surfactant-to-monomer ratio
The data put together in Tables 1–3 already reveal that there is an enormous influence of the surfactant to monomer mass ratio (WS) on the parent microemulsion but also on the final polymer dispersion. Most of these data confirm the expected behaviour from all other heterophase polymerizations that with increasing WS the particles size in the final latex decreases. But a closer look at the polymerization kinetics shows some unexpected results. In a series of interesting papers Gan et al. [35–37] investigated the transition from emulsion to microemulsion polymerization of methyl methacrylate, styrene, and isobutyl methacrylate as monomers. For methyl methacrylate ternary systems (CTAB, water, MMA, KPS as initiator), they observed in the emulsion polymerization regime at WS < 1 an increase in the initial rate of polymerization, in an intermediate range 1.04 <WS < 1.72 corresponding to the transition range between emulsion and microemulsion regimes a decrease in the initial rate of polymerization, and at still higher ratios in the microemulsion regime again an increase in the rate [35]. Moreover, for WS > 1.72, the authors observed an increase in the hydrodynamic particle size with increasing surfactant concentration. For styrene as monomer but with tetradecyltrimethylammonium bromide as surfactant the authors observed over the whole WS-range from emulsion to microemulsion polymerization an increase in both the rate and the particle number with increasing surfactant concentration [36]. But a real comparison is not possible due to the different stabilizers. A decrease in the rate of polymerization was also observed for i-butyl methacrylate as monomer with increasing CTAB concentration in the microemulsion regime but no increase in the particle size as in the case of MMA [37]. For microemulsions of butyl acrylate with SDS as sole surfactant Capek et al. observed also a decrease in the rate of polymerization with increasing surfactant concentration but a decrease in the average particle size [38]. Antonietti [39] and Wu [40,41] investigated the dependence of the final particle size in styrene microemulsion polymerizations (in the presence of 10 mol% 1,3-diisopropenyl-benzene as cross-linker) with CTAB as sole surfactant over a wide range of WS from 0.2 to 3.3. These authors observed an almost linear decrease in the average particle size with increasing WS. At the highest values of WS for dodecyltrimethylammonium bromide as surfactant, the data of Antonietti et al. [39] show a slight deviation to increasing particle sizes. Also in the classical microemulsion polymerization of styrene with SDS and 1-pentanol, a decrease in the rate of polymerization with increasing WS-values from 0.93 to 4.6 was observed [34]. Moreover, at the highest WS-values of 1.7 and 4.6, polymerization stopped at about 70 and 35 % conversion, respectively, whereas at WS of 0.93 the polymerization runs to almost complete conversion.
This brief summary shows that heterophase polymerizations may differ regarding kinetics (rate of polymerization) and colloidal aspects (particle size and related properties) at high WS-values (WS > 1) compared with WS-values in the range below 1. Moreover, these effects depend on the hydrophilicity of the monomer where hydrophilic monomers such as MMA are more prone to deviation from the normal behaviour than hydrophobic monomers. The most astonishing behaviour is that in the case of iso-butyl methacrylate and BA [37,38] a decrease in the rate of polymerization was observed accompanied by an increase in the number of particles (decrease in the average size of the particles) with increasing WS (cf. discussion below). Although this contribution is devoted to oil in water microemulsions it is to mention that also in the case of acrylamide microemulsion polymerization in toluene with AOT as surfactant and AIBN as initiator a similar behaviour was observed [42]. The rate of any heterophase polymerization is given in a general manner by Eq. (3), where N is the number of polymer particles per unit volume of continuous phase (reaction loci), CMp is the monomer concentration in the particles (at reaction locus) in moles per unit volume of swollen particles, kp is the propagation rate constant, is the average number of growing radicals per particle, and NA is Avogadro’s number.
| (3) |
3 Experimental part
3.1 Materials
SDS (99% from Aldrich) and KPS (Wako Chem.) were recrystallized from methanol. Another batch of SDS (ultra pure from Roth), AOT (98 % from Sigma or Fluka) was used as received. Butyl acrylate (BA) (Aldrich) was distilled at 50 °C under reduced pressure, stored at 4 °C in dark vials in the refrigerator, and used within 30 h after distillation. For the determination of the phase diagrams, 50 ppm of hydroquinone (Aldrich) were added to BA to avoid polymerization. Water was either distilled or taken from a Seral purification system (PURELAB Plus™) with a conductivity of 0.06 μS cm–1 and was degassed prior to use for the polymerization.
3.2 Determination of the phase behaviour
One-phase regions at 25 and 60 °C were determined visually by titrating aqueous solutions of SDS-AOT with BA. Samples were examined through cross polarizers to assure they were not birefringent. Electrical conductivity of microemulsions was measured at 60 °C and 1000 Hz with an Orion 101 conductometer.
3.3 Microemulsion polymerizations
The recipes summarized in Table 4 were used to investigate the behaviour of BA microemulsion during polymerization in dependence on the surfactant concentration. Note that the molar concentrations relative to the continuous phase are different but the contents of monomer/polymer and initiator relative to the overall mass are the same for each recipe. BAs in water microemulsions according to these recipes (ME-1, ME-2, ME-3) were polymerized at 60 °C by two different procedures in two different reactors. For all procedures, BA and the aqueous surfactant solutions were carefully deoxygenated prior to polymerization. After addition of the monomer to the surfactant solution, a visibly clear microemulsion is formed after a few minutes with or without stirring at both room temperature and 60 °C. Also after injection of the initiator solution (0.018 g of KPS dissolved in 1 ml of water) the one phase microemulsion remains stable for a certain period of time before it starts to become turbid (cf. discussion below).
Polymerization recipes
| # | SDS (g) | AOT (g) | BA (g) | KPS (g) | Water (g) |
| MEP-1 | 3.75 | 1.25 | 2 | 0.018 | 95.0 |
| MEP-2 | 5.625 | 1.875 | 2 | 0.018 | 92.5 |
| MEP-3 | 7.5 | 2.5 | 2 | 0.018 | 90.0 |
3.3.1 Procedure 1 (reaction calorimeter)
The reaction rates of the microemulsion polymerizations were on-line monitored with an absolute heat flow (HF) reaction calorimeter (CPA200 reaction calorimeter system form ChemiSens AB, Lund, Sweden). The reactor with an overall volume of 200 ml is made of both glass (the upper reactor walls) and stainless steel (316 SS for bottom, lid, and stirrer). The stirrer was a four-paddle stirrer and the stirrer speed was adjusted to 300 revolutions per minute. The aqueous surfactant solution, the monomer, and the reactor were carefully purged with nitrogen for 30 min to remove oxygen before the reactor was filled with the surfactant solution and the monomer. The polymerization was started after thermal equilibration of the calorimeter by injecting the persulphate solution (0.018 g dissolved in 1 ml of water). The reactor is a closed system with regard to the exchange of matter throughout the reaction. Polymerization was stopped about 30 min after no more heat production was detected by the calorimeter. All latexes were characterized regarding the solids content with a HR 73 Halogen Moisture Analyzer (Mettler Toledo, Gießen, Germany), and the average particle size by dynamic light scattering (Di – intensity weighted average particle size from the Gaussian analysis of solid particles) with a NICOMP particle sizer (model 370, NICOMP particle sizing systems, Santa Barbara, California, USA). Some samples were analysed by dynamic multi-angle laser light scattering with an ALV/SP-86 goniometer (ALV-Langen, Germany) with a red He–Ne laser (wavelength 633 nm). The parent and the polymerized microemulsions were filtrated through a filter with 0.45 and 5 μm pore size, respectively, before the measurements. The scattering data were evaluated in order to get the size distributions with the program ORT [43] that converts the amplitude autocorrelation functions into the corresponding distributions of the apparent hydrodynamic particle sizes with a special version of an inverse Laplace transform program. Note that the investigation of concentrated samples as microemulsion with dynamic light scattering is a challenging problem, as discussed in [44].
The aqueous surfactant solution, the initial microemulsions, and the final latexes were characterized with respect to liquid–vapour surface tension at room temperature by means of a TD1 tensiometer form Lauda (Lauda, Königshofen, Germany) with the Wilhelmi-plate method.
3.3.2 Procedure 2 (glass reactor A)
Polymerization was carried out in a 100-ml round bottom glass reactor equipped with heating jacket to control the temperature and a valve on the bottom to remove the latex. Stirring was performed with a Teflon coated stirrer bar. Conversion was followed gravimetrically by removing aliquots of the reactor content every 15 s. Particle size was measured with a Malvern 4700 light scattering apparatus. Each polymerization was repeated three times and average values of the solids content and particle size were used for further calculations.
4 Results and conclusions
4.1 Rate of polymerization
The heat flow–time curves depicted in Fig. 4 show the original calorimetric data obtained for various repeats of the microemulsion polymerizations (MEP-1, MEP-2, MEP-3). The advantage of reaction calorimetry is that the heat flow, which is a measure of the polymerization rate, is directly obtained and faulty numerical differentiation can be avoided. Furthermore, the heat flow signal is a result of processes taking place in the entire reaction volume. It reflects all events in the reactor, presupposed the heat transfer through the reactor jacket is quickly and doesn't change during the reaction. The heat flow (HF) corresponds directly to the polymerization rate according to Eq. (4):
| (4) |
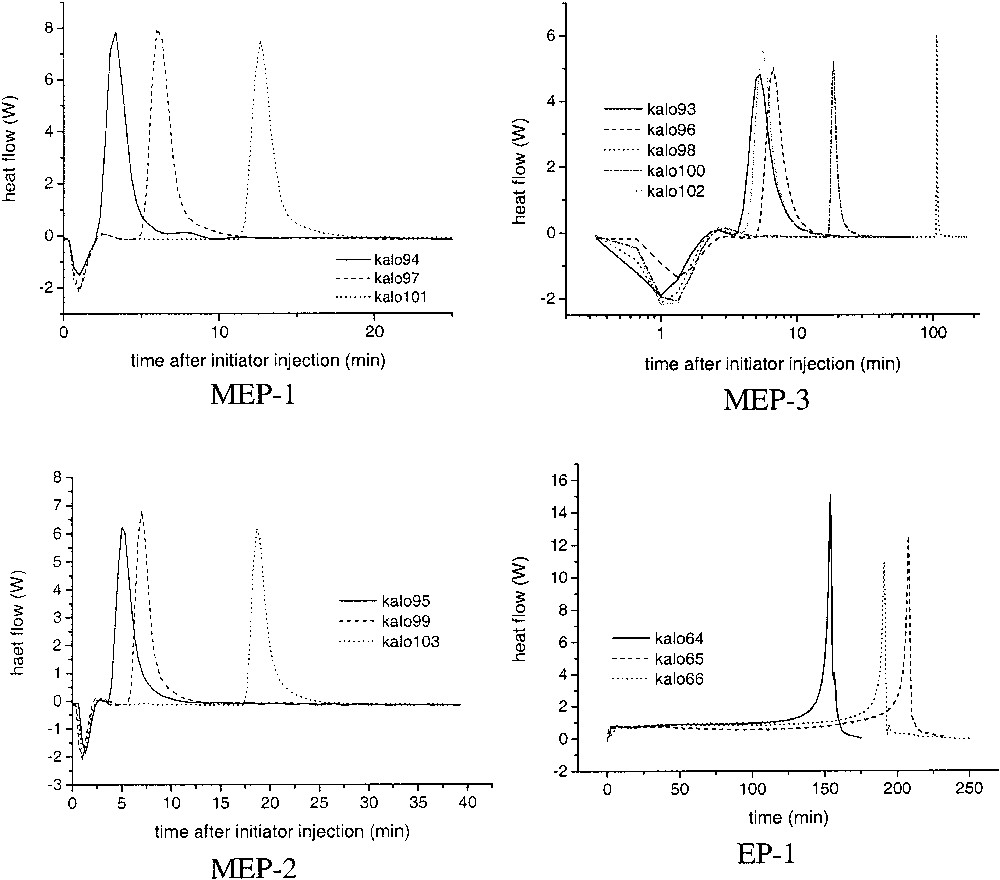
Heat flow–time curves for microemulsion polymerizations of butyl acrylate (MEP-1, MEP-2, MEP-3) and emulsion polymerizations of styrene. EP-1: 80 g of water, 20 g of styrene, 0.54 g of APS, 0.2 g of AOT (time axis starts from zero after thermal reequilibration after initiator injection, cf. text). MEP-1: MEP-2, MEP-3: cf. Table 4.
Statistic of incubation time in dependence on surfactant concentration. : average incubation time; sinc: standard deviation
| Recipe | (min) | sinc (min) | Repeats |
| MEP-1 | 5.9 | 4.1 | 4 |
| MEP-2 | 7.2 | 7.0 | 4 |
| MEP-3 | 26.5 | 44.3 | 6 |
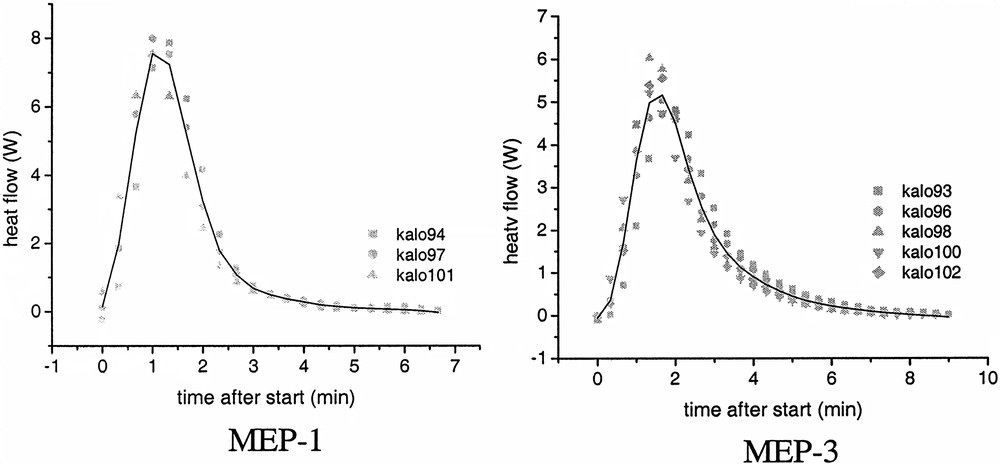
Individual heat flow–time curves for MEP-1 and MEP-3 (symbols) and averaged curves (lines).
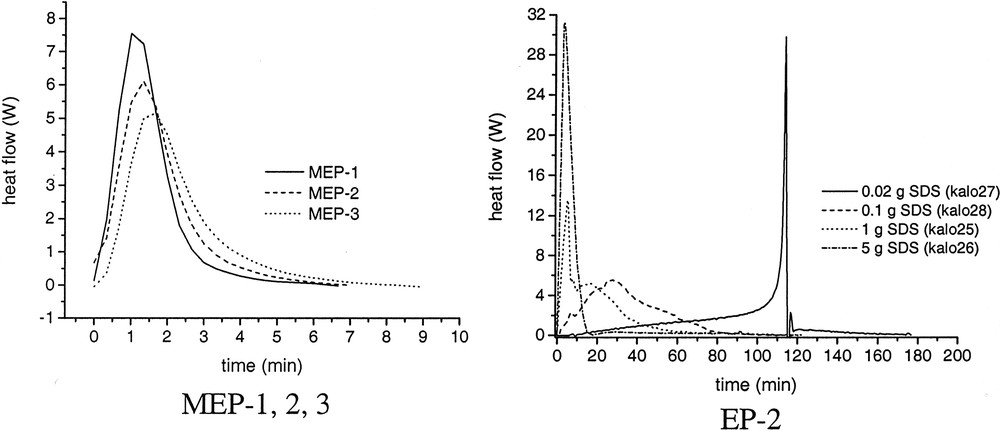
Influence of surfactant concentration on the rate of polymerization–time curves for microemulsion polymerization of butyl acrylate (MEP 1, 2, 3) and emulsion polymerization of styrene (EP-2). EP-2: 80 g of water, 20 g of styrene, 0.64 g of KPS, variable amounts of SDS. MEP-1, MEP-2, MEP-3: cf. Table 4.
Despite the occurrence of incubation times the reproducibility of the heat – flow time curves during the polymerizations is really good as it is shown exemplarily for MEP-1 and MEP-3 in Fig. 5. In these graphs the time axis is set to zero after the start of the reaction that is after a heat development was measured at the end of the incubation period. As soon as heat development was detected by the calorimeter the completely clear and transparent microemulsion becomes turbid indicating the formation of polymer particles. The shape of the curves is typical for microemulsion polymerization as it was observed also for other recipes by several authors (cf. [14,30,35,38]). The averaged HF–time curves of the microemulsion polymerization show a clear dependence on the surfactant concentration (Fig. 6), as it is also expressed by the numerical values summarized in Table 6. With increasing WS-values, the maximum of the heat flow is lower and is shifted to longer times (left graph of Fig. 6). For emulsion polymerization, the opposite behaviour is observed as illustrated in the right graph of Fig. 6. Increasing the surfactant concentration in normal (batch ab initio) emulsion polymerizations leads to a change in the shape of the HF-time curves and to a reduction in the overall polymerization time. This behaviour corresponds to the direct proportionality between rp and CS or N, as discussed in context with Eq. (3). At the highest WS-value for the emulsion polymerization, the shape of the curve is very similar to those of the microemulsion polymerizations, confirming the statement that there is a smooth transition from emulsions to microemulsions and from emulsion to microemulsion polymerization. All three, the stop of the heat flow at the end of the polymerizations, the solids contents of the final latexes given in Table 6, and the surface tension data (cf. Table 7 and discussion below) indicate complete conversion of the polymerizations. The values of the solids content are slightly higher than the theoretical ones obviously due to the water retention by the large amount of hydrophilic surfactants and the polymer film formed during heating. For the calculations, the particle numbers (cf. below) the polymer content was used which was obtained by subtracting the content of auxiliary materials from the solids contents. Despite this fact, the HF–time curves have been converted into conversion–time data. Fig. 7A shows the initial period of the conversion–time curves where two regions with regard to the rate of polymerization are clearly visible. This is a similar behaviour, as described by Kaler et al. [14] for the much more hydrophilic MMA as monomer, which he used to conclude that a two-state nucleation process operates, that is homogeneous nucleation during the early period characterized by a low rate of polymerization followed by nucleation in swollen micelles/monomer droplets causing an increase in the rate. At a glance, the results discussed so far with BA as monomer confirm this proposal. However, the observed dependence of the rates during the droplet or micellar stage of the nucleation (cf. inserted slope in Fig. 7A) contradicts this assumption as with increasing WS-values the droplet number increases (cf. data in Tables 1 and 2) and the probability that an initiator radical enters a droplet increases as well. Also, all the assumptions that particle nucleation in a particular microemulsion polymerization might occur via different mechanisms [14,35–37] should be considered suspiciously because for given polymerization recipe and temperature the thermodynamic conditions are fixed and there is no reason that the nucleation mechanism should change especially as the monomer concentration in the aqueous phase is constant over the entire range of increasing rate of polymerization. For hydrophobic monomers such as styrene experimental data can be explained reasonably well assuming nucleation inside the microemulsion droplet as sole mechanism [30–33]. As BA has an intermediate solubility in water, the question might be interesting how the experimental data can be explained with regard to nucleation. The polymerization reaction is very fast and the system is overloaded with surfactant so that the direct observation of the nucleation step as described in [47,48] is practically impossible. However, one might discuss particle nucleation based on rp-data in the following way. With the assumptions follows from Eq. (3) the relation , that is the initial change in rp corresponds directly to the change in the concentration of polymerizing particles. Fig. 7B shows how HF changes during the initial stage of the reaction. These data show that the acceleration of the polymerization or dN/dt is the higher the lower the emulsifier concentration. Note that this is the opposite behaviour compared with emulsion polymerization (cf. Fig. 6, EP-2, and [46] where the acceleration of the polymerization increases with increasing surfactant concentration. Thus, the experimental rp-data show that, for microemulsion polymerizations with high WS-values, the rate of particle formation during the initial stage of the polymerization is directly proportional to the ratio nMO/nS0 or to the number of monomer molecules per microemulsion droplet. These data already indicate that dN/dt depends in a different way on the emulsifier concentration for the emulsion and microemulsion polymerizations considered here.
Characteristics of HF–time curves of microemulsion polymerizations. Area: integral of the HF–time curve; HF,max–maximum HF-value; tmax: time for maximum HF-value; FG: solids content of the final latexes
| Recipe | Integral (W min) | HF,max (W) | tmax (min) | FG (%) |
| MEP-1 | 11.99 ± 0.4 | 7.80 ± 0.23 | 1.11 ± 0.19 | 7.30 ± 0.17 |
| MEP-2 | 11.78 ± 0.4 | 6.40 ± 0.36 | 1.22 ± 0.19 | 9.67 ± 0.48 |
| MEP-3 | 11.61 ± 0.4 | 5.33 ± 0.47 | 1.60 ± 0.28 | 12.34 ± 1.89 |
Liquid vapour surface tensions of the surfactant solutions (γlvSL), the parent microemulsions (γlvME), and the latexes after polymerization (γlvL)
| Recipe | γlvSL (mN m–1) | γlvME (mN m–1) | γlvL (mN m–1) |
| MEP-1 | 31.5 | 27.2 | 31.3 ± 0.3 |
| MEP-2 | 30.5 | 27.6 | 30.4 ± 0.2 |
| MEP-3 | 29.9 | 27.5 | 29.4 ± 0.2 |
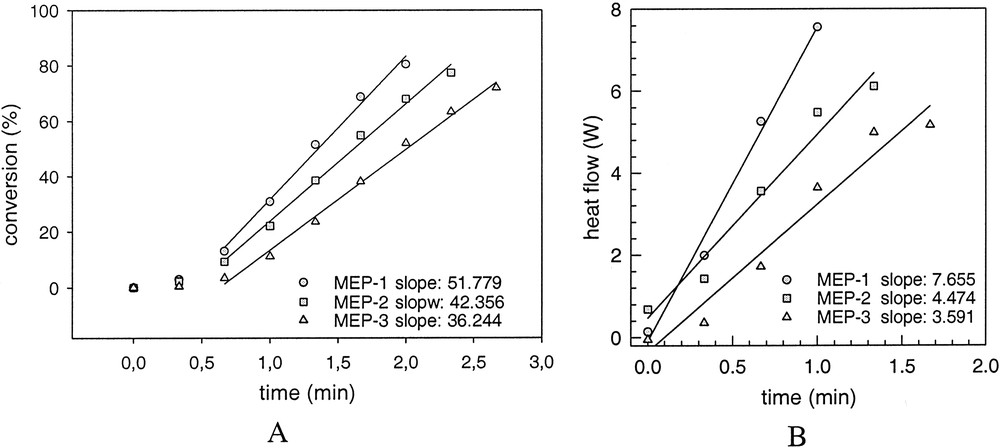
Initial rate (A) and acceleration (B) of microemulsion polymerization in dependence on surfactant concentration.
Finally, the rp-data obtained with the reaction calorimeter were confirmed by polymerization in a glass reactor with magnetic stirring where the progress of the reaction was followed gravimetrically by withdrawing samples from the reactor. The conversion time curves plotted in Fig. 8 show that the agreement between both data sets is really satisfying. In order to evaluate these results, it is necessary to consider that additionally to the kind of monitoring also the hydrodynamic conditions and the material combination in both reactors is different. For instance it is experimentally verified that for heterophase polymerization of MMA and styrene the kind of reactor material and the hydrodynamics has an influence on the polymerization results [49–51]. However, no incubation times have been observed for the polymerizations in the glass reactor. This is the only clear difference compared to the runs in the reaction calorimeter. At a glance this seems to be a strange results but an easy and straightforward explanation is given below.
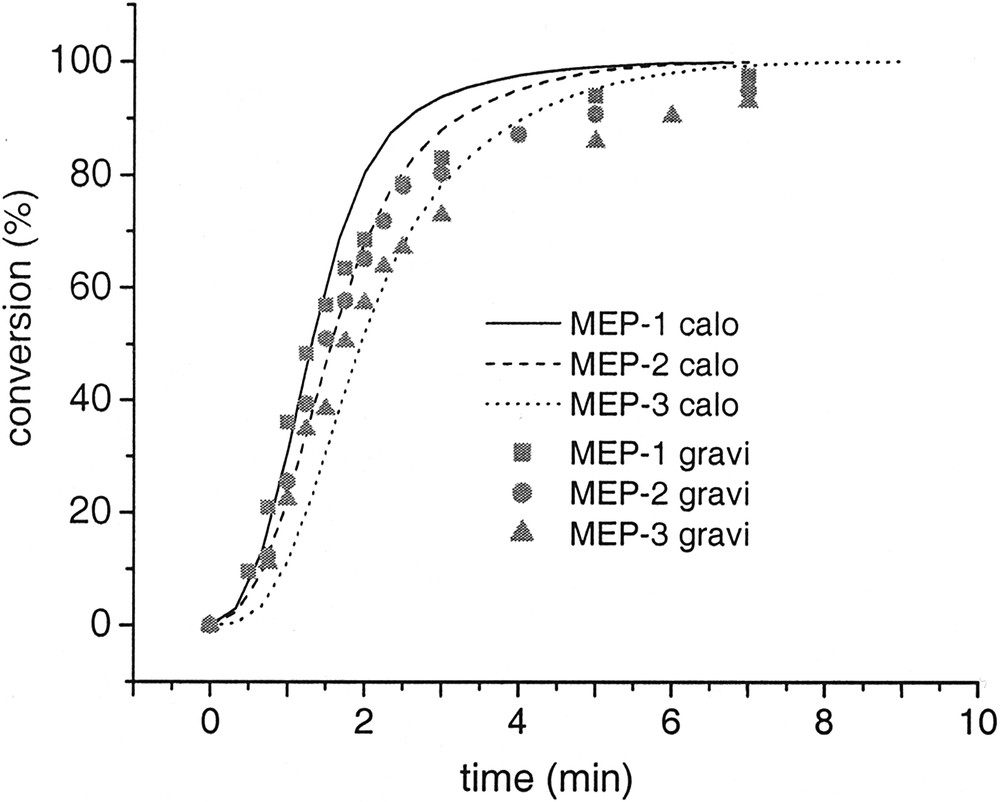
Conversion time curves for microemulsion polymerizations carried out in different reactors (lines: polymerization procedure 1 in reaction calorimeter and symbols: polymerization procedure 2 in glass reactor).
4.2 Colloidal properties
The colloidal characterization has been carried out by means of liquid–vapour surface tension measurements as well as dynamic light scattering of the parent microemulsions and of the final latexes. Especially the characterization of the parent microemulsions by dynamic light scattering is problematic due to the high concentration where interactions might influence the results (cf. [44] and references therein). Another difficulty may arise from the fact that the emulsifier concentration is in any case extremely high and hence, possible differences are only hardly to detect. Despite these problems some important conclusions can be drawn from the data as summarized in Tables 7 and 8 and depicted in Fig. 9 . Although the concentration of each component in the mixed surfactant system is in any recipe well above the critical micelle concentration the surface tensions of the neat surfactant solutions show a distinct dependence on the overall surfactant concentration. With increasing surfactant concentration the γlvSL-values decrease from 31.5 to 29.9 mN m–1 (cf. Table 7). Although this decrease is small it is significant and beyond the reproducibility of the measurements. The interfacial tension of the SDS / AOT mixture is obviously governed by AOT as the surface tension at the cmc is 38–39 mN m–1 for SDS and about 31 mN m–1 for AOT. Moreover, the surface tension for AOT decreases steadily with increasing concentration to about 25 mN m–1 at 10 g l–1 [52], whereas it remains almost constant beyond the cmc for SDS [53,54]. Upon adding the monomer, the surface tension decreases to values of some 27 mN m–1 almost independent of the surfactant concentration. This indicates that the liquid–vapour interface of the initial microemulsion is saturated with BA monomer, because these γlvME-values are in a typical range for acrylic acid ester monomers and close to that for BA (26 mN m–1) [55]. The surface tensions of the final latexes are exactly the same as those measured for the neat surfactant solutions even showing the same tendency in dependence on the surfactant concentration. Thus, the γlvL-values prove firstly, almost complete conversion of the monomer and secondly, the complete coverage of the particle water interface with surfactant and the existence of empty micelles. The coexistence of empty micelles and polymer particles in the undiluted final latexes is also confirmed by the results of dynamic light scattering investigations with the ALV apparatus at different scattering angles. The size distributions for all latexes show identical patterns as illustrated exemplarily in Fig. 9A for MEP-2. Three objects with different sizes can be identified. The largest objects are the latex particles with a size between 60 and 70 nm clearly depending on the surfactant concentration. The formation of these particles causes the observed change in the optical appearance from transparent to bluish turbid. Contrary, the size of the two smaller objects with 5 nm and with about 1 nm in diameter does not change with surfactant concentration (cf. also summary of the data in Table 8) leading to the supposition that these objects originate from the surfactant mixture whereby the larger objects at a median diameter of about 5 nm may be identified as empty micelles. Then, the smaller size is consistent with submicellar aggregates. It is to note, that Kaler et al. also observed scattering objects in a similar size range for microemulsions made with dodecyltrimethylammonium bromide and styrene before and after polymerization [44]. Fig. 9B shows that also for the systems investigated here the smallest objects are present in the parent, unpolymerized microemulsions and thus supporting the ideas of being submicellar aggregates of surfactant molecules. However, the initial microemulsions show two more peaks one at a median diameter of about 16 nm and the other at about 350 nm. The smaller of these peaks could correspond to swollen surfactant micelles. This supposition means that the mixed SDS/AOT micelles can imbibe about the 27-fold amount of BA relative to their unswollen volume. In order to explain the origin and the nature of the larger objects the following considerations might be useful. The presence of individual spherical droplets or other scattering objects in this size range can be excluded because of the fact that the dispersions appear completely transparent. However, the microemulsions are highly charged and no other ionic species than the surfactants are present. These conditions favour interactions among the individual structures leading to cooperative diffusion processes as it is also known for polyelectrolyte solutions. These so-called slow modes have been intensely investigated with dynamic light scattering for polyelectrolytes [56,57] but also for CTAB solutions at higher concentrations (10–2–0.5 M) [58]. Consequently, the apparent size is due to the cooperative motion of much smaller structures (microemulsion droplets) and does not represent the real dimension of particular structural units. However, a final decision with regard to the structure of the parent microemulsions investigated here is not possible at the moment. It needs further investigations especially if one argues that the slow mode should also be observed in the polymerized microemulsions, where similar conditions with regard to interactions can be assumed. Furthermore, the order of the frequencies (intensities) of the peaks as depicted in Figs. 9A and B is not easily to understand.
Particle sizes of the initial microemulsions (i) and the resulting latexes after polymerization (p) determined by dynamic light scattering
| Sample | Da, 1) (nm) | Db, 1 (nm) | Dc, 2) (nm) | |||
| MEP-1, i | 0.8–1.0 | n.d. | — | 337 | ||
| MEP-1, p | 0.9 | 5 | 59.6 | — | 65.1 ± 0.4 | 51 |
| MEP-2, i | 0.9 | 16 | — | 367 | ||
| MEP-2, p | 1.0–1.2 | 5 | 62.2 | — | 67.8 ± 0.7 | 62 |
| MEP-3, i | 0.9 | 16 | — | 344 | ||
| MEP-3, p | 1.0 | 5 | 68.8 | — | 72.4 ± 2.6 | 77 |

Size distributions as measured with dynamic light scattering (ALV apparatus) at different scattering angles of the undiluted final latex MEP-2 (A) and of the initial microemulsion (B); arrows indicating identified peaks in the size distributions and lines are just for guiding the eyes.
The particle size data summarized in Table 8 reveal that polymerizations in different reactors as well as size analysis with different light scattering equipments leads to similar results. Although the particular values for the particle sizes Da,1) (polymerization procedure 1, reaction calorimeter, ALV apparatus), Db,1) (polymerization procedure 1, reaction calorimeter, Nicomp particle sizer), Dc,2) (polymerization procedure 2, Malvern 4700 apparatus) show slight deviations the trend is the same, that is the particle diameters increase with increasing surfactant concentration.
As samples were withdrawn during the polymerization according to procedure 2, these data allow to illustrate the development of the average particle size and the particle number with conversion (Fig. 10A ) as well as the calculation of the rate of polymerization per particle (rpp = rp/N), as depicted in Fig. 10B. These data clearly show that nucleation of particles occurs during the whole duration of the polymerization and hence, N increases but the average size of the particles decreases. The overall rate of polymerization (rp) as illustrated by the heat flow curves (Figs. 6 and 7) and the rate of polymerization per particle depends in an opposing manner on the surfactant concentration or average particle size. Whereas rp increases with decreasing surfactant concentration or average particle size rpp decreases.
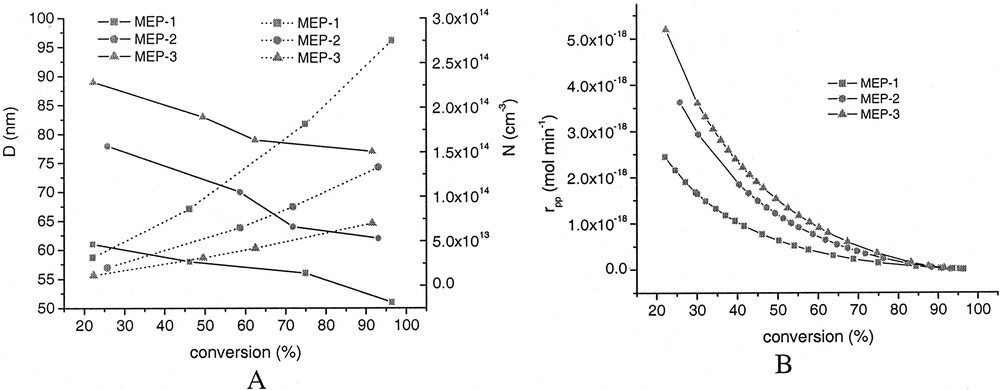
Development of average particle size (solid line, A), particle number (dotted line, A), and rate of polymerization per particle (rpp, B) with conversion.
In conclusion of this section, the analysis of the colloid-chemical properties of the microemulsions before and after polymerization reveals that the polymer particles are a new class of colloidal objects which are not present in the initial microemulsions. This means that the initial microemulsion of Winsor IV-type undergoes a change during the polymerization into an ‘ordinary polymer latex’ with the special feature that much more surfactant is present than needed for a complete coverage of the particle surface which itself is already much more than needed for colloidal stability. From the colloid-chemical point of view a polymerized microemulsion is characterized by the coexistence of latex particles, empty micelles, and submicellar surfactant aggregates.
5 Discussions and explanations
The most astonishing experimental results of the particular type of microemulsion polymerization investigated are the occurrence of incubation times before a heat flow can be detected by reaction calorimetry, the decrease in the rate of polymerization, and the increase in the average particle size with increasing surfactant concentration. These results are in contradiction with the expected behaviour, as it is experimentally observed in normal emulsion polymerizations. For instance, for the data depicted in Fig. 6 for EP-2 no incubation times have been observed and the average particle sizes (Di) are 614, 90.2, 43.1, and 31.1 nm for SDS concentrations of 0.02, 0.1, 1, and 5 g per run, respectively.
The nM0/nS0-values are the key for an understanding of the opposite results obtained for both kinds of heterophase polymerizations. These values are for the emulsion polymerizations EP-2 between 11 at lowest and 2.8 × 10³ at highest but for MEP-1, MEP-2, and MEP-3 (taking into account both SDS and AOT) the corresponding values are 0.99, 0.66, and 0.49, respectively. Under these circumstances the distribution of the monomer in the initial microemulsion plays a crucial role. Assuming the applicability of Eq. (1) and a droplet morphology as depicted in Fig. 2C, the hydrophobic core of an average microemulsion droplet of MEP-1, MEP-2, and MEP-3 consists of about 61, 72, and 80 volume-% of surfactant tails. This is an amazing high number and has some important consequences for particle formation and hence, the whole polymerization. A reasonable explanation goes back to ideas developed by Harkins more than 50 years ago when he investigated polymerization of monomers while in micelles by means of X-ray scattering experiments [59,60]. He found that styrene at saturation concentration increases the diameter of fatty acid micelles by 12 Å (styrene is present only as dissolved in water and solubilized in micelles but not as droplets) but upon polymerization initiated with persulphate the size of the micelles decreased to its initial value. This process could be repeated several times by consecutive swelling and polymerization until the surface of the polymer particles was grown so large that the soap concentration decreased due to adsorption on the particles below the cmc. These results led to the important conclusion that a growing polystyrene chain is incompatible with the alkyl chains in the interior of micelles and hence, polymer chains have a tendency to grow out of micelles. The incompatibility between polystyrene and alkyl chains was repeatedly proved more than 50 years later when it was tried to polymerize the monomer inside double layers of dioctadecyldimethyl-ammonium bromide vesicles. Transmission electron microscopy pictures reveal that phase separation takes place during the polymerization in a way that the polystyrene molecules gather at a particular place whereas the monomer was uniformly distributed over the whole bilayer [61]. In contrast to liquid oils, the incompatibility between surfactants and polymers is a general property and also a necessary requirement for the ability of surfactant effectively to stabilize polymer particles otherwise they would be buried inside the particles.
Considering the further fate of the escaped radicals two mechanisms of particle formation are possible. The first of these non-micellar theories of particle formation is known as homogeneous nucleation [62,63]. This theory, originally developed for more water – soluble monomers such as methyl methacrylate, considers precipitation of a single chain if it becomes insoluble in water at a critical chain length. The second possibility is called aggregative nucleation, according to which nucleation occurs when a critical supersaturation of growing or dead oligomers in the continuous phase is reached and this solution becomes unstable and separates into a polymer phase and a less concentrated continuous phase [64]. In contrast to so-called homogeneous nucleation the aggregative nucleation is a multi-chain process, which is governed by thermodynamic rules known from classical nucleation theory [65] or spinodal decomposition [66]. Basically, Harkins came to a conclusion, which completely agrees with aggregative nucleation mechanism when he stated [67], that in the absence of monomer droplets: “It is not improbable that several polymer molecules may meet each other and form a small aggregate as the source of a single particle.” Meanwhile experimental techniques are available which allow a direct observation of the nucleation step in emulsion polymerization [47,48,68,69]. The results obtained so far support clearly the aggregative nucleation mechanism and thus, prove that nucleation in heterophase polymerization can be considered and treated within the frame of general nucleation theories as bubble formation, or condensation, or crystallization processes. These theories can be applied to microemulsion polymerization as well and are the key to understand the astonishing experimental results. Accordingly nucleation requires to set up a supersaturation of the nucleating species, which in the particular case are the oligomers grown out of micelles.
For a given chemical composition of these oligomers and a given recipe the number of chains forming a nucleus depends mainly on the chain length in the way that it increases with decreasing chain length [64]. Surfactants assist with nucleation in the way that they lower both the interfacial tension and the free energy barrier thus, leading to faster nucleation [48]. However this influence should for microemulsion polymerizations with its high surfactant concentration only of very minor importance whereas the reduced monomer concentration in the droplets as main reaction loci influences the kinetics much more. The higher the amount of surfactant the lower is the monomer concentration and hence, the oligomers grow out of the drops / micelles with lower average chain length leading to longer prenucleation periods (average incubation times, cf. Table 5) as a higher number of them is needed to form a nucleus. A higher number of chains per critical nucleus mean larger nuclei. This explanation is in complete accordance with the experimental findings that the decrease of nM0/nS0 below a critical value leads to decreasing rate of polymerization and larger particles. Furthermore, under the conditions of microemulsion polymerization the emulsifier concentration is so high that all nuclei formed can be stabilized and can start to grow as individual particles.
Also the observed increasing scatter of the incubation times with increasing surfactant concentration (cf. Table 5) can be explained by means of classical nucleation theory. Within this frame any first order phase transition is blemished by a scatter of the times when it takes place after the supersaturation has been established. This incubation or lag time distribution is a direct expression of the statistics of nucleation [cf. 70,71]. The polymerization in the glass reactor where no incubation times have been observed differ from that in calorimeter by the sampling procedure, which makes the glass reactor practically to an open system also with regard to the exchange of matter. The sampling represents a perturbation of the prenucleation stage and may induce nucleation comparable with the effect that scratching on the wall of a beaker accelerates crystallization in supersaturated solutions. Thus, the high sampling frequency suppresses the occurrence of incubation times due to induced nucleation.
With regard to an explanation of the observed dependencies of the overall rate of polymerization and the rate of polymerization per particle on the surfactant concentration or average particle size the following considerations might be useful. The average number of radicals per particles () in Eq. (3) can be expressed by Eq. (5) if we assume in first approximation that kp and CMp or their change during the reaction is independent of the surfactant concentration. Here D is the average particle diameter, N the particle concentration and k1, k2 are constants.
| (5) |
| (6) |
| (7) |
| (8) |
According to Eq. (5), x is a number between 1 and 1.5. Finally result Eqs. (7) and (8) describing the dependence of the rate per particle (r′p,p) and the overall rate of polymerization (rp) on D, respectively. Note that between rp and r′p holds relation (11), that is r′p depends less strongly on D than rpp and moreover, r′pp is the right value to consider as rate of polymerization per particle because rpp, simply defined as rp/N (cf. Fig. 10B and [38]), still contains the dependence of on the particle number.
| (9) |
| (10) |
| (11) |
As x is between 1 and 1.5, but in any case larger than 0, r′p,p is expected to increase with increasing D, but rp is either independent of the particle size or increases with decreasing particle size. The experimentally determined relations at about 22% of conversion rp∝D− 0.61, rpp∝D+1.88, and r′p,p∝D+0.64confirm all of the derived dependencies.
In final conclusion, special features characterize microemulsion polymerizations at extremely high surfactant concentrations. The presented experimental study of BA microemulsion polymerizations confirms former results obtained by other authors for other monomers with respect to the dependence of both the overall rate of polymerization and the average particle size on the surfactant concentration but offers new explanations. All of the unusual features observed with increasing surfactant concentration such as increasing average particle size, decreasing overall rate of polymerization, and increasing incubation times can be explained within the frame of a particle nucleation model based on the classical nucleation theory.
Acknowledgements
One of the authors (A.G.R.) acknowledges a fellowship from the DAAD (Bonn, Germany). We are grateful to Mrs. U. Lubahn, Mr. S. Pirok, and Mrs. B. Schonert for preparative and analytical assistance. The authors are especially indebted to Prof. Dr. Markus Antonietti for numerous fruitful discussions as well for supporting this work and Dr. Reinhard Sigel for discussions concerning the results of the dynamic light scattering investigations. Moreover, the authors thank the Max Planck Society and the Max Planck Institutes of Colloids and Interfaces for the use of all the facilities and analytical equipment needed.