

1 Introduction
In recent years, nano- and microcrystals of organic molecules have attracted increasing interest in the field of materials science. Their chemical nature allows high variability and flexibility in their composition as well as in particle preparation. With a size considerably lower than that of bulk crystals, they exhibit a large proportion of surface molecules, and this characteristic feature is thought to govern many of their physical properties. Therefore, they find promising applications as luminescent probes for bioanalysis [1], as photocatalysts [2], and in the fields of photonics, non-linear optics and microelectronics [3].
However, studies on organic microcrystals are surprisingly few, especially concerning the production of free-standing microcrystals. In this respect, the reprecipitation method, widely developed in the recent years by Nakanishi's team, appears to be a simple and convenient way of preparation [4,5]. It is based on a solvent-exchange process. The compound is dissolved in a hydrophilic organic solvent, and this concentrated solution is poured into a large volume of water, which acts as a non-solvent. Precipitation occurs, which can lead to the formation of microcrystals. Since a major requirement for the practical use of microcrystals is the ability to grow structures of controllable size and morphology, several attempts have been made to achieve this goal through the reprecipitation method. It is now established that this process can be influenced by various factors, such as the concentration of the organic solution [4,6–8], the temperature [4,8–10], and the addition of small molecules that act as growth inhibitors [4,8,11–13].
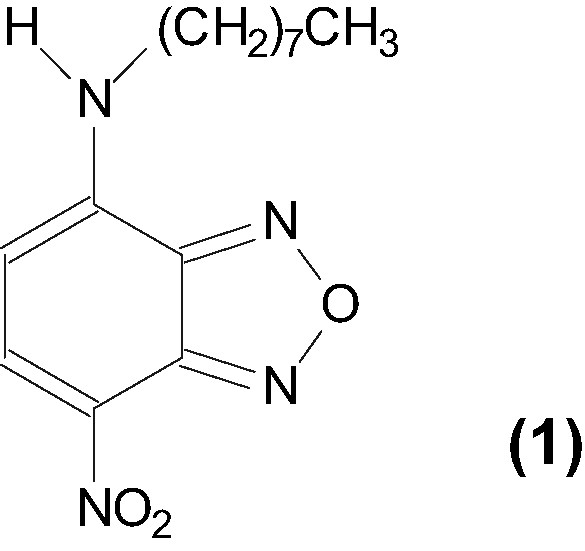
We recently showed for the first time that the shape and size of organic microcrystals could be nicely tuned by the presence of anionic dendrimers of the poly(amidoamine) series in the reprecipitation medium [14–16]. In the present work, we focused on whether dendrimers can be replaced by other macromolecules. To do so, linear polymers such as poly(acrylic acid) (PAA) and calf thymus DNA were used. We report their effect upon the reprecipitation of the organic compound already used in previous works [14,15]. The latter is 4-octylamino-7-nitrobenzoxadiazole (1, Fig. 1). Compounds of this type are excellent probes for UV/vis absorption and fluorescence spectroscopy [17,18]. We show here that different populations of microcrystals of 1 were obtained in a reproducible way by using linear polymers as additives. The UV/vis absorption and luminescence properties of these microcrystals in suspension are briefly reported.
2 Experimental section
2.1 Materials
Absolute ethanol was purchased from Carlo Erba Reagenti. Ultrapure water with a resistivity of 16 MΩ cm was produced using a Milli-Q apparatus (Millipore). The fluorescent dye 4-n-octylamino-7-nitrobenz-2-oxa-1,3-diazole (1) was prepared as described elsewhere [19], according to a variant of the synthesis reported by Heberer et al. [20]. PAA sodium salt (MW = 5100 g mol–1) was purchased from Aldrich. Calf thymus DNA, “highly polymerized” sodium salt, was from Sigma.
2.2 Apparatus
UV/vis absorption spectra were recorded on a Hewlett–Packard 8452A diode array spectrophotometer. The measurements were conducted at 25 °C in a thermostatted cell. Corrected steady-state fluorescence spectra were registered with a Photon Technology International (PTI) Quanta Master 1 spectrofluorometer. The size and shape of the microcrystals were observed with a Zeiss MC80DX fluorescence microscope. The objective contained lenses of × 40 or × 100 magnification, the eyepiece had a lens of × 2.5 magnification. The microscope was equipped with a standard camera. The excitation wavelength was 430–450 nm, and the emission wavelength was set at around 500–530 nm, by the use of adequate filters. To prepare the samples, a droplet of the suspensions used for spectroscopic measurements was deposited on a slide after precipitation had been achieved.
3 Results
3.1 Reprecipitation of 1 monitored by UV/vis spectroscopy
Compound 1 is hydrophobic, with a solubility limit as low as 4 × 10⁻⁷ M in aqueous solution containing 2% ethanol (v/v) [19]. It is not ionized in this medium [20], although it is strongly polar due to the donor character of the amino substituent and to the withdrawing effect of both the furazan and the nitro groups.
For reprecipitation experiments, 40 μl of a dye solution at 10–3 M in absolute ethanol was transferred to a quartz cell containing 1.96 ml of water, under continuous stirring. The final solution contained 2% ethanol (v/v) in water and 2 × 10⁻⁵ M dye, which makes the dye concentration 50 times higher than the solubility limit. The reprecipitation process of 1 in water alone was described previously [14]. After introduction of the dye, the aqueous solution was yellow. Then it was progressively discolored as the organic compound precipitated, and red agglomerated microcrystals were deposited on the stirrer. The whole process, monitored by UV/vis absorption spectroscopy, took about 1 h.
In the present paper, reprecipitation was first carried out in the presence of anionic PAA (average MW = 5100 g mol–1). The polymer was placed into water at a concentration of 5.9 × 10⁻⁵ M, that is 3.2 × 10⁻³ M in carboxylate groups. Then the ethanol solution of 1 was introduced, in the same conditions as before. The initial yellow solution was rapidly discolored, and the solution turned light pink. The reprecipitation process was drastically accelerated, since it was achieved within only 20 min. The UV/vis absorption spectrum showed strong variations (Fig. 2). Just after the introduction of the dye, the initial spectrum exhibited two bands. The first one, situated around 344 nm, corresponds to a π−π* transition, the second one with intense absorption at 476 nm, has been attributed to a charge transfer (CT) transition occurring between the donor and the acceptor groups of the molecule [21]. The position of these bands indicates that individual dye molecules are surrounded by an ethanol-rich environment. At the end of the reprecipitation process, the π−π* band and the CT band were, respectively, shifted to 364 and 496 nm, and their intensity was strongly decreased. Meanwhile, a new peak appeared at 546 nm. The baseline moved markedly upwards, due to the presence of particles in suspension that lead to scattering.
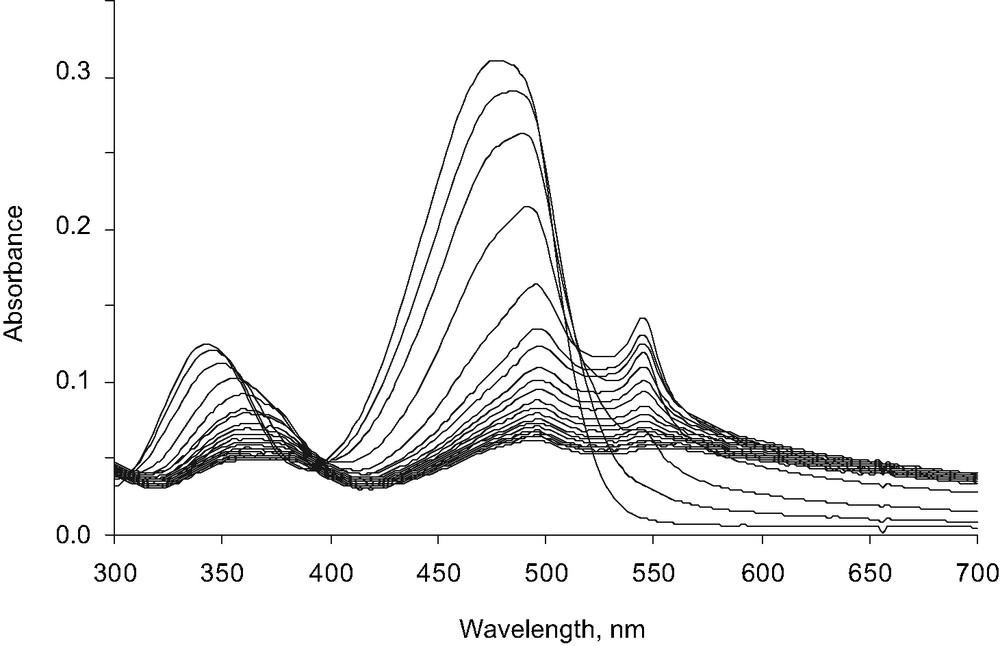
Evolution of the UV/vis absorption spectrum of 1 (2 × 10⁻⁵ M) in water containing 2% ethanol, during the reprecipitation process, in the presence of PAA sodium salt (MW = 5100 g mol–1) at a concentration of 5.9 × 10⁻⁵ M (3.2 × 10⁻³ M in carboxylate groups).
One measurement every 2 min.
To study reprecipitation in the presence of calf thymus DNA, a stock solution was prepared containing approximately 1 mg DNA per ml water. The precise concentration of the DNA was determined from the UV/vis absorption spectrum, using ɛ260 = 13200 M–1 cm–1 for one calf thymus DNA base pair (bp) [22]. The stock solution was then diluted so that the DNA concentration was 5.0 × 10⁻⁵ M bp. It can be noted that the DNA concentration was intentionally kept rather low, to prevent the medium from being too viscous. The concentrated solution of 1 in ethanol was added into it. The mixture lost its color twice as fast as when pure water was used. Almost not deposit was observed on the stirrer, and very small crystals, which made the solution blurred, precipitated slowly. When reprecipitation was complete, the UV/vis absorption spectrum showed three bands of weak intensity, with a maximum at 364, 496 and 546 nm, and a high baseline due to scattering. It is therefore very close to that of the suspension obtained in the presence of PAA.
3.2 Analysis of the suspensions by steady-state fluorescence spectroscopy
Steady-state fluorescence spectra were obtained on the suspensions after reprecipitation was completed. The total dye concentration was identical to before (2 × 10⁻⁵ M). For the two types of suspension, the emission spectrum was strongly dependent on the excitation wavelength. Let us consider, for example, the suspension obtained in the presence of DNA. When excitation was performed at 482 nm, the emission spectra displayed a wide peak centered on 578 nm, and a shoulder at higher wavelengths, around 668 nm (Fig. 3). When excitation was performed at 510, then at 545 nm, the main emission band got narrower, while the long-wavelength emission band became progressively more intense. It must be noted that when exciting above 570 nm, where absorption is still significant, emission was no longer detected. This means that the transitions above 570 nm do not lead to an emissive excited state. Conversely, the excitation spectrum varied with the emission wavelength. When emission was set at 540 nm, the excitation spectrum only displayed a strong band peaking at 484 nm. For high wavelength emissions, the main band of the excitation spectrum moved slightly to the red, and a second band appeared, centered at 546 nm.
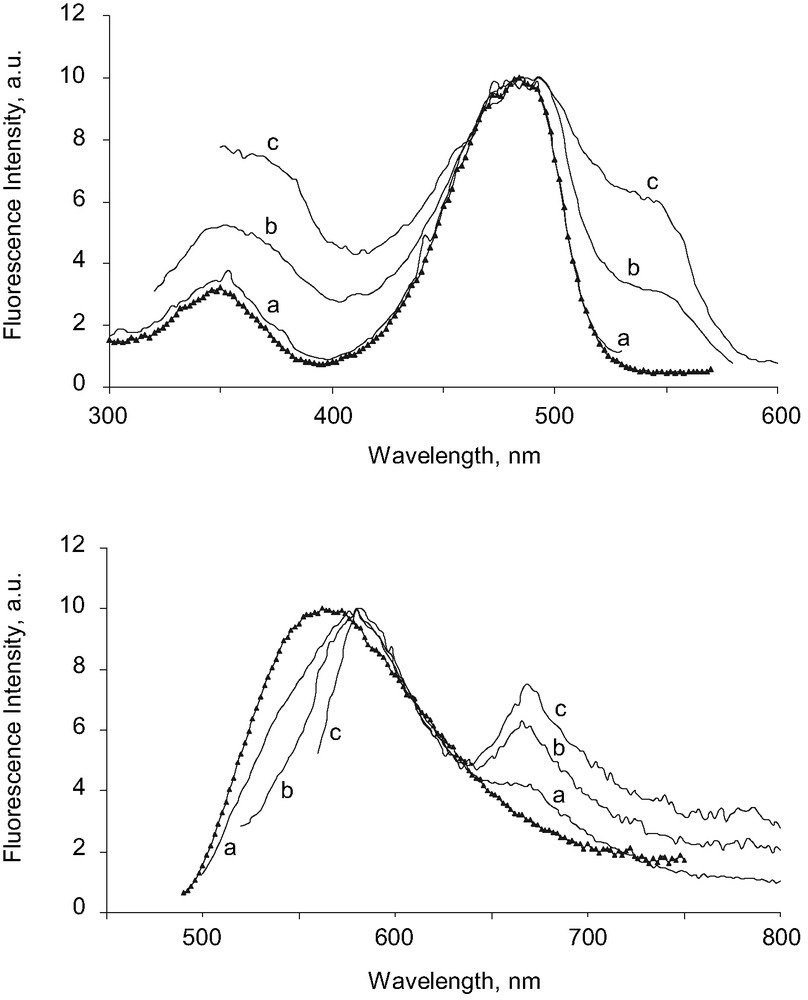
Top: Excitation spectrum of dissolved dye 1 (1.5 × 10⁻⁶ M), in water containing 2% ethanol (triangles); λem = 580 nm.
Excitation spectrum of a suspension of microcrystals of 1 (2 × 10⁻⁵ M) grown in the presence of calf thymus DNA (5 × 10⁻⁵ M) in water containing 2% ethanol (plain lines); λem = 540 nm (a), 600 nm (b), 680 nm (c). Bottom: For the same samples, emission spectrum of dissolved dye 1 (triangles); λex = 480 nm. Emission spectrum of the microcrystal suspension (plain lines); λex = 482 nm (a), 510 nm (b), 545 nm (c). All the spectra are normalized.
This behavior indicates the presence of several emitting species. One possibility is that these species are actually distinct populations of dye molecules, each experiencing a different environment. According to their location in the microcrystal, the strength of the interaction of the dye molecules with their neighbors may vary. The dye molecules may be in contact with water molecules or not. In organic solids, it is commonly accepted that emission arises from Frenkle-like excitons, that is excitation is localized on individual molecules. Stabilization depends on the interaction of the excited molecule with its crystalline surroundings [23].
For the sake of comparison, the excitation and emission spectrum of 1 dissolved in water with 2% ethanol was also given in Fig. 3. It must be noted that these spectra were recorded for a concentration of 1 higher than the solubility threshold, but in these conditions, precipitation is slow enough not to disturb the measurement. For the dissolved dye, the emission spectrum did not depend on the excitation wavelength and conversely, the excitation spectrum did not depend on emission, and was identical to the absorption spectrum. It can be noted that the emission spectrum of the dissolved dye is situated at shorter wavelengths than that of the microcrystal suspension. In contrast, the excitation spectrum of the dissolved dye was very close to the excitation spectrum of the microcrystals, when excitation was performed at 480 nm. This means that in the microcrystal suspension, some emitting molecules display the same spectral features as the dissolved dye, while other molecules show a totally different behavior.
3.3 Analysis by fluorescence microscopy
The suspensions were observed by fluorescence microscopy, at the end of the reprecipitation process. The particles grown in the presence of PAA (5.9 × 10⁻⁵ M, that is 3.2 × 10⁻³ M in carboxylate groups) were small rectangular structures displaying an X-shape pattern at the center. They were very flat and emitted yellow luminescence (Fig. 4, left). Three populations were distinguished, with sizes of about 40 × 15, 15 × 8, and 4 × 2 μm for the two largest sides. These particles are similar to the microcrystals grown in the presence of dendrimer. For the particles grown in the presence of DNA, two populations can be observed. Some are small rectangles (4 μm × 1 μm), emitting yellow light. Other rectangles were about 20 μm long. Their body emits green light, while orange–red light arises from the two small extremities (Fig. 4, right). This type of microcrystal had not been observed previously.
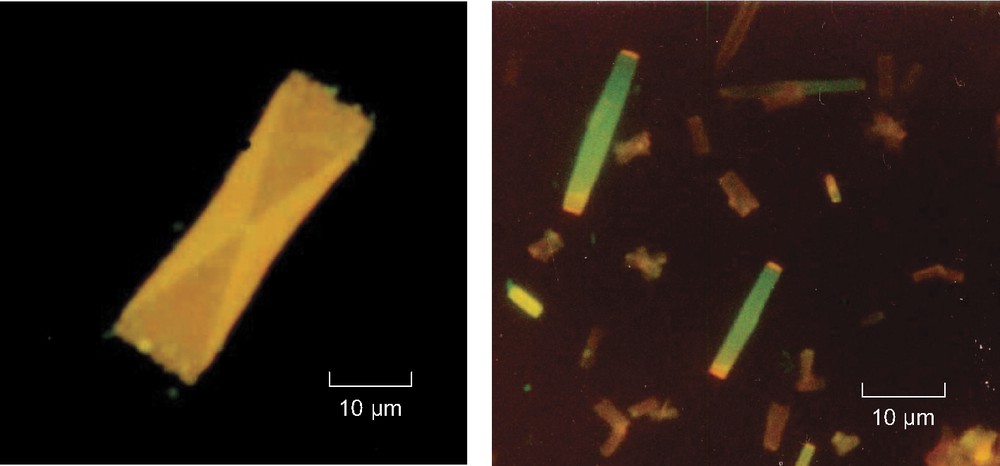
Fluorescence microscopy image of microcrystals of 1 grown in the presence of PAA sodium salt (5.9 × 10⁻⁵ M, that is 3.2 × 10⁻³ M in carboxylate groups) (left) and calf thymus DNA (5.2 × 10⁻⁵ M bp) (right).
Total dye concentration: 2 × 10⁻⁵ and 4 × 10⁻⁵ M, respectively.
4 Discussion
Whether reprecipitation was carried out in the presence of PAA or in the presence of calf thymus DNA, an acceleration of the kinetics was observed, and non-agglomerated microcrystals were produced. This is strongly reminiscent of what was observed in the presence of dendrimers [14]. From this viewpoint, high-cost dendrimers can be advantageously replaced by other macromolecules. But, the exact role played by the additive is still an open question. We showed in a previous work that the acceleration of the reprecipitation process is linked to the presence of macromolecules. It is not encountered with small molecules, for example sodium acetate, although they generate an identical ionic strength. One of our working hypotheses is that the presence of macromolecules induces a local increase in dye concentration. This could accelerate the nucleation process, which is in line with our observations, and could explain the presence of numerous small microcrystals. Moreover, during our work with dendrimers used as additives, we provided evidence that some additive remained fixed to the microcrystals. It is very likely that the additive mainly interacts with the microcrystal surface. This could explain the fact that microcrystals grown in the presence of additive are prevented from agglomeration, and that they display a characteristic shape, since crystal growth is impeded by the adsorption of the additive, which is at the origin of steric shielding.
5 Conclusion
As said above, some common points were observed here for reprecipitation carried out in the presence of PAA and calf thymus DNA. The acceleration of the reprecipitation process was already mentioned, and close similarities were also found between the spectroscopic characteristics of the suspensions obtained. However, some differences were also noted, for example in the morphology of the microcrystals produced. Future work concerning for example the kinetics of reprecipitation and the analysis of the microcrystal surface properties will allow a better comparison of the two systems. Moreover, it must be noted that the measurements were performed here on microcrystal suspensions, so they give average values. Studies are presently underway using near field spectroscopy, which focus on one isolated microcrystal or on part of a microcrystal. They should provide much more information about the luminescence properties of the microcrystals, some of them seeming quite unusual. This is particularly interesting for subsequent applications, knowing that the method allows microcrystals to be obtained in a very reproducible way.
Acknowledgements
We are very grateful to NATO for financial support of Dr. Liliana Bîrlǎ.