

1 Introduction
The important role of magnetic resonance spectroscopy (MRS) has been demonstrated in many neurological studies, for example, in monitoring the effect of therapies and in diagnosing major diseases including Alzheimer's, Parkinson's diseases, dementia and cancer [1–4]. Using short echo-time localization pulse-sequences to investigate mouse brains, the observation of metabolites with short spin–spin relaxation decay constants is possible. However, quantitation of the corresponding spectra is difficult. Three major problems are encountered: (1) strongly overlapping metabolite resonances (many hundreds); (2) low signal-to-noise ratio (SNR) due to the small size of the mouse brain (voxel size of (2.5 mm)3) and the limited acquisition time; (3) a broad, partially known background component originating mainly from macromolecules and lipids that overlaps the metabolite peaks. Fitting of time or frequency-domain model function to such low-SNR in vivo data requires extensive prior knowledge. The latter can be provided from measured signals/spectra of selected metabolite aqueous solutions used as numerical time/frequency domain model functions as done in QUEST [5,6] and LC-Model [7], respectively.
As few papers focus on quantitation of healthy mouse brain metabolites, we investigated the central region of the brain containing the striatum and thalamus of eight healthy mice. In this paper, we report the mean values of the estimated metabolite concentrations. In vivo short echo-time healthy mouse brain signals were acquired at 7 T. Quantitations were performed using the time-domain method QUEST and an in vitro metabolite signal basis set. The reliability of our concentration estimates was assessed using the Cramér-Rao lower bounds (CRBs), which reveal the quantitation precision.
2 Method
Healthy mice (Swiss, 25–30 g in weight, 3-month-old) were anesthetized by inhalation of isoflurane (Abbott Laboratories, Rungis, France) with 2.5% concentration in a mixture of 50% oxygen and 50% nitrous oxide. The body temperature was maintained at 37 °C by warm water circulation, monitoring of respiratory cycle was performed using an air pillow. Experiments were conducted according to the procedures approved by the institutional animal care and ethical committee of our University.
The experiments were performed on a 7 T Biospec BRUKER system – ANIMAGE platform, Lyon, France, equipped with a gradient coil (12 cm diameter, 400 mT/m max amplitude, 80 μs rise time). A birdcage coil (72 mm inner diameter) for excitation and a receiver surface coil (15 mm diameter) were used. All first- and second-order shim terms were adjusted using FASTMAP [8] for each voxel of (2.5 mm)3 positioned in the striatum and thalamus region. The water signal was suppressed by variable power RF pulses with optimized relaxation delays (VAPOR) [9]. Outer volume suppression combined with a PRESS sequence (bandwidth of 4 kHz, 4096 complex points, 128 averages, TR = 5 s, TE = 20 ms, acquisition time of 11 min) was used for localization. Eddy current compensation and static magnetic field drift correction were applied during the acquisitions.
Quantitations were performed with QUEST combined with the ‘Subtract’ approach for background modeling [5] and an in vitro metabolite signal basis set was used as prior knowledge in the parametric estimation of the in vivo metabolite signals.
To set up the in vitro metabolite basis set, eleven metabolite solutions were prepared. Aspartate (Asp), creatine (Cr), choline (Cho), γ-aminobutyric acid (GABA), glucose (Glc), glutamate (Glu), glutamine (Gln), N-acetylaspartate (NAA), taurine (Tau), lactate (Lac) and myo-inositol (Ins) (Sigma–Aldrich) were dissolved separately in aqueous solutions (100 mM, pH = 7.0 ± 0.1, 10 ml). Trimethylsilyl-propanesulfonic acid sodium salt (DSS) and sodium formate were added as chemical shift references. It is essential that the eleven in vitro signals be measured using identical acquisition parameters as the in vivo ones, and the same conditions of pH and temperature that exist in the mouse brain. The metabolite basis set used is displayed in Fig. 1.
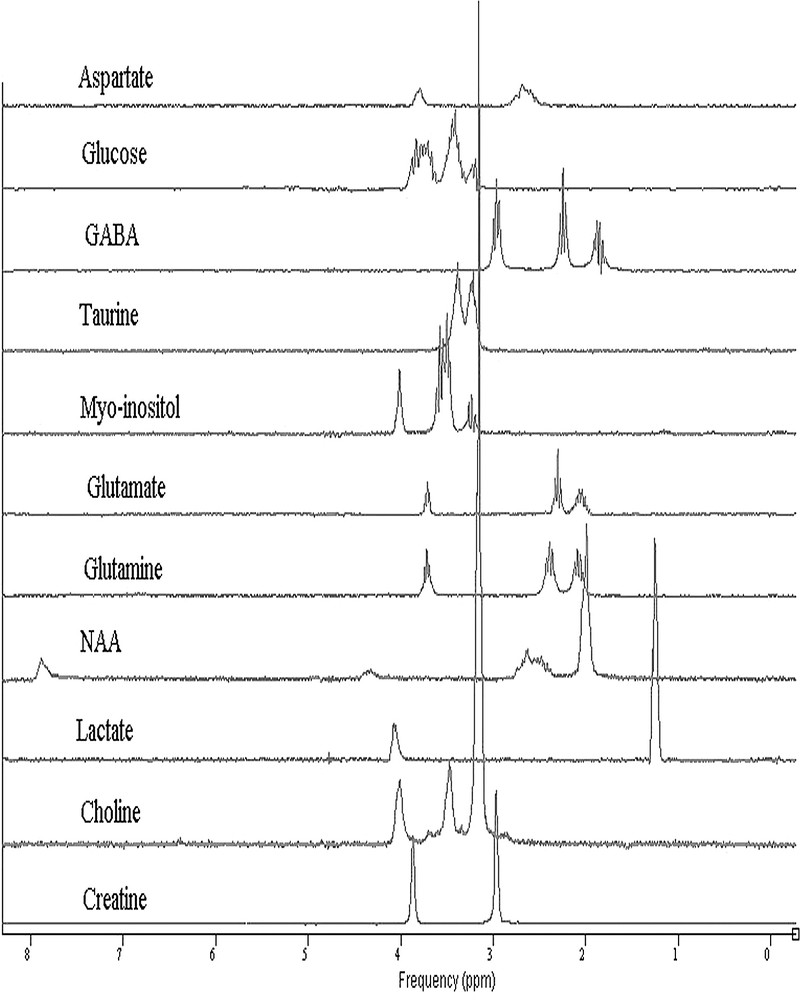
Fourier transform of the metabolite signal basis set, acquired in vitro at 7 T with a PRESS sequence (bandwidth of 4 kHz, 4096 complex points, 128 averages, TR = 10 s, TE = 20 ms).
3 Results
Eight mouse brain signals were analyzed using the jMRUI software [10,11]. Removal of residual water components of the in vivo and in vitro signals was performed in a preprocessing step using the Hankel–Lanczos Singular Value Decomposition algorithm – HLSVD (25 spectral components were used for modeling). In the quantitation step, the number of truncated initial data-points, which is an important parameter for background removal in the ‘Subtract’-QUEST method, was equal to 20–25 (corresponding to a duration of 7 ms). The zero-order phase and the dead time were fixed to zero. A jMRUI window displaying the quantitation results obtained for an in vivo mouse brain signal acquired from the striatum region is shown in Fig. 2. The background signal (dashed line) is well modeled; both lipid resonances (0.9 and 1.3 ppm) and the three principal resonances of macromolecules (around 2, 3 and 3.9 ppm) are well identified.
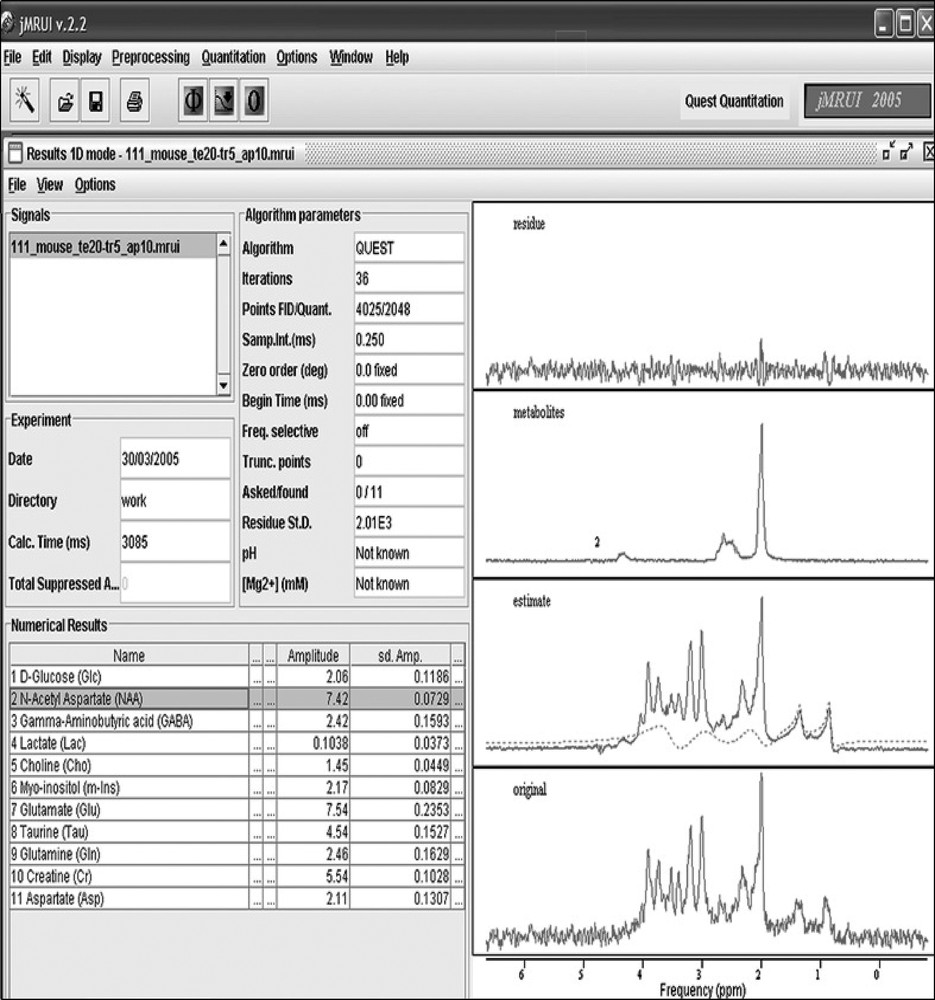
jMRUI QUEST Quantitation result window. From bottom to top, original spectrum of an in vivo mouse brain acquired at 7 T from the striatum and thalamus region using a PRESS sequence with an echo-time of 20 ms; estimated spectrum and background (dashed line) using QUEST and an in vitro metabolite signal basis set; selected metabolite (NAA) spectrum; and residue.
Most of the eleven metabolites were successfully quantitated. The reliability of metabolite quantitation is assessed using the CRBs. These bounds were below 15% of the estimated amplitudes for most of the metabolites of the eight signals (Table 1).
In vivo mouse brain metabolite concentration estimates and confidence intervals, and Cramér-Rao bound ranges given in percentage, obtained from eight signals. Published metabolite concentrations from biochemical rat brain assays and from quantitation of in vivo rat brain spectra using LC-Model are also displayed for comparison. *Only Cr was included in the metabolite basis set
| Metabolite | This study | Literature | ||
| Mean ± S.D. (mmol/kgww) | CRB range (%) | Biochemical rat brain assays (mmol/kgww) | In vivo rat brain value ± S.D. (mmol/kgww) | |
| NAA | 6.88 ± 0.76 | 0.9–1.3 | 4.7–9 | 8.3 ± 0.5; 7.7 ± 1 |
| Cho | 1.6 ± 0.37 | 1.8–3.2 | – | 0.7 ± 0.1; 1.1 ± 0.05 |
| tCr (Cr + PCr)* | 4.73 ± 0.9 | 1.0–2.0 | 8.5–9.7 | 7.78; 8 ± 0.4 |
| Ins | 1.96 ± 0.39 | 2.6–5.2 | – | 4.08 ± 0.5; 3.7 |
| Tau | 4.38 ± 1.06 | 1.9–3.3 | 1.66–6.6 | 4.25 ± 0.59 |
| Glu | 5.16 ± 0.98 | 3.0–4.1 | 7.4–12.5 | 8.67 ± 0.7; 8.1 |
| Gln | 2.45 ± 0.87 | 4.8–11.2 | 2.1–5.6 | 1.25 ± 0.3; 3.5 |
| Glc | 1.37 ± 0.35 | 5.0–15.4 | 0.96 | 2.7; 3.5 ± 0.4 |
| Asp | 1.6 ± 0.73 | 0.8–3.9 | 1.5–2.7 | 1.43 ± 0.4; 1.2 |
| GABA | 2.95 ± 1.02 | 2.1–6.5 | 0.8–2.3 | 1.1 ± 0.25; 1.1 |
The mean values and the corresponding standard deviations of the estimated metabolite concentrations reported in Table 1, were computed from the relevant concentration estimates of the eight signals.
QUEST automatically and partially compensates for the spin–spin relaxation effects. The in vivo signals weighted by is modeled by a weighted sum of in vitro metabolite signals weighted by where and correspond to the in vivo and in vitro relaxation times of the considered metabolite respectively, and TE is the echo time. If and of each spectral component are known [12], the difference between the in vivo and in vitroT2 effects can be corrected by multiplying each estimated concentration by . These corrections (below 10%) were not taken into account in this study.
The mean values of the estimated metabolite concentrations are displayed in mmol/kgww in Table 1, assuming that the mean water tissue concentration is 43.7 mol/l [13]. The confidence intervals corresponding to one standard deviation are also reported in Table 1. Since few studies focused on quantitation of the mouse brain metabolites, published rat brain metabolite concentrations are also displayed in Table 1 for comparison. These reported values were estimated from biochemical rat brain assays [15] and from quantitation of in vivo rat brain spectra using LC-Model [14,15].
Our estimated metabolite concentrations are in good agreement with the biochemical rat brain assays published values, except for tCr and Glu. We emphasize that for the latters the estimated CRBs on the concentrations are below 5%. Moreover, the estimated concentrations of NAA, Cho, Gln, Glc, Tau, Asp, GABA are in good agreement with the reported concentrations in rat brain. Quantitation of weakly represented metabolites, such as Lac, is not significant.
4 Conclusion
- • In vivo 1H signals of healthy mouse brain were measured at 7 T from the striatum and thalamus region and quantitated using QUEST combined with an in vitro metabolite basis set.
- • Metabolites are well identified. The reliability of the reported concentration estimates of the main metabolites was assessed using the CRBs. Our in vivo metabolite concentration estimates are in good agreement with the values from the literature.
- • The estimated concentrations partially take account of T2 relaxation effects. The corrections of the difference between in vivo and in vitro effects (below 10%) were ignored in this study.
- • Estimated concentrations of weakly represented metabolites (Lac, Asp) are not reliable due to the overlapping resonances and macromolecules. For better quantitation, more prior knowledge is necessary.
- • Background signals from macromolecules and lipids are well modeled.
- • The differences between the metabolite concentration estimates of this study and the literature may be explained by the different experimental conditions (shim, sequence, voxel size) and data processing used.