

1 Introduction
Over the past decades, the crucial role of internal dynamics for the function of a protein has emerged and has motivated many studies. Beyond the well-known structure–function relationship, there is compelling evidence that internal motions in proteins take part in their mechanism of action at the atomic level. The issue of the relationships between structure and mobility therefore arises, and has been tackled in various ways [1–3].
Nuclear magnetic resonance (NMR) has proven to be a unique tool to provide detailed descriptions of internal motions in proteins, and a vast NMR panoply of techniques, relying mainly on spin relaxation measurements, has been developed to access internal mobility in proteins over time scales ranging from picoseconds to milliseconds. Fast motions on the sub-nanosecond time scale involve rotations, vibrations and librations of chemical bonds, and can be related to conformational entropy and other thermodynamical quantities [4,5]. For instance, binding with a ligand or another macromolecule may be associated not only with a local reduction of conformational degrees of freedom in the vicinity of the interaction site [4,5], but also with an increase of entropy in remote parts of the protein, possibly leading to a global favourable entropic contribution to binding [6,7].
Spin relaxation is essentially caused by molecular motions [8–10]. In an attempt to interpret and predict NMR relaxation experiments, we have recently developed an NMR-oriented model for internal protein dynamics, based on a Network of Coupled Rotators (NCR). In this model the protein is represented by an assembly of vectors (defined by selected chemical bonds) that undergo rotational diffusion in a harmonic potential. This potential is defined as a superposition of pair potentials that couple the network vectors to each other and can be thought of as resulting from the combination of various physical interactions (electrostatic, van der Waals, etc.). One of the main features of this approach is that the potentials only depend on the deviation from equilibrium of angles subtended by pairs of vectors, rather than on the position of atoms. In this sense, it is NMR-adapted, as it depends on the orientation of vectors. In previous studies, we have demonstrated the ability of this simple model to predict parameters obtained from NMR relaxation experiments, in particular the so-called generalized model-free order parameters S2 and effective correlation times [11,12]. In this article, we extend our previous findings and demonstrate that the NCR approach allows one to predict NMR relaxation rates.
2 Brief outline of the theory
In the NCR approach, each member of an ensemble of bond vectors ui is assumed to undergo a diffusional “wobbling” motion in a potential that results from the superposition of coupling potentials Uij between pairs of vectors ui and uj such that the angle θij between them fluctuates about an equilibrium value defined by the (average) equilibrium structure of the protein. The shape of the coupling potential Uij is thus like a well with a minimum at :
| (1) |
The calculation of the amide 15N NMR relaxation rates of a residue i in a protein requires the knowledge of the Fourier transforms Jii(ω) of the auto-correlation functions Cii(t), if we neglect interference effects [15]. The longitudinal and transverse 15N relaxation times, R1 and R2, and the 15N{1H} heteronuclear Overhauser enhancement factors (ηNH) are given by:
| (2) |
| (3) |
| (4) |
| (5) |
| (6) |
| (7) |
| (8) |
3 An example: 15N relaxation rates of apo-calbindin
In this section, we focus on the case of the calcium-binding protein calbindin and compare our predictions with experimental measurements [18] performed on the apo-form of the molecule [19]. Calbindin D9k contains two EF hand motifs composed of helix–loop–helix sequences. Each of these motifs can accommodate a calcium ion Ca2+. It was shown that in the absence of calcium, both these loops and the linker region between the EF hand motifs exhibit higher mobility than the rest of the protein, as attested to by lower model-free parameters S2 [18]. This feature can be predicted by the NCR model [13,14]. We will be concerned here with the prediction of experimentally observed R1, R2 and 15N{1H} NOE relaxation rates, rather than variables such as order parameters or effective correlation times that are meant to approximately model the spectral density functions as Lorentzians. Relaxation of amide 15N nuclei is mainly driven by the dipolar interaction and by 15N chemical shift anisotropy (CSA), and interference effects will be disregarded in the following.
For dipolar relaxation, the relevant correlation function is the one involving the vector defining the amide NH bond. In addition, the same correlation function will describe CSA relaxation in this case, as the principal axis of the (axially symmetric) 15N CSA tensor is approximately colinear to the NH bond.
Thus, implementing the strategy described in our previous work, the equilibrium values V(0) were calculated, and using Eqs. (3)–(8), the correlation functions involved in backbone 15N dipolar and CSA relaxation were predicted. The network was defined using four types of vectors: NH, CαHα, CβCγ (or any other heavy atoms located at this position in the residue) and terminal vectors of lateral chains (LEU: Cγ–Cδ1 and Cγ–Cδ2; MET: Sδ–Cε; GLU: Cδ–Oε1; GLN: Cδ–Oε1; LYS: Cε–Nζ; ARG: Cζ–Nη1; TYR: Cζ–Oη). Global parameters were adjusted to the following values: Rc = 6.5 Å, κ0 = 2, and D = 2.08×10⁸ rad2 s−1. The overall tumbling is described by a characteristic time τg = 4.1 ns obtained from the ratios R2/R1 of experimental relaxation rates [18]. Numerical values of ΔσN = 160 ppm for the 15N CSA and rNH = 1.02 Å for the 15N–1H distance were used. After numerical Fourier transformation of Cii(t) giving the spectral density functions , the rates , for the N residues of the protein, were obtained.
Results are presented in Fig. 1. Relaxation rates were calculated for the set of M = 33 structures of apo-calbindin deposited in the Protein Data Bank [19]. The structural differences amongst this set of structures are responsible for the different values of the predicted rates. Thus, for each residue i in the sequence, a predicted relaxation rate averaged over the set of structures, , with Γ = R1, R2, ηNH, was obtained. The comparison with experiment was achieved by computing rank order (Spearman) ρs and linear ρl correlation coefficients [20], as well as the root mean square deviation . The results are quite satisfactory, with values of ρs and ρl ≈ 0.8, as shown in Table 1. However, there are clear discrepancies between predicted and experimental transverse relaxation rates, attested to by significantly lower values of ρs and ρl. A model-free analysis of experimental relaxation rates [18] has shown that there is an exchange contribution Rex to the apparent experimental R2exp for a number of residues. Adding this contribution to the predicted and comparing the quantities and greatly improves the result (see Table 1). This is easily explained by noticing that NMR relaxation is sensitive to internal motions that occur on time scales that are shorter than the overall tumbling time τg of the molecule. In contrast, exchange contributions to the transverse relaxation rates in proteins originate from chemical shift modulations that take place on the μs time scale or longer. Rex terms cannot be predicted by our model, which is only designed to describe fast internal motions.
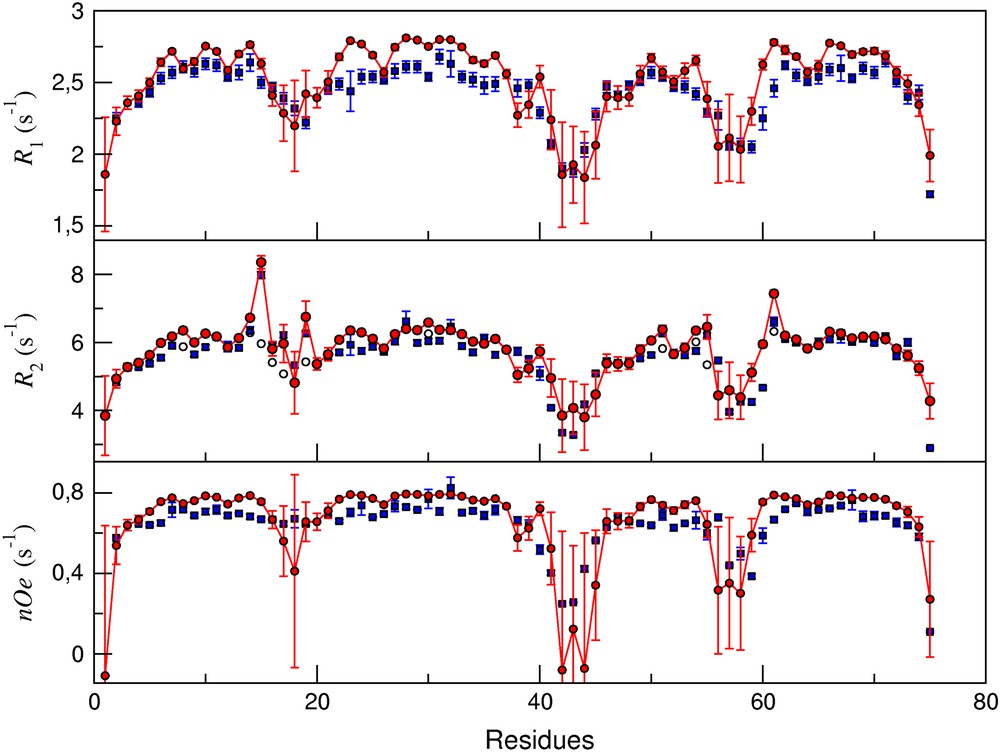
From top to bottom: predicted (circles) and experimental [18] (squares) values of amide 15N R1, R2, and ηNH relaxation rates in apo-calbindin. In the case of transverse relaxation rate, empty circles indicate predicted raw rates, whilst filled circles denote the value , where Rex is the exchange contribution to the transverse relaxation rate.
Rank order ρs and linear ρl correlation coefficients between predicted and experimental [18] values of amide 15N R1, R2, and ηNH relaxation rates in apo-calbindin
| ρs | ρl | σ | |
| 0.85 | 0.82 | 0.10 | |
| 0.65 | 0.72 | 0.63 | |
| 0.84 | 0.85 | 0.45 | |
| 0.84 | 0.85 | 0.13 | |
| 0.77 | 0.76 | 0.18 |
One of the most popular methods used in protein NMR is the so-called model-free approach introduced by Lipari and Szabo [11,12], which is based on the assumption that the internal correlation function in Eq. (3) can be approximated by a mono-exponentially decaying function towards the finite limit :
| (9) |
| (10) |
An SDM analysis of amide 15N relaxation measurements performed on apo-calbindin [18] can be compared to the spectral density functions predicted by the NCR approach (Fig. 2). is compared to defined by . The agreement between values of the spectral densities at ω = 0, ωN and ωh, obtained either by NCR predictions, , or by spectral density mapping, , for all residues i = 1,…, N in the protein, is measured by the correlation coefficients given in Table 2. Discrepancies between values of and are noted for some residues, in particular when exchange contributions are significant. The correlation between and is thus very similar to the correlation between predicted and experimental relaxation rates and , and therefore illustrates that both approaches are consistent with experiment to the same level of accuracy. Interestingly, the quantities calculated in the present work yielded significantly higher correlation with experiment than the comparison performed in previous work between the effective correlation time τe obtained either by a model-free analysis or predicted by the NCR approach on the same protein (correlation coefficients ρs and ρl ≈ 0.6) [14]. Altogether, these observations suggest that in this case the correlation and spectral density functions predicted by a network of coupled rotators provide a more relevant picture of internal dynamics than the one afforded by a model-free analysis.

From top to bottom: spectral density functions J(ω) at frequencies ω = 0, ωN, ωh, obtained by reduced spectral density mapping from experimental relaxation rates [18] (squares) and by our NCR approach (circles). For J(0), open squares correspond to an analysis of the raw experimental data, whilst filled squares represent the values obtained after subtraction of the exchange contribution from the experimental transverse relaxation rate .
Rank order and linear correlation coefficients between spectral densities [18] and those predicted by our NCR model at frequencies ω = 0, ωN, ωh
| ρs | ρl | |
| 0.62 | 0.69 | |
| 0.78 | 0.80 | |
| 0.84 | 0.84 | |
| 0.67 | 0.72 |
4 Conclusion
In this article, we have discussed new implications of a model introduced recently to describe internal dynamics of proteins. This approach is based on the approximate solutions of the rotational Langevin equations for a network of coupled rotators. This model does not rely on molecular dynamics simulations and permits one to predict 15N NMR relaxation rates, as illustrated for the protein calbindin.