

1 Introduction
Copper, a transition metal, is able to easily cycle between two redox states, oxidized Cu(II) and reduced Cu(I). It is a key cofactor in a diverse array of biological oxidation-reduction reactions. Copper sites in copper-containing enzymes have historically been divided into three classes based on their spectroscopic signatures, which reflect the geometric and electronic structures of the active sites: type 1 (T1) or blue copper; type 2 (T2) or square planar copper; and type 3 (T3) or coupled binuclear copper centers [1–3].
Over the past couple of decades, a number of the copper-ion sites in oxidases and monooxygenases have been characterized, and trinuclear copper centers have been shown to be involved in a number of biological processes [4–7]. The best studied of the oxidases, which include laccase [8–12], ceruloplasmin [8,13] and ascorbate oxidase [8,14,15], catalyze the four-electron reduction of O2 to H2O. In the multicopper-containing monooxygenases, the reduction of dioxygen to water is coupled to oxidation of substrates. Activation of hydroxylation is also observed in copper proteins with non-coupled binuclear copper centers, e.g., dopamine β-monooxygenase and peptidylglycine α-hydroxylating monooxygenase [8,16], as well as in proteins containing coupled binuclear copper centers, e.g., tyrosinase and catechol oxidase) [8,16]. Recently, similar chemistry has also been suggested at the catalytic sites of the membrane-bound particulate methane monooxygenase (pMMO) from Methylococcus capsulatus (Bath) [17–30].
The pMMO isolated from M. capsulatus (Bath) is a hydroxylase comprised of three-subunits (43, 29 and 28 kDa) [23,24,30]. Chan et al. have presented evidence that there are 15 reduced copper ions in the functioning pMMO, which they have classified into two groups according to their reactivity toward dioxygen [18,28]. One group of six copper ions are readily oxidized when the enzyme is exposed to O2, and these copper cofactors catalyze the reduction of dioxygen to water and O-atom transfer to the C − H bond of methane and a number of small alkanes as well as across the C = C double bond in related alkenes [19,24,30–32]. Accordingly, they have been dubbed catalytic clusters or C-clusters. From structural and spectroscopic data, it is now apparent that the six copper ions are organized into a mononuclear type 2 site, a binuclear copper center, and a tricopper cluster [30,33]. The remaining nine copper ions possess high redox potentials and are inert towards O2 [18,28–30]. It has been suggested that these copper ions provide a reservoir of reducing equivalents and serve an electron-transfer function during turnover of the enzyme. Hence, they have been referred to as E-clusters [18,24,30].
Electron paramagnetic resonance (EPR) data on the oxidized C-cluster and studies of model compounds have suggested that the putative tricopper cluster in pMMO consists of a symmetric triad of three Cu(II) ions that are mutually weakly ferromagnetically coupled with J ∼ 20 cm−1, where J is the isotropic exchange coupling constant in the Heisenberg-exchange Hamiltonian and [25,26,43]. In contrast, when the copper ions in the corresponding clusters of laccase, ascorbate oxidase, or ceruloplasmin are oxidized, the type 2 Cu(II) site is weakly coupled to the type 3 copper ions, which are strongly anti-ferromagnetically coupled through a bridging hydroxyl ligand [8,12–15]. Thus, variations in the catalytic activity may have origin in the detailed ligand structures of the copper ions within the cluster.
In research on multicopper-containing enzymes, spectroscopy has played a major role in elucidating the active sites in copper proteins. Among various spectroscopies, UV/Visible spectra, SQUID, X-ray absorption spectroscopy (XAS), magnetic circular dichroism (MCD) and EPR are the most frequently used to identify the various copper sites in multicopper proteins. However, active sites in copper proteins often exhibit spectral features which are unique compared to small-molecule copper complexes. Unusual geometric and hence electronic structures can be imposed on a copper site through its interaction with the protein scaffold.
A basic understanding of these unique spectral features of the copper sites in multicopper enzymes is typically obtained by generating spectroscopic working models of the copper-protein active sites. When a high-resolution protein structure becomes available from X-ray crystallography, one can correlate the active-site structure inferred from spectroscopy with the geometric structure deduced from the X-ray analysis, and these results could then be combined with molecular orbital calculations and parallel spectral studies on structurally defined model complexes to develop a detailed understanding of the electronic structure of the active site and its contribution to biological function.
In the case of pMMO, the tricopper cluster appears to be lost during the harsh conditions used to purify the protein for X-ray crystallographic analysis [24,27,30]. Only three coppers have been discerned in the X-ray structure: the mononuclear copper and the dinuclear copper center [33]. Although a tricopper cluster has been modeled into a vacant cavity within the protein structure, the ligand structure of the cluster remains to be confirmed experimentally [29]. Nevertheless, the design of suitable tricopper(II) model compounds to mimic the site can help scientists to elucidate the peculiarities of the putative tricopper cluster in pMMO [34].
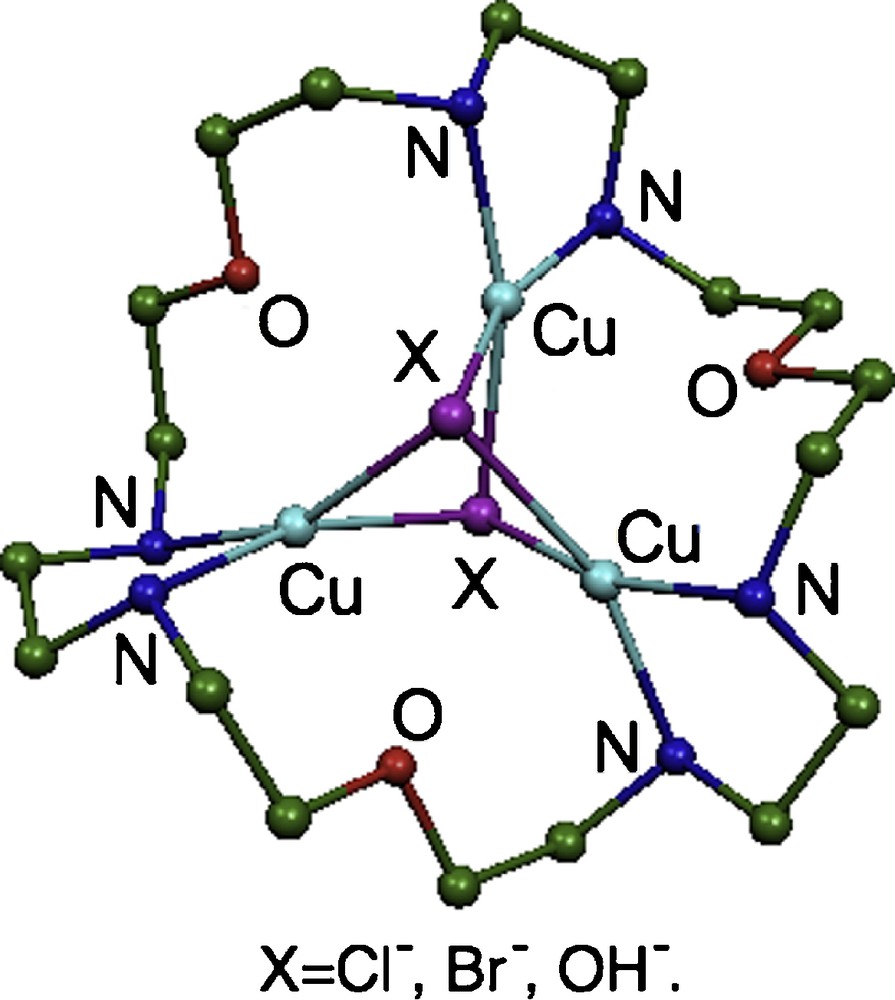
In this study, we have synthesized the macrocycle 1,10,19-trioxa-4,7,13,16,22,25-hexaazacycloheptaeicosane (tacp) (Fig. 1). The tacp ligand contains six nitrogen donor atoms, which could be exploited to assemble a complex with three metal cations [35]. Toward this end, a series of trinuclear Cu(II) compounds [Cu3(tacp)(μ3-X)2]4+ (X = Cl, Br and OH) (Fig. 2) have been prepared with the triad of Cu(II) ions bridged by two anions X in each of the complexes. We report here the spectra, magnetic properties and electronic structures of these compounds.
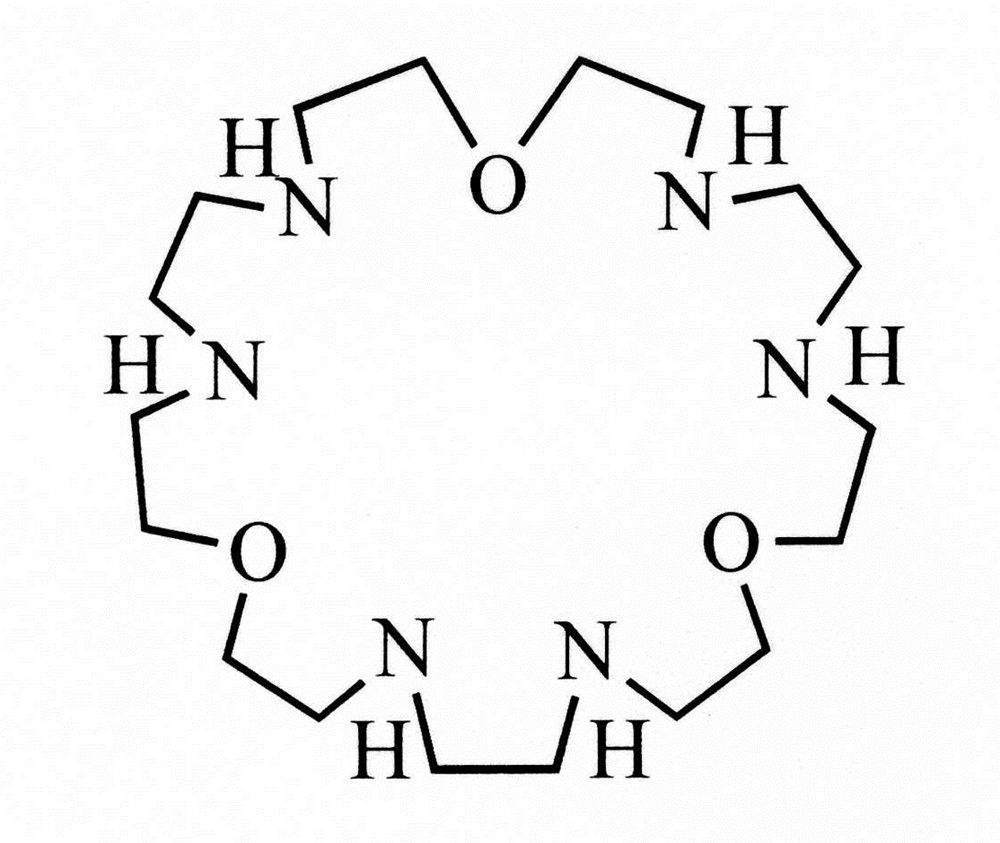
The ligand 1,10,19-trioxa-4,7,13,16,22,25-hexaazacycloheptaeicosane (tacp).
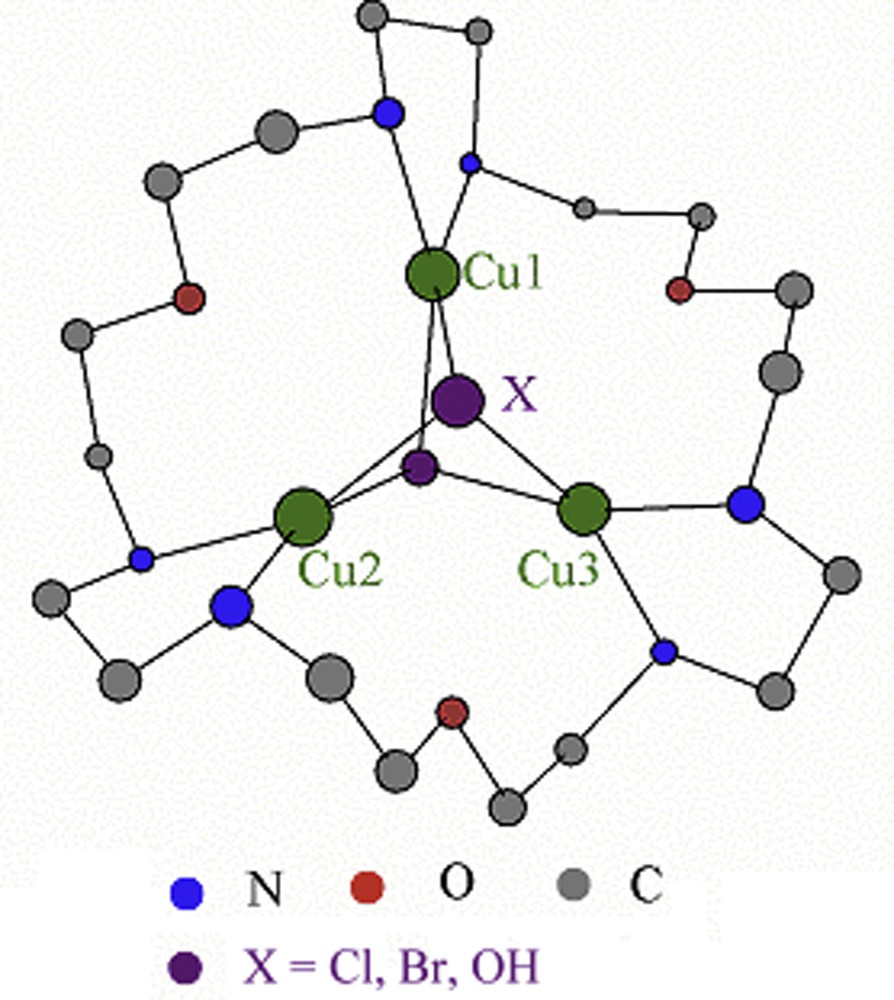
Schematic structures of [Cu3(tacp)(μ3-X)2]4+ (X = Cl, Br and OH).
2 Experimental
2.1 Materials
All reagents and solvents were purchased from commercial sources and were used as received unless otherwise noted. The ligand tacp was prepared according to the literature procedures [35].
2.1.1 [Cu3(tacp)(μ3-Cl)2](Cl)4 (1)
To a solution of tacp (0.5 g, 0.0013 mol) in 5 ml of methanol was added dropwise a solution of CuCl2 (0.61 g, 0.00455 mol) in 10 ml of methanol. In the process of adding the methanol solution of CuCl2, the color of the solution became blue initially. Then, the blue color of the solution gradually turned green and a precipitate was generated. The green precipitate obtained was isolated by filtration. MS (+ESI): m/z 758.4 [(M − Cl)]+. UV/Vis (methanol): λmax, nm (ɛ, M−1 cm−1) 268 (6489.41), 672 (154.23). IR (KBr): 3433 cm−1 (s), 3198 cm−1 (s), 2945 cm−1 (s), 2879 cm−1 (s), 2813 cm−1 (m), 1632 cm−1 (m), 1442 cm−1 (m), 1358 cm−1 (w), 1274 cm−1 (w), 1173 cm−1 (m), 1079 cm−1 (m), 998 cm−1 (m), 845 cm−1 (w), 793 cm−1 (w).
2.1.2 [Cu3(tacp)(μ3-Br)2](Br)4 (2)
To a solution of tacp (0.5 g, 0.0013 mol) in 5 ml of methanol was added dropwise a solution of CuBr2 (1.016 g, 0.00455 mol) in 10 ml of methanol. In the process of adding the methanol solution of CuBr2, the color of the solution became blue initially. Then, the blue color of the solution gradually turned dark green and a pale green precipitate was generated. The pale green precipitate obtained was isolated by filtration. UV/Vis (methanol): λmax, nm (ɛ, M−1 cm−1) 267 (6116.59), 664 (175.41). IR (KBr): 3435 cm−1 (s), 2897 cm−1 (s), 2932 cm−1 (s), 2881 cm−1 (s), 2806 cm−1 (s), 1631 cm−1 (m), 1447 cm−1 (s), 1365 cm−1 (m), 1280 cm−1 (w), 1120 cm−1 (s), 1073 cm−1 (s), 990 cm−1 (s), 827 cm−1 (w), 789 cm−1 (w).
2.1.3 [Cu3(tacp)(μ3-OH)2](Cl)4 (3)
To a solution of compound 1 (1.025 g, 0.0013 mol) in 10 ml of methanol, a solution of NaOH (0.104 g, 0.0026 mol) in 10 ml of methanol was added dropwise. The blue color of the solution gradually turned dark blue. The dark blue solution was dried under vacuum to afford a dark blue solid. UV/Vis (methanol): λmax, nm (ɛ, M−1 cm−1) 252 (9691.31), 610 (243.98). IR (KBr): 3493 cm−1 (s), 3271 cm−1 (s), 2980 cm−1 (s), 2870 cm−1 (s), 2043 cm−1 (s), 1687 cm−1 (m), 1648 cm−1 (m), 1463 cm−1 (s), 1321 cm−1 (m), 1280 cm−1 (m), 1063 cm−1 (s), 991 cm−1 (s), 812 cm−1 (w).
2.2 Physical measurements
Absorption spectra were recorded with a HP 8453 spectrophotometer. IR spectra were obtained with a Nicolet Fourier-Transform spectrometer in the range 500–4000 cm−1. Magnetic susceptibility data were collected with a Quantum Design-MPMS7. 1H NMR spectra for organic and inorganic complexes were recorded with a Bruker AMX 400 MHz spectrometer. EPR spectra were obtained on a Bruker E500 X-band spectrometer.
2.3 Density functional theory calculations
All calculations were performed using the Amsterdam density functional (ADF) program package [36] with the density fitting procedure to obtain accurate coulomb and exchange potentials in each self-consistent field (SCF) cycle, accurate and efficient numerical integration of the effective one-electron Hamiltonian matrix elements, and with the possibility of freezing core orbitals. The molecular orbitals were expanded in an uncontracted triple-Slater type orbital (STO) basis set, augmented with one 2p polarization function for hydrogen, one 3d function for carbon, nitrogen, and oxygen, and one 4p function for copper [37]. The cores (Cu:1s − 2p; C, N, O: 1 s; Cl:2p, Br:3p) were kept frozen. The LSD exchange-correlation potential of Vosko-Wilk-Nusair (VWN) was used in all cases, along with the nonlocal Becke exchange correction and nonlocal Perdew correlation correction [38,39].
Spin-unrestricted formalism was used for all the calculations. The high-spin (ferromagnetically coupled) state of the molecule was constructed, where the spins on each subunit were aligned in a parallel fashion. For the broken symmetry (BS, anti-ferromagnetically coupled) state [40], the spins were arranged in a spin-coupling pattern to achieve the correct net spin. This consideration resulted in a lowering of the electronic symmetry, and the BS calculation was performed at the lower point symmetry. The accuracy parameter for the numerical integration grid was 4.0. Spin populations were determined by the Mulliken analysis. The coupling constant J was estimated by using the projection technique: J = (BSE − HSE), where BSE and HSE denote the total energy calculated in the high-spin and in the BS solution, respectively.
3 Results and discussion
3.1 Synthesis
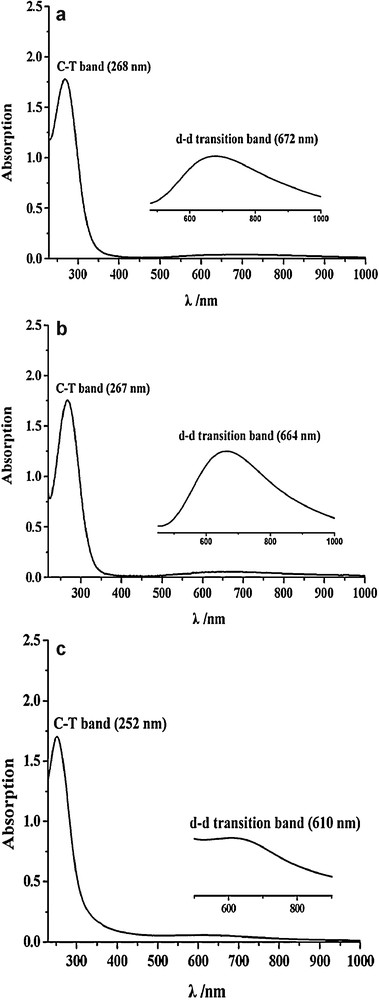
The overall synthetic routes to complexes 1 − 3 are summarized in Scheme 1. The ligand tacp was prepared according to the literature procedures [35]. Compounds 1 and 2 were prepared by the reaction of tacp and CuCl2 and CuBr2, respectively, in methanol. The axial-ligand exchange of compound 1 to generate compound 3 was achieved by stirring 1 with 2 eq. of NaOH in methanol.
Synthesis of compounds 1–3.
3.2 Electronic spectra
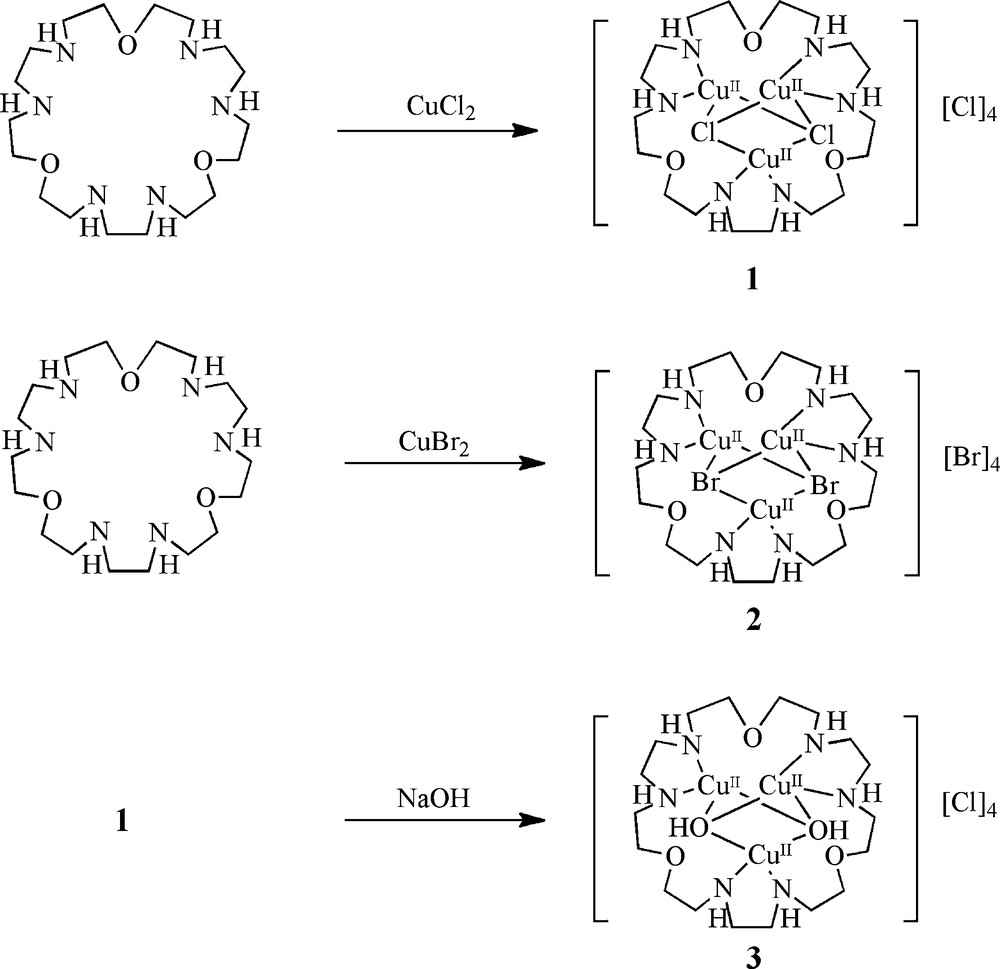
The electronic spectra of compounds 1 − 3 are shown in Fig. 3. All of these complexes show a weak absorption band at ∼650 nm and an intense absorption at ∼260 nm. The weak band can be assigned to d → d transitions from the copper's filled d orbitals to the half-occupied d orbital, which are electric dipole forbidden and thus generally appear as a weak feature in the absorption spectrum [41]. On the other hand, the intense absorption band corresponds to the electric dipole allowed ligand-to-metal charge transfer (LMCT) transition, which reflects the overlap of the ligands and copper orbitals involved in the charge transfer and is a useful probe of the bonding interactions of the ligands with the coppers. Since the LMCT bands of compounds 1–3 are similar to those of the family of tetranuclear Cu(II) compounds [42], each of these LMCT bands is assigned to the charge-transfer (CT) transition from the bridging ligand (Cl−, Br− and OH−) to the Cu(II) ions (Fig. 2).
UV–Vis spectra of (a) 1, (b) 2 and (c) 3.
3.3 Magnetic properties
Magnetic susceptibility measurements on compounds 1 and 2 were made on powder samples in the temperature range 2–350 K. Temperature-dependent χmT for 1 and 2 are displayed in Fig. 4 and Fig. 5, respectively. The χmT values (cm3 K mol−1) for 1 and 2 are ca. 2.05 at 350 K, which indicates that the compounds 1 and 2 each possess three unpaired electrons (S = 3/2, χmT = 1.88 cm3 K mol−1). With decreasing temperature, the χmT increases continuously for both 1 and 2 to a maximum value at ∼75 K manifesting a ferromagnetic coupling between the three Cu(II) metal centers. Below the maximum value, χmT decreases as the temperature is decreased in both compounds, which is indicative of an intermolecular anti-ferromagnetic interaction, zero-field splitting (ZFS), or a mixture of both. To obtain the exchange coupling constants of 1 and 2, an isotropic Heisenberg-Dirac-van Vleck (HDvV) Hamiltonian (1) with S1 = S2 = S3 = ½ was used to fit the magnetic susceptibility data [43].
| (1) |
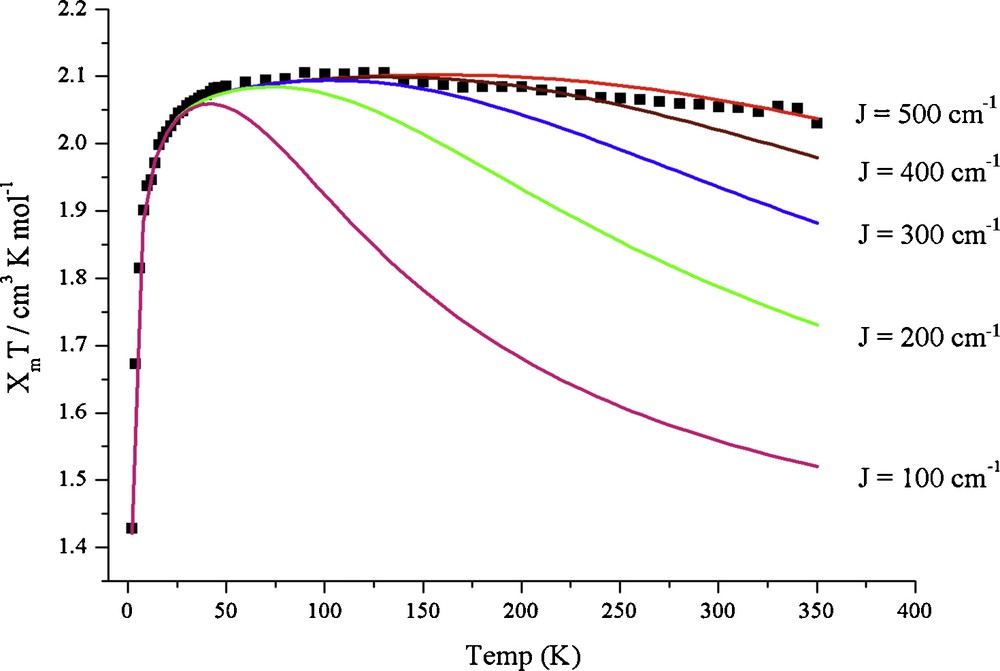
Theoretical fits to the experimental temperature dependence of the product χmT for 1. The experimental data are denoted by “■” and the theoretical curves for J = 100, 200, 300, 400 and 500 cm−1 are color-coded. The same experimentally determined g and zJ′ values were used in all the fits.
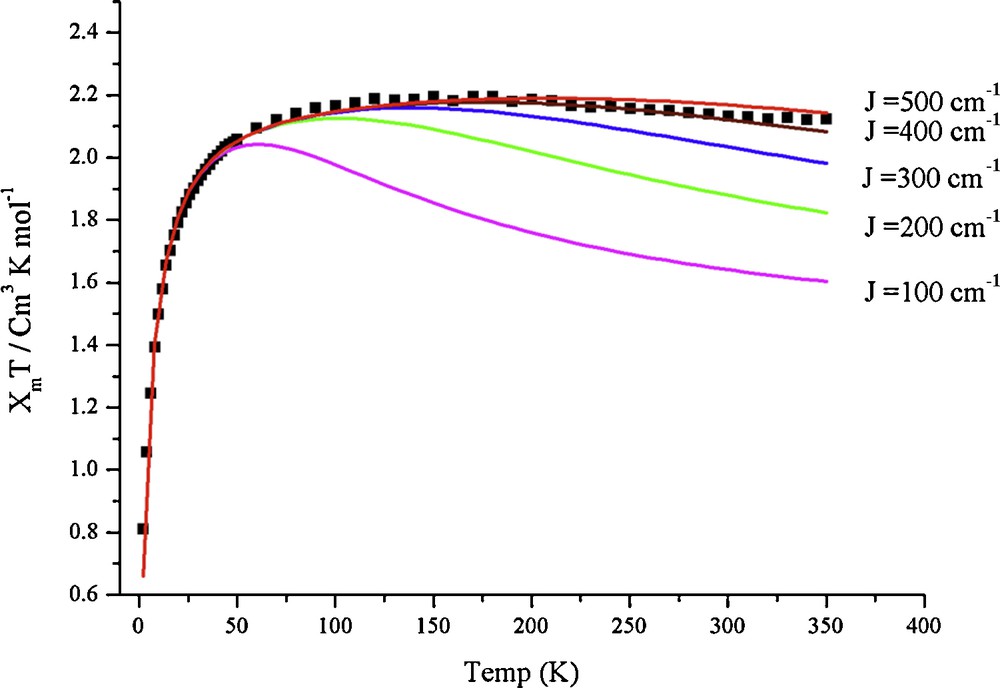
Theoretical fits to the experimental temperature dependence of the product χmT for 2. The experimental data are denoted by “■” and the theoretical curves for J = 100, 200, 300, 400 and 500 cm−1 are color-coded. The same experimentally determined g and zJ′ values were used in all the fits.
Since the compounds 1 and 2 possess almost C3 symmetry, we have assumed JAB = JAC = JBC = J. The best fit parameters for the magnetic susceptibility data to Eq. (1) are g = 2.13, J = 470 cm−1 and zJ′ = −0.20 cm−1 for 1 and g = 2.19, J = 430 cm−1 and zJ′ = −0.96 cm−1 for 2, indicating strong ferromagnetic coupling. z is the number of nearest magnetic neighbours, and J′ is the interaction parameter between two nearest magnetic neighbours.
Attempts to separate compound 3 from the diamagnetic salts failed. Although not characterized by SQUID, the magnetic properties of 3 were studied by EPR and DFT calculations as described later in the text.
3.4 Electron paramagnetic resonance (EPR) spectroscopy
In pMMO, the Chan group has proposed a ferromagnetically coupled trinuclear copper cluster for the catalytic site of the enzyme after oxidative turnover in the absence of hydrocarbon substrate on the basis of EPR spectroscopy and magnetic susceptibility [17,18,21,22]. The EPR spectra of compounds 1 − 3, therefore, are useful benchmarks for verifying the magnetic properties of the putative tricopper site in this state of the enzyme.
The results of our EPR studies of compounds 1 − 3 are shown in Fig. 6. The 77 K EPR spectra of the complexes 1 and 2 show isotropic signals at g = ∼2.1, which are quite similar to the broad and nearly isotropic EPR signal observed for the isolated pMMO. EPR/titration studies of the formation of 1 at varying Cu/ligand concentration ratios confirmed that the recorded isotropic EPR signal resulted mainly from the S = 3/2 ground state of a triad of ferromagnetically coupled Cu(II) ions (Fig. 7). When 0.1 eq. Cu(II) chloride was added to 1 eq. of the macrocyclic ligand, the spectrum exhibits obvious hyperfine coupling characteristic of the mononuclear Cu(II) complex (Fig. 7a). With gradual addition of increasing equivalents of Cu(II) chloride (0.3 eq., 1 eq., 2 eq., 3 eq.) to 1 eq. of the macrocyclic ligand, an increase in the intensity of the isotropic signal was observed, with concomitant decrease in the intensity of the anisotropic signal (Fig. 7b, c, d, e). A qualitative simulation of the EPR spectra of 1 and 2 was carried out by means of the WINEPR-Simfonia software [44]. The calculated EPR spectra suggest that ZFS axial parameter (D) is of the order of 90 Gauss or lower (Fig. 8). Thus we propose that D in compound 1 and 2 is smaller than 0.009 cm−1. The EPR results are consistent with our magnetic susceptibility analysis indicating that compounds 1 and 2 contain ferromagnetically coupled trinuclear Cu(II) cores.
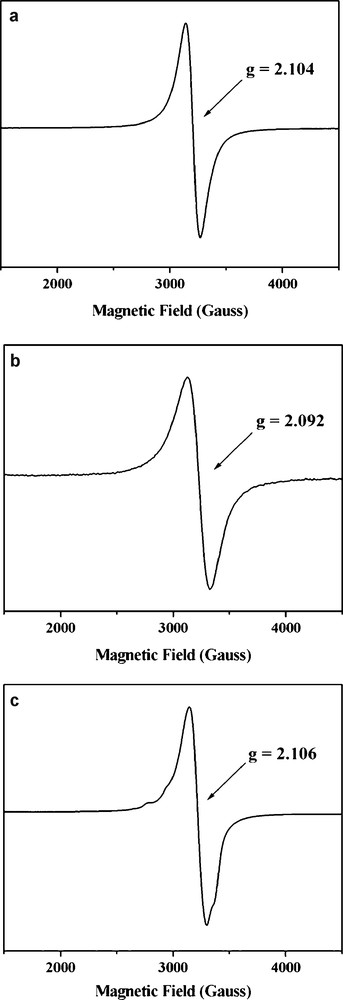
EPR powder spectra at 77 K of (a) 1, (b) 2 and (c) 3.
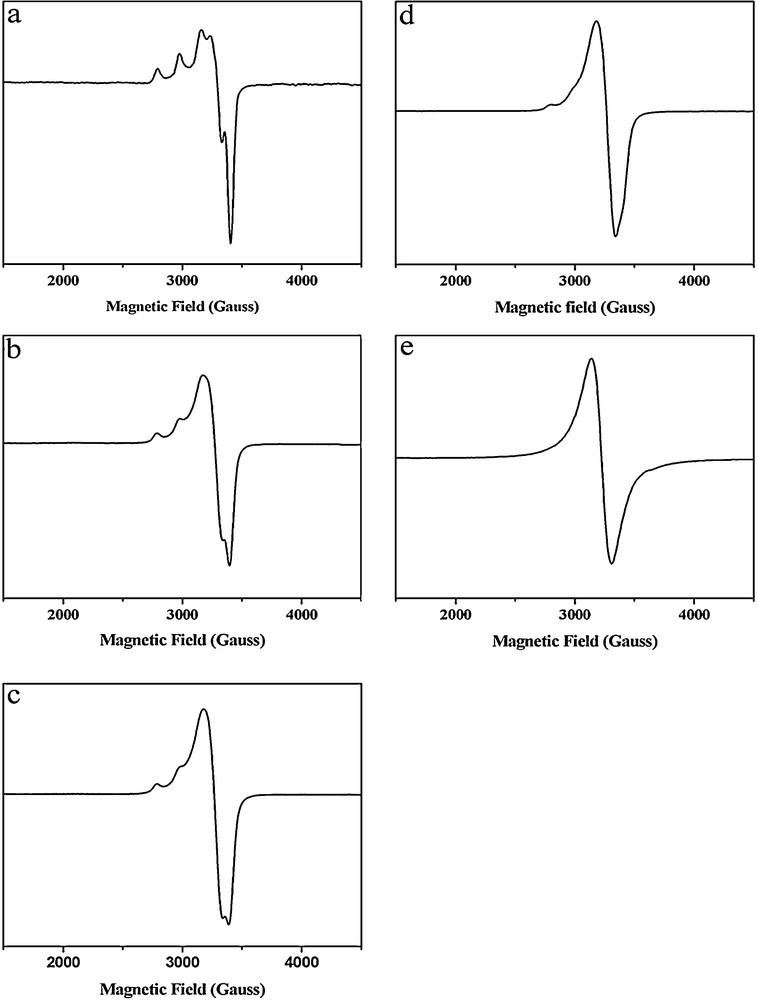
Changes in the 77 K electron paramagnetic resonance (EPR) spectrum upon the addition of varying equivalents of CuCl2 to 1 eq. tacp in methanol: (a) 0.1 eq.; (b) 0.3 eq.; (c) 1 eq.; (d) 2 eq.; and (e) 3 eq.
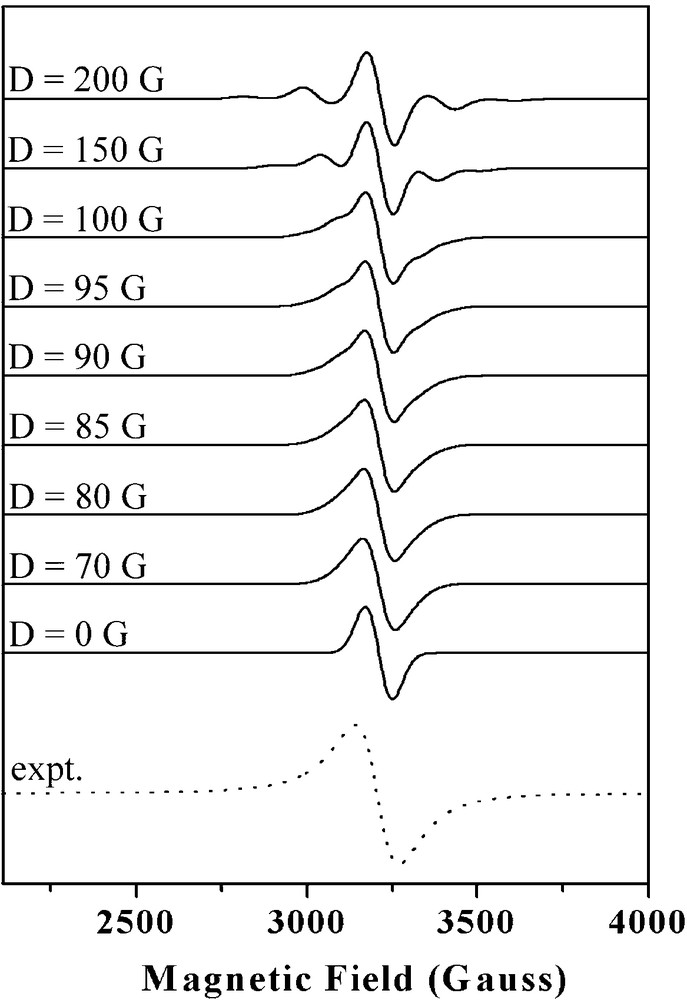
Simulations of the electron paramagnetic resonance (EPR) spectra of compound 1 and comparison with the experimental EPR signal (dotted line).
On the contrary, the 77 K EPR spectrum of the complex 3 exhibits an anisotropic signal, which is characteristic of an anti-ferromagnetically coupled (S = 1/2) trinuclear Cu(II) compounds [45,46]. Evidently, but not surprisingly, the exchange coupling between the three Cu(II) ions is mediated by the bridging ligand X.
3.5 Density functional theory (DFT) calculations
DFT calculations were carried out on 1, 2 and 3 to investigate, compare, and interpret the magnetic properties. All structures of compounds 1 − 3 were optimized with the high-spin electronic configuration (S = 3/2) and the broken-symmetry spin electronic configuration (S = ½), respectively. The optimized structures of these model compounds are depicted in Fig. 9.
Fully optimized structures of [Cu3(tacp)X2]4+ (X = Cl−, Br−, OH−). Hydrogen atoms are omitted for clarity. The z-axis is collinear with the X − X line. All three Cu(II) atoms lie on the xy plane.
The calculated energy, geometric data and spin density on each copper ion of the tricopper clusters 1, 2, and 3 are shown in Table 1. Although we have not constrained the symmetry of these model complexes, the core geometry of the three copper ions possesses C3 symmetry in the S = 3/2 spin state and C2 symmetry in the S = ½ spin state, respectively. The optimized structures for compounds 1 − 3 show very long interatomic Cu − Cu distances (2.8 − 3.1 Å), suggesting that there is no direct Cu − Cu interaction. Therefore, the three Cu atoms are connected by two axial bridging X ligands (X = Cl− for 1, Br− for 2 and OH− for 3). The coordination sphere at each Cu atom in 1 − 3 is best described as a distorted square planar. The average Cu − X − Cu angles for compounds 1 − 3 are 78.8°, 78.9° and 89.9°, respectively.
Structural parameters, Mulliken spin densities, the relative energies between the S = 3/2 and S = ½ states (ΔE(3/2-1/2)) and the calculated Heisenberg J values for [Cu3(tacp)X2]4+ (X = Cl−, Br−, OH−).
| X = Cl− | X = Br− | X = OH− | ||||
| Geometry | S = 3/2 | S = 1/2 | S = 3/2 | S = 1/2 | S = 3/2 | S = 1/2 |
| Cu1 − Cu2 (Å) | 3.010 | 2.961 | 3.130 | 3.055 | 2.841 | 2.883 |
| Cu1 − Cu3 (Å) | 3.010 | 2.961 | 3.130 | 3.049 | 2.841 | 2.877 |
| Cu2 − Cu3 (Å) | 3.010 | 3.010 | 3.130 | 3.147 | 2.841 | 2.824 |
| Cu1 − X (Å) | 2.342 | 2.337 | 2.465 | 2.452 | 2.010 | 2.008 |
| Cu2 − X (Å) | 2.343 | 2.341 | 2.465 | 2.462 | 2.010 | 2.017 |
| Cu3 − X (Å) | 2.342 | 2.340 | 2.464 | 2.461 | 2.010 | 2.015 |
| Cu1 − N (Å) | 1.981 | 1.986 | 1.986 | 1.992 | 1.984 | 1.979 |
| Cu2 − N (Å) | 1.981 | 1.984 | 1.986 | 1.988 | 1.985 | 1.982 |
| Cu3 − N (Å) | 1.982 | 1.983 | 1.987 | 1.990 | 1.985 | 1.983 |
| Cu1(spin) | 0.413 | −0.398 | 0.395 | −0.358 | 0.481 | −0.432 |
| Cu2(spin) | 0.413 | 0.400 | 0.395 | 0.374 | 0.481 | 0.455 |
| Cu3(spin) | 0.413 | 0.405 | 0.395 | 0.375 | 0.481 | 0.455 |
| X (spin) | 0.219 | 0.074 | 0.269 | 0.087 | 0.193 | 0.072 |
| ΔE (3/2 − 1/2)a | −1.046 | −0.884 | 0.998 | |||
| J (cm−1) | 366 | 295 | −349.3 |
a Energy difference between the S = 3/2 and S = ½ states in kcal/mol.
For these three tricopper clusters, the S = 3/2 spin states were computed with the three unpaired electrons, all spin-up. Because of the symmetry of our geometric model, all of the J values in Eq. (1) are taken to be approximately equal, and there is only one unique BS spin state, which has one spin-down electron mostly localized on one copper site and two spin-up electrons on the other two sites. From the relative energies of the high and low spin states, compounds 1 and 2 possess an S = 3/2 ground state (ferromagnetic coupling), and 3 has an S = 1/2 ground state (anti-ferromagnetic coupling), in good agreement with the EPR results. The calculated coupling constant (J) is 366 cm−1 for 1, 295 cm−1 for 2, −349.3 cm−1 for 3. These calculated J values for 1 and 2 are smaller than the values determined from the analysis of the magnetic susceptibility data (470 cm−1 for 1 and 430 cm−1 for 2). It is well known that BP86 functional tends to stabilize the lower spin state.
To elucidate the factors dominating the stable ground state, we have performed a molecular orbital analysis. For compound 1, the compositions of the atomic orbitals (AOs) that make up some of the highest energy molecular orbital in the high-spin state (S = 3/2) are shown in Table 2. The results of a similar analysis for both compounds 2 and 3 are given in the supporting information (Tables S1 and S2). The principal AOs accounting for the spin distribution at the copper core center are dxz and dyz for the copper atoms and px, py and pz for the Cl atoms. Linear combinations of these AOs give two almost degenerate e symmetry MOs (114 and 115 in α-spin) and one a symmetry MO (MO 116 in α-spin) (Fig. 10). In the e symmetry MOs, the Cu(dxz/dyz) are involved in π antibonding interactions with the Cl(px/py). On the other hand, the a symmetry MO is composed of the σ antibonding interaction between the Cu(dxz/dyz) and Cl(pz). Apparently, the two different types of bonding interactions between the axial ligands and the copper ions destroy the degeneracy of these molecular orbitals.
Compositions of the atomic orbitals in the principal molecular orbitals for model compound 1 (S = 3/2).
| Orbital | Energy (eV) | Occupation | Primary contributors symmetrized fragment orbitals (percent) |
| (a) α–Spin | |||
| 112 | −18.0384 | 1.00 | O16(P:x)(14.8), O32(P:y)(12.0), O16(P:z) (9.0), O32(P:z) (8.5) |
| 113 | −18.0163 | 1.00 | O21(P:y) (14.7), O21(P:z) (12.4), O21(P:x) (5.7) |
| 114 | −17.6228 | 1.00 | Cu2(D:xz) (11.8), Cl4(P:x) (6.8), N9(P:x) (6.3), Cl5(P:x) (5.1) |
| 115 | −17.6038 | 1.00 | Cu3(D:yz) (13.8), Cu1(D:xz) (9.6), Cl4(P:y) (6.9), N11(P:y) (5.2), Cl5(P:y) (5.1) |
| 116 | −17.4318 | 1.00 | Cu3(D:yz) (10.0), Cl5(P:z) (7.9), Cu2(D:xz) (7.7), Cl4(P:z) (7.7), Cu1(D:xz) (7.2) |
| 117 | −12.6656 | 0.00 | Cu2(S) (14.9), Cu1(S) (13.9), Cu3(S) (13.5), Cu1(S) (6.2), Cu3(S) (6.2), Cu2(S) (6.0) |
| 118 | −11.9925 | 0.00 | Cu1(S) (18.6), Cu3(S) (16.4), Cu2(P:y) (7.5) |
| 119 | −11.9555 | 0.00 | Cu2(S) (23.6), Cu3(S) (7.8), Cu3(P:x) (6.9), Cu1(P:y) (5.7), |
| Cu1(S) (5.3) | |||
| 120 | −11.7679 | 0.00 | H52(S) (6.6), H38(S) (6.4), H54(S) (6.4), H51(S) (6.2), H33(S) (5.9), H53(S) (5.8) |
| (b) β–Spin | |||
| 110 | −18.5013 | 1.00 | Cu3(D:x2-y2) (15.6), Cu1(D:xy) (11.8), Cu2(D:xy) (10.9) |
| 111 | −18.2869 | 1.00 | O16(P:x) (11.7), O32(P:y) (10.0), O21(P:y) (7.4), O32(P:z) (6.8), O16(P:z) (6.7), O21(P:z) (6.4) |
| 112 | −17.9326 | 1.00 | O16(P:x) (13.9), O32(P:y) (11.3), O16(P:z) (8.7), O32(P:z) (8.2), Cu2(D:xy) (6.1) |
| 113 | −17.9093 | 1.00 | O21(P:y) (13.7), O21(P:z) (12.0), Cu3(D:x2-y2) (6.6), O21(P:x) (5.3) |
| 114 | −17.0089 | 0.00 | Cu2(D:xz) (15.9), Cl4(P:x) (6.3), N9(P:x) (5.8), Cu2(D:yz) (5.8) |
| 115 | −16.9847 | 0.00 | Cu3(D:yz) (18.0), Cu1(D:xz) (12.7), Cl4(P:y) (6.4) |
| 116 | −16.7724 | 0.00 | Cu3(D:yz) (12.6), Cu2(D:xz) (9.6), Cu1(D:xz) (9.1), Cl5(P:z) (7.0), Cl4(P:z) (6.9) |
| 117 | −12.5850 | 0.00 | Cu2(S) (13.8), Cu1(S) (12.9), Cu3(S) (12.5), Cu1(S) (6.7), Cu3(S) (6.7), Cu2(S) (6.6) |
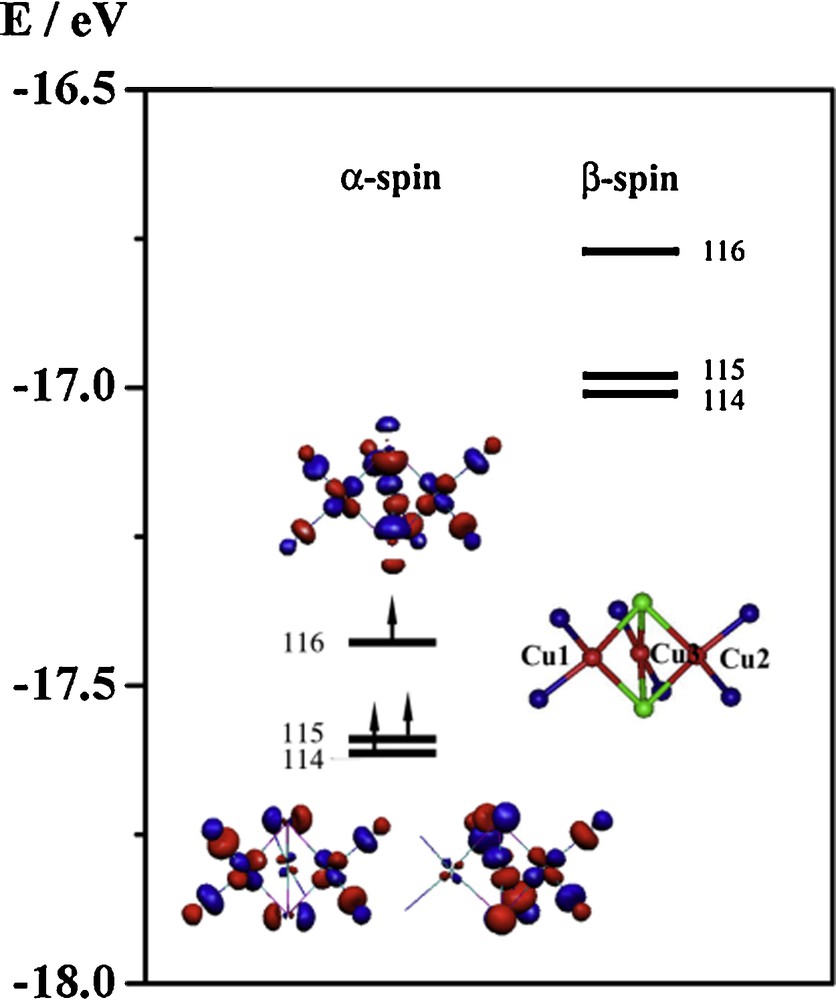
Simplified molecular orbital energy diagram and the isosurface contour plots for the S = 3/2 spin state of the compound 1.
The deviation from the degeneracy will dominate the type of spin-coupling for the various trinuclear copper complexes. Figs. 10–12 summarize the MO energy diagrams and plots of the highest occupied MOs of the three model complexes 1, 2, and 3. The energy of the σ type antibonding molecular orbital is higher than the π type antibonding molecular orbitals in both 1 and 2, but the reverse is obtained in 3. The energy variation of these two sets of MOs may be due to the change in Cu − X − Cu angles (X = Cl (1), Br (2) and OH (3)). When the Cu − X − Cu angle increases from ∼ 79° (1 and 2) to 89.9° (3), the interactions between Cu(dxz)/(dyz) and X(px)/(py) become stronger. These stronger interactions significantly destabilize the e symmetry MOs, which results in the inversion of a symmetry and e symmetry MOs [43].

Simplified molecular orbital energy diagram and isosurface contour plots for the S = 3/2 spin state of the compound 2.
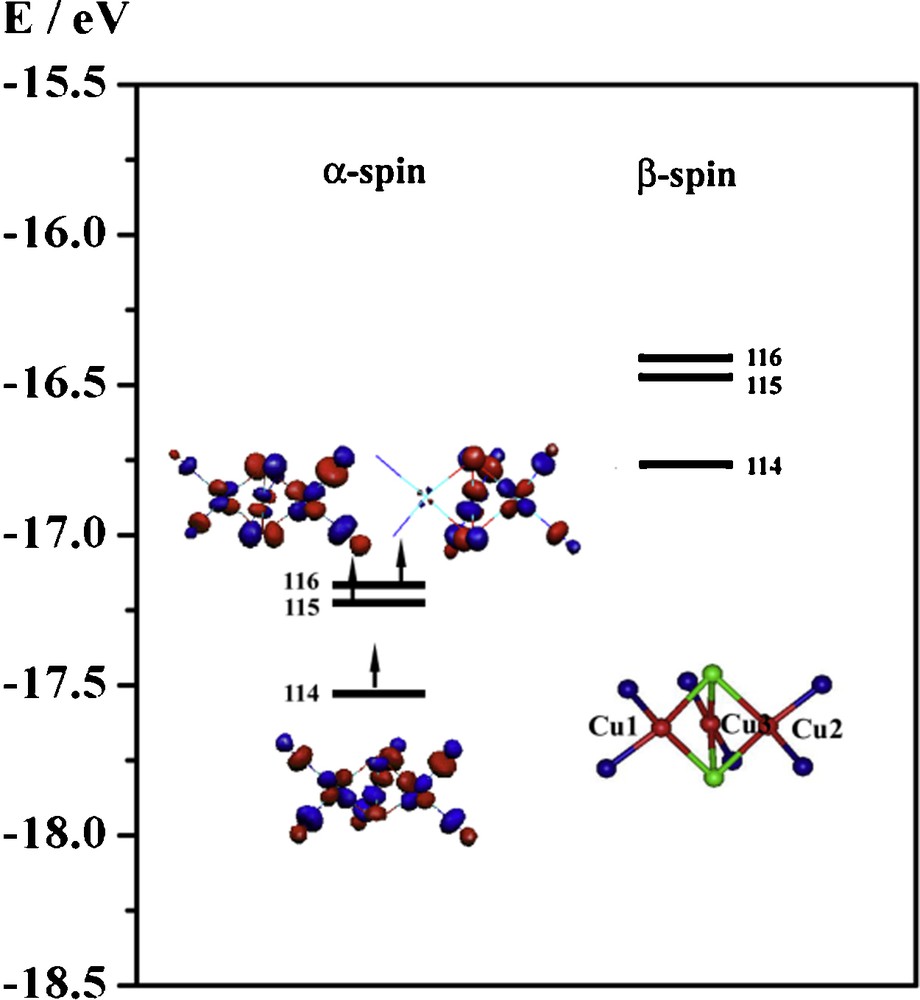
Simplified molecular orbital energy diagram and the isosurface contour plots for the S = 3/2 spin state of compound 3.
The energy gap between the σ type and π type molecular orbitals in the compound 1 is 0.20 eV. The energy gap in 2 is similar. However, the energy gap in compound 3 with the anti-ferromagnetic coupling increases to 0.358 eV. Interestingly, we find that the energy gap between the σ type and π type molecular orbitals is correlated with the total energy difference between the ferromagnetically and anti-ferromagnetically coupled states for the three systems (Fig. 13). This relationship suggests that the magnitude of the exchange interactions between the three copper ions is governed by the energy gap between the a symmetry (σ antibonding) and e symmetry (π antibonding) MOs, as predicted by the qualitative magnetic theory for dinuclear copper(II) system derived by Hay et al. [47].
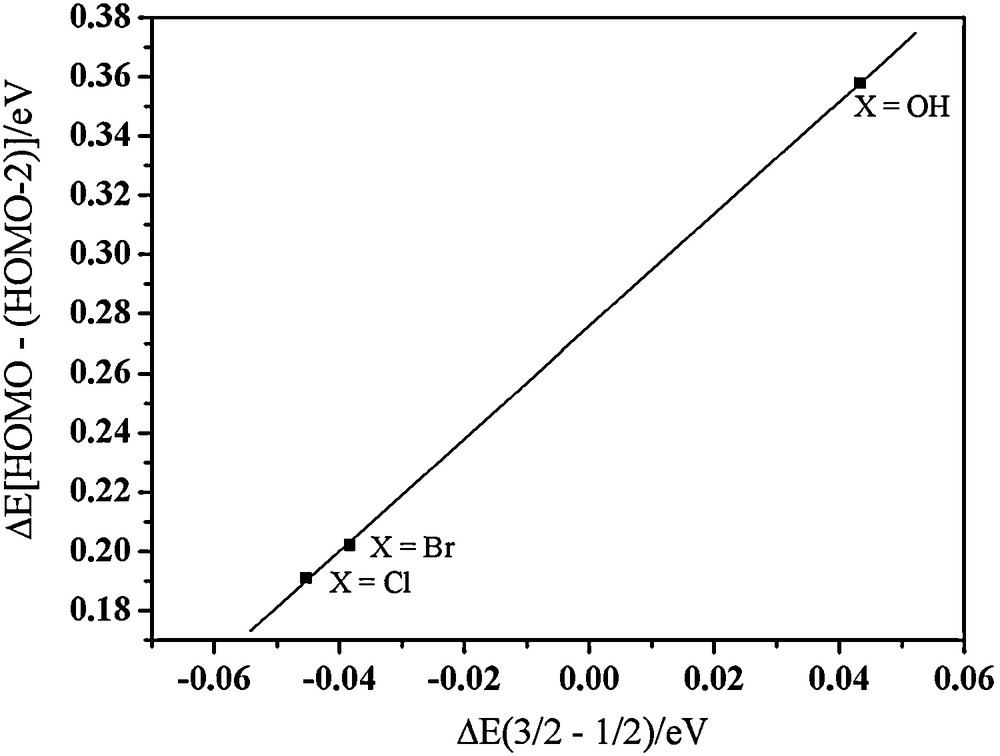
Energy differences between S = 3/2 and S = 1/2 spin states vs the energy gap between the HOMO (MO 116α for 1, 126α for 2, and 116α for 3) and HOMO-2 (MO 114α for 1, 124α for 2, and 114α for 3) for the three trinuclear Cu(II) complexes.
4 Conclusions
In this study, we have prepared a series of trinuclear Cu(II) model complexes to gain some insights into how the electronic structure of the tricopper cluster might influence the spin-coupling interactions among the unpaired electrons localized in the three copper ions. By varying the bridging ligand, the electronic structure, and hence, the spin-coupling interactions could be tuned. This approach offers a good strategy to elucidate how the spin-coupling interactions among the three copper ions in the trinuclear Cu(II) complex are determined by the peculiarities in the electronic structures.
Magnetic susceptibility measurements showed that the chloride and bromide bridged trinuclear Cu(II) complexes are strongly ferromagnetic coupling with J = 430 cm−1 and 470 cm−1, respectively. The isotropic EPR signals observed for these two complexes are consistent with an S = 3/2 ground state. A small ZFS (D ≤ 90 Gauss) was also inferred from the EPR spectra. Density functional theory calculations along with the BS method predicted J values of 366 cm−1 and 295 cm−1 in chloride and bromide complexes, respectively, in essential agreement with experiment. For the tricopper complex with the hydroxide bridge, the J value was calculated to be −349 cm−1, namely, the mutual interactions among the three copper ions are anti-ferromagnetic. Unfortunately, we were unsuccessful in obtaining magnetic susceptibility evidence to confirm the anti-ferromagnetic coupling in this complex. However, the anisotropic EPR signal observed for the hydroxide complex appears to be consistent with an S = ½ ground state. Qualitatively, these ferromagnetic and anti-ferromagnetic states are determined by compensation between the contributions of the Cu-ligand π type antibonding orbitals and σ type antibonding orbital.
Acknowledgments
This research was supported by funds from Academia Sinica and a grant from the National Science Council of the Republic of China (NSC 92-2113-M-001-057) to SIC.