

1 Introduction
Adsorption is an important operation for gas mixture separation and purification of gaseous effluent streams [1]. Estimation of the heat effects involved during adsorption is crucial for the correct designing and operating of adsorption facilities [2]. Calorimetry is known as the best technique for the measurement of this thermodynamic parameter [3]. However, it is reported that the technique should overcome a number of experimental difficulties most of which are caused by the possible errors in the measurements of the adsorbed amounts [4,5]. In addition, significant challenges on the calorimeter design are needed in order to prevent measurement imprecision including those due to convective heat losses and artifacts related to side effects [6].
In the particular case of physical adsorption, the heat effects involved during adsorption could be determined with the isosteric method based on the Clausius-Clapeyron equation using adsorption equilibrium data at various temperatures [7]. However, it is to be noted that the isosteric procedure is limited only to physisorption processes involving relatively low heat of adsorption and for equilibrium reached within an accessible range of pressure and temperature [8]. In the case of physisorption on porous material, the adsorbed species are trapped in different potential wells predisposed within the accessible porosity. During desorption, the species adsorbed in more easily accessible porosity desorbs first. As for those adsorbed in the less accessible porosity, one has to supply the required thermal energy for their transfer into the gas phase. This energy could be estimated by the TPD method using a relatively inexpensive and simple experiment to set up and to run [9]. Nevertheless, a criticism is reported concerning the validity of the assumption related to experimental conditions permitting to achieve a TPD measurement free of the influence of diffusion and readsorption [10].
The adsorption experiments carried out under static conditions are often considered to provide the most reliable data because they make it possible to assure correct equilibrium conditions between gaseous and adsorbed phases. This statement is the basic hypothesis required for the validity of the Clausius-Clapeyron equation that allows the use of the isosteric method. Although for adsorption under static conditions it is necessary to cope with some technical difficulties most of which are related with vacuum handling and longer analysis time required to reach the equilibrium. TPD experiments under dynamic conditions are easy to carry out but they require careful consideration of the contribution of different physical processes related to diffusion (heat and mass transfers), particularly in case of molecules with sizes similar to those of adsorbent pores.
In the present study we show through the example of toluene adsorption on microporous activated carbon that a significant difference could be found between values of the heat effect involved during adsorption and desorption determined by isosteric and TPD methods using data obtained with experiments carried out respectively under static and dynamic conditions. This issue requires particular attention because the knowledge of accurate values of the heat effect parameters is important for the engineering and operating of adsorption facilities, particularly with respect to safety considerations. The heat involved during adsorption and/or desorption may induce significant local warming to start combustion of either the adsorbate or the adsorbent itself [11].
2 Experiment
2.1 Textural characterisation
The nitrogen adsorption/desorption isotherms at 77 K were measured with an automatic apparatus Omnisorp 100cx (Coulter, USA). Before adsorption experiments, the samples were out-gassed under vacuum at 573 K for 2.5 h, which was found to be enough to ensure the cleaning of the adsorbent surface.
2.2 Procedure of dynamic adsorption and desorption experiments
Adsorption/desorption experiments were performed under dynamic conditions at atmospheric pressure using the experimental apparatus as reported elsewhere [12]. Prior to adsorption, a gaseous mixture with a given concentration of toluene vapor in nitrogen flow was prepared by means of a saturator connected to a condenser that was immersed in a thermostatically controlled bath. This temperature was carefully checked so as to maintain constant toluene vapor pressure and consequently keep its concentration unchanged. It should be pointed out that due to technical limitations, it was not possible to obtain lower condenser temperatures, which does not allow lowering toluene concentration (e.g., between 0 and 7%). Attention was paid to always hold the toluene partial pressure lower than the vapor pressure value at adsorption temperature to avoid vapor condensation from gas phase. In addition, all tubes, valves and connections of the experimental apparatus were permanently heated. The resulting toluene concentration, expressed as molar fraction Cin before contact gas/solid (Table 1), corresponds to P/Patm, where P is vapor pressure of toluene and Patm the atmospheric pressure (Patm = 760 torr).
Experimental toluene vapor pressure and its concentration in N2 flow used in adsorption experiments under dynamic conditions.
| Condenser temperature/K | 274 | 276 | 278 | 280 | 283 |
| Toluene vapor pressure in N2 flow (Torr) | 7.19 | 8.16 | 9.24 | 10.43 | 12.47 |
| Concentration of toluene in the gas stream (%) | 0.95 | 1.07 | 1.22 | 1.37 | 1.64 |
The sample pretreatment as well as adsorption and desorption experiments were made using a flow rate of 100 cm3 min−1 that was passed through a quartz reactor (U-type) containing 0.3 g of RB1 sample. The latter was first pretreated under N2 flow at 573 K for 2.5 hours then adsorption was carried out under toluene/N2 flow until saturation was reached. The mixture flow was then switched again to pure N2 flow, to proceed with isothermal desorption until desorbed toluene concentration in N2 flow at the reactor outlet reached zero. This step was followed by subsequent linear heating under N2 flow in order to perform the TPD experiment.
The toluene concentrations at reactor outlet during adsorption and desorption were monitored with a Fourier Transform Infra Red (FTIR) spectrometer (Jasco 410, resolution 4 cm−1), using a Pyrex gas cell equipped with CaF2 windows. It is to be noted that the quantitative analysis is, currently, facilitated by FTIR instrumentation and programs that allow high frequency spectra acquisition and manipulation (subtraction, multiplication, smoothing). This operation is particularly easy when there are no Infra Red (IR) bands overlapping, which allows the application of Beer-Lambert law relating IR band area to concentration. In the present work, the quantitative treatment was achieved by integrating characteristic toluene IR bands located between 2600 and 3200 cm−1. Preliminary calibration with toluene/N2 mixtures of known composition was carried out using reactor bypass, in order to correlate bands area with concentration. The toluene vapor IR bands between 2600 and 3200 cm−1 has been used to obtain the calibration curve. The FTIR detector response was found to produce linear plot in the studied concentration range and its accuracy was checked over three experiments and represented as mean values as shown in Fig. 1.

Calibration curve of toluene infra red (IR) bands’ area integral between 2700 and 3230 cm−1 using different concentrations of toluene in N2 (molar fraction, %) with a flow rate of 100 cm3 min−1.
2.3 Gravimetric measurements
The adsorption isotherms of toluene (Aldrich, < 99.5%) were determined using a gravimetric adsorption assembly. The apparatus consists of a microbalance (from C. I. Electronics) having a precision of 10 μg and a vacuum system composed with rotary and diffusion pumps that can achieve sufficiently low vacuum (better than 1.33 × 10⁻² Pa). Before each experiment the samples were first out-gassed under vacuum at 573 K for 2.5 h. The pressure readings during experiments were made with a pressure transducer (Pfeiffer Vacuum-CMR 262). The isotherms were studied at two different temperatures (298 K and 318 K) ± 0.1 K, which were maintained with the help of a stirred thermostatic water bath from Scientific VWR (model 325).
3 Results and discussion
3.1 Textural characterisation
The nitrogen adsorption isotherm at 77 K obtained with the RB1 sample (a commercial activated carbon recommended for the adsorption of Volatile Organic Compounds manufactured by the NORIT Company) is presented in Fig. 2, where the adsorbed amounts are expressed as liquid volume. The resulting isotherm is, as expected for an activated carbon, essentially of Type I according to the IUPAC classification [4]. Despite the predominance of microporous texture as revealed by N2 isotherm, the presence of a slight hysteresis indicates the existence of additional mesoporosity. The isotherm, which should be classified, so far, as a mixed Type I + II, allows the determination of textural characteristics according to t-plot method [4–13]. The total porous volume (Vt) was estimated from the adsorption at P/P0 = 0.98 The microporous volume vmic value, on the other hand, was extracted from the interception of t-plot line whereas, the mesopore volume Vmeso value was obtained by subtracting the microporous volume from the total porous volume (Vt). Thus, the resulting microporous and mesoporous volumes values correspond respectively to 0.46 and 0.05 cm3/g (where mesoporous volume represents nearly 10% of the microporous volume).
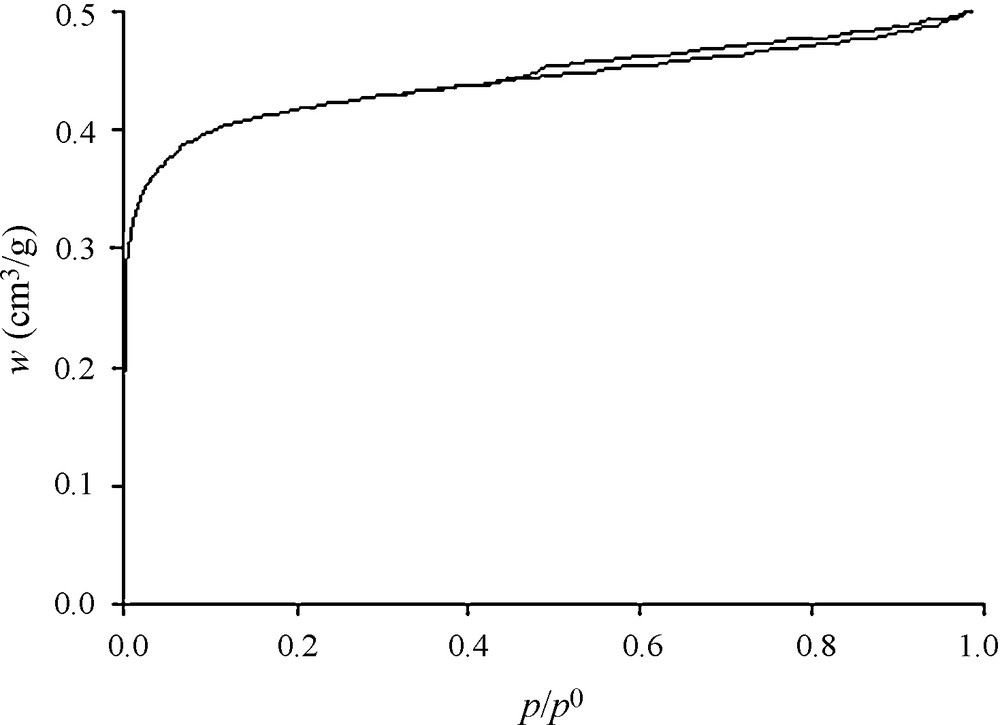
Nitrogen adsorption isotherm at 77 K in the RB1 activated carbon.
The micropore size distribution was evaluated from the Horvath-Kawazoe method [14] and the mesopore size distribution was obtained from the Broekhoff-de Boer method [15]. As shown in Fig. 3, the micropore widths are centred at 0.60 nm while a very wide distribution of mesopore sizes was found as large as 30 nm. It is noteworthy in the context of the present work that the micropores dimensions of RB1 activated carbon are closer to those of toluene molecule (0.8 × 0.62 × 0.39 nm) [16].
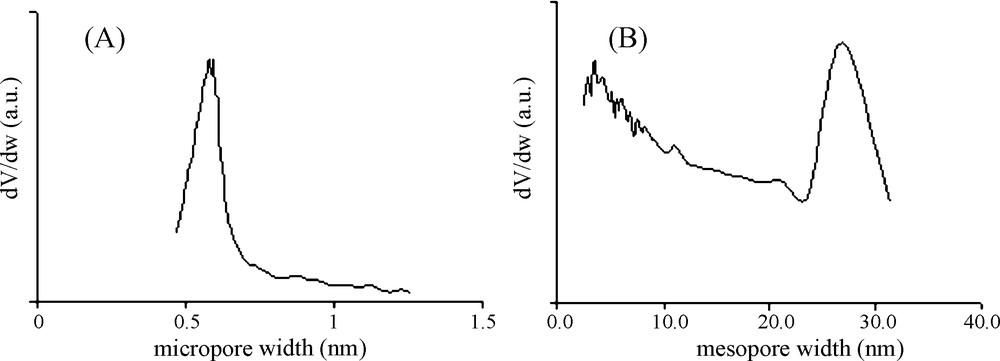
Micropore size distribution, from the Horváth-Kawazoe method (A) and mesopore size distribution, by the BdB-FHH method (B), obtained from the nitrogen adsorption data at 77 K for the RB1 activated carbon.
3.2 Adsorbed-desorbed amounts by flow measurements
The monitoring of toluene IR bands during adsorption at 298 K shows gradual increase of IR bands until equilibrium was reached, which corresponds to adsorbent saturation (Fig. 4 part A). Following this step, the gas mixture was switched to pure nitrogen flow to carry out isothermal desorption. The latter yields to a gradual decrease of IR bands with time as observed in part B of Fig. 4. The sample was, then, linearly heated under N2 flow up to 650 K to carry out the TPD experiment (part C of Fig. 4). It is to be noted that the recorded FTIR spectra do not reveal any formation of new species that might be originated from toluene transformation as result of adsorbent catalytic activity. This information, provided by the use of FTIR analysis technique, can be considered as an additional advantage of the experimental approach [12].
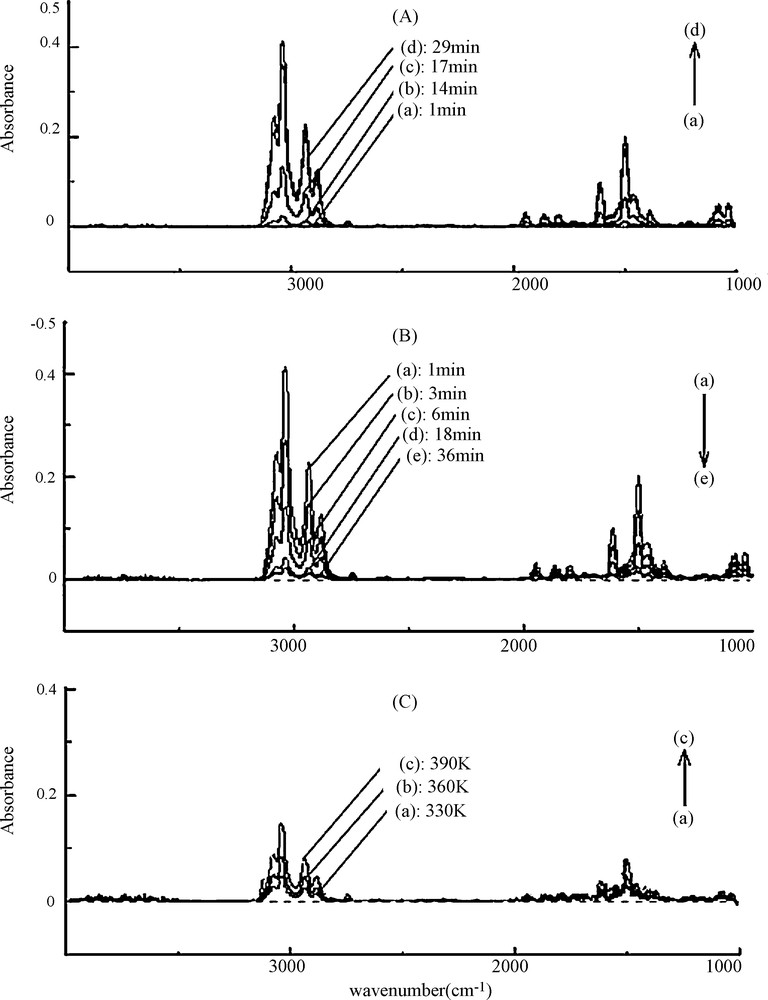
Evolution of toluene infra red (IR) bands during the following successive experiments: (A) isothermal adsorption at 300 K, (B) isothermal desorption and (C) temperature programmed desorption (TPD) under N2 at linear heating rate of 5 K/min.
The evolution of toluene concentration at the reactor outlet (Cout) obtained from FTIR spectra, permitted the monitoring of adsorbent loading as function of time during adsorption (i.e. breakthrough curve) and desorption. Fig. 5 shows the profile of the variation of toluene concentration in the gas flow at reactor outlet, represented as relative values (Cout/Cin), during the aforementioned cycle (adsorption at 298 K until saturation, followed by isothermal desorption then TPD).
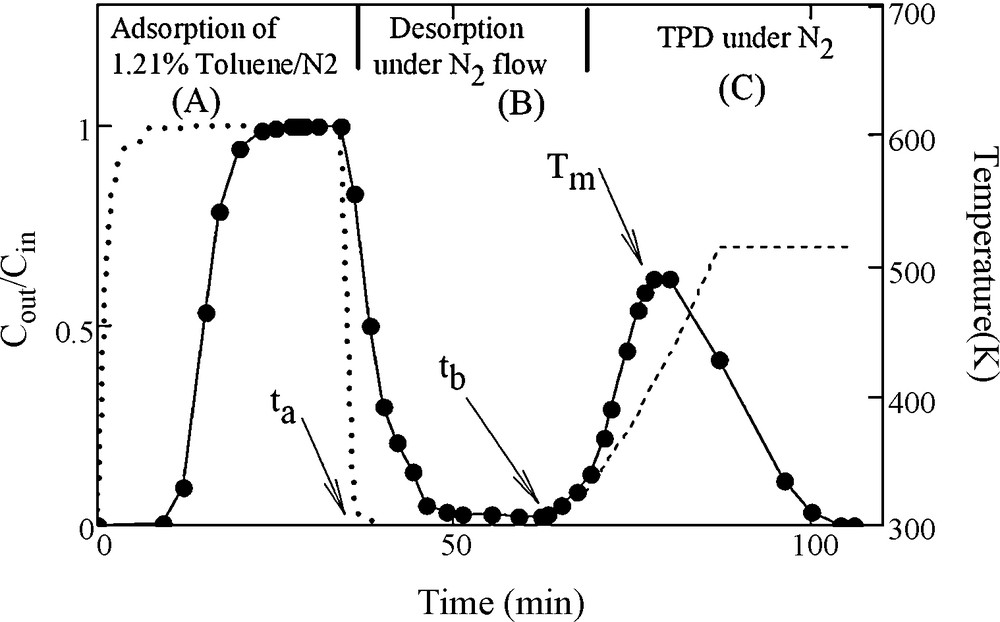
Profile of the variation of toluene concentration in the gas flow at reactor outlet, represented as relative values (Cout/Cin), during the aforementioned cycle of successive steps; adsorption using a mixture of 1.21% toluene in N2 at 300 K until saturation followed by isothermal desorption then temperature programmed desorption carried out with a linear heating rate of 5 K/min (……, without adsorbent;– – –, heating profile during temperature programmed desorption [TPD] experiment).
In the present work the RB1 pellets were contained in a quartz microreactor (type U with an internal volume ≈ 1 cm3) at atmospheric pressure (760 Torr) using a total flow rate of 100 cm3/min yielding to a residence time less than 1 s. Under these conditions, the experiments could be considered as occurring under negligible pressure drop with almost no variation in fluid velocity between the reactor inlet and outlet [17]. The application of the mass balance method yields to equation (1) allowing determination of the adsorbed mole number, by considering the curve corresponding to reactor response in the absence of solid.
| (1) |
The numerical integration of the isothermal desorption curve (part B of Fig. 5) using Eq. (2), permitted the determination of an amount of 0.78 10−3 moL/g corresponding to the loosely adsorbed fraction (n1ads) released during isothermal desorption.
| (2) |
In Eq. (2), ta and tb correspond to starting and ending time of isothermal desorption. It is to be noted that although the toluene desorption curve reached zero, the desorbed n1ads fraction represents only about 25% of the total adsorbed amount. The remaining adsorbed toluene is more strongly retained by the adsorbent. The complete removal of this amount was achieved using TPD method under N2 flow by heating in such a controlled way that the adsorbent temperature varies linearly with time. The integration of the corresponding curve, shown in part C of Fig. 5 using Eq. (3), permits obtaining n2ads value of 2.38 × 10⁻³moL/g (where tb and tc correspond to the starting and the ending of TPD curve).
| (3) |
Therefore, the data corresponding to the total adsorbed amount (nads) were found to fit the mass balance equation (nads ≈ n1ads + n2ads) with a precision around 2%, which gives an indication of the accuracy of the used analytical methodology. It is to be noted that the nads values do not suffer major changes during multiple successive cycles of adsorption desorption experiments carried out with the same RB1 samples and the precision remains at worst around 5%. This methodology was applied to the measurement of adsorbed and desorbed amounts at 300 K using different toluene pressures in the flow as summarized in the Table 2.
Adsorbed and desorbed amounts (in mmoL/g) measured at 298 K for multiple successive adsorption desorption cycles using different toluene pressures in the flow (in torr).
| Cycle number | P = 7.19 | P = 9.24 | P = 12.47 | ||||||
| nads | N1ads | n2ads | nads | N1ads | n2ads | nads | n1ads | n2ads | |
| 1st | 2.99 | 0.68 | 2.27 | 3.22 | 0.78 | 2.38 | 3.45 | 0.91 | 2.51 |
| 2nd | 2.95 | 0.70 | 2.21 | 3.18 | 0.74 | 2.35 | 3.45 | 0.84 | 2.48 |
| 3rd | 3.01 | 0.68 | 2.25 | 3.21 | 0.76 | 2.34 | 3.42 | 0.85 | 2.50 |
| 4th | 2.99 | 0.61 | 2.21 | 3.18 | 0.75 | 2.41 | 3.44 | 0.88 | 2.48 |
3.3 Amounts adsorbed by gravimetric (static) measurements
The amounts of toluene adsorbed under static conditions at two different temperatures are given in Fig. 6. Both isotherms are of type I according to the IUPAC classification [4], indicating that toluene is mainly adsorbed in micropores. The limiting amount of adsorbed toluene (from the plateau) is 3.97 × 10⁻³ moL/g which corresponds to a value of 0.42 cm3/g when converted to liquid volume, by considering the toluene density. This value is of similar magnitude of microporous volume (0.46 cm3/g) obtained from the nitrogen adsorption at 77 K. This finding strongly suggests that the adsorption of toluene, as measured by the adsorption isotherms, occurs essentially in the micropores of RB1 sample.

Toluene adsorption isotherms at the indicated temperatures on RB1 active carbon.
3.4 Determination of the isosteric heat of adsorption
The isotherm data (Fig. 6) corresponding to adsorbed amounts under equilibrium at 300 and 353 K for different toluene pressures, were used to estimate the isosteric heat (qst) of adsorption according to Clausius-Clapeyron equation [4–13],
| (4) |
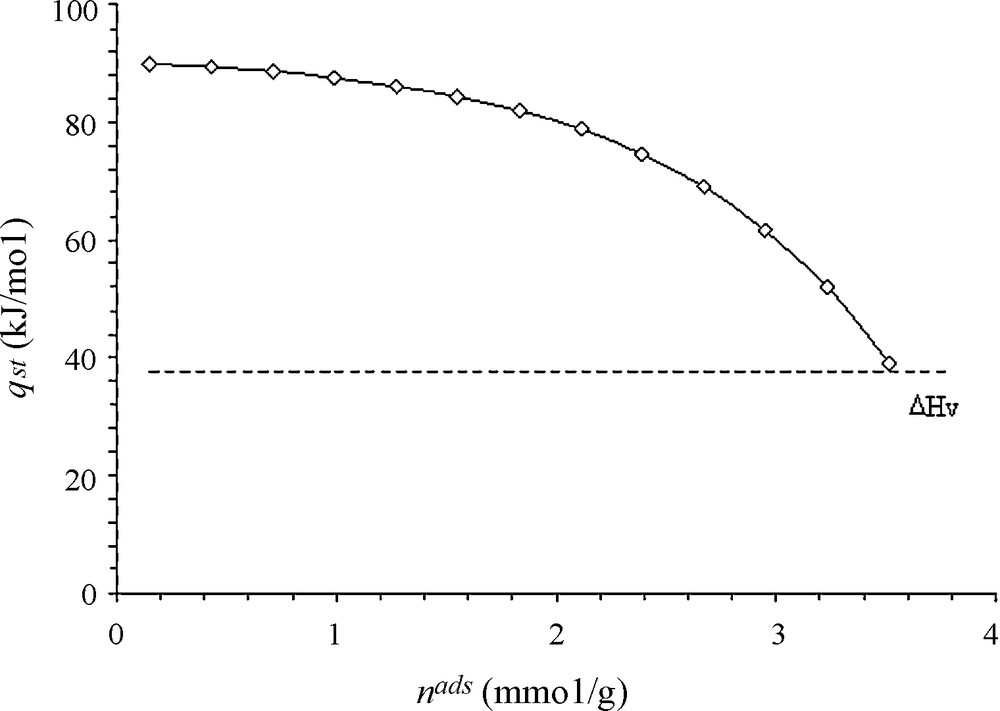
Isosteric heats of adsorption of toluene, in the range 298–318 K. ΔHv stands for the heat of vaporization.
3.5 Determination of the heat effect values with temperature programmed desorption (TPD) method
In the following section, the part C of the cycle (Fig. 5), corresponding to TPD experiment carried out after adsorbent saturation followed by isothermal desorption, will be used for the determination of the activation energy of desorption. The TPD method proposed by Cvetanovic and Amenomiya [9] was used by several authors [20–24], including for the particular case of microporous activated carbon [25–27].
The application of this method for the estimation of the binding energy between the adsorbate and adsorbent is justified by the need for values of the heat involved during the adsorption and desorption processes measured under experimental conditions similar to those used in practice. These data might be, also, of interest from the viewpoint of adsorbent regeneration and could help understanding, not only, the adsorption process but also the thermal desorption behavior. The TPD method consists on following the shift of temperature at desorption peak maximum (Tm) as a function of linear heating rates (β). Thus, apparent energy of desorption Ed value is extracted the slope of the line obtained from the plot of Cvetanovic and Amenomiya equation:
| (5) |
Therefore, in order to provide reliable data on desorption energy, the TPD curves have to be well defined, with clearly detectable Tm positions. This was the case of our experiment as shown in part C of Fig. 5. Additional sets of adsorption desorption cycles using a pressure of 7.19 torr for adsorption at 298 K, were carried out but with the TPD step (part C of the cycle) performed using different linear heating rate β (curves not shown). The resulting Tm positions are given in Table 3 and the slope of the plot representing 2lnTm–ln β as function of 1/Tm shown in Fig. 8 permits obtaining a value of Ed of 46.3 kJ/moL. Similar experiments were carried out with adsorption of toluene pressures of 9.23 and 12.47 torr and yielded respectively to Ed values of 51.8 and 56.3 kJ/moL as summarized in Table 4. The small increase of Ed values with the adsorbate pressure in the flow could be explained by the fact that for adsorption experiments carried out using flows with higher pressure of toluene, more molecules will be reaching narrowest porosity that will obviously require higher energy of desorption for their removal, as reported also in the literature [28].
Linear heating rate β used for temperature programmed desorption (TPD) experiments and the corresponding temperature at peak maximum Tm (P = 7.19 torr).
| B (K/min) | 5 | 7 | 10 | 12 | 15 |
| Tm (K) | 387 | 394 | 402 | 409 | 414 |
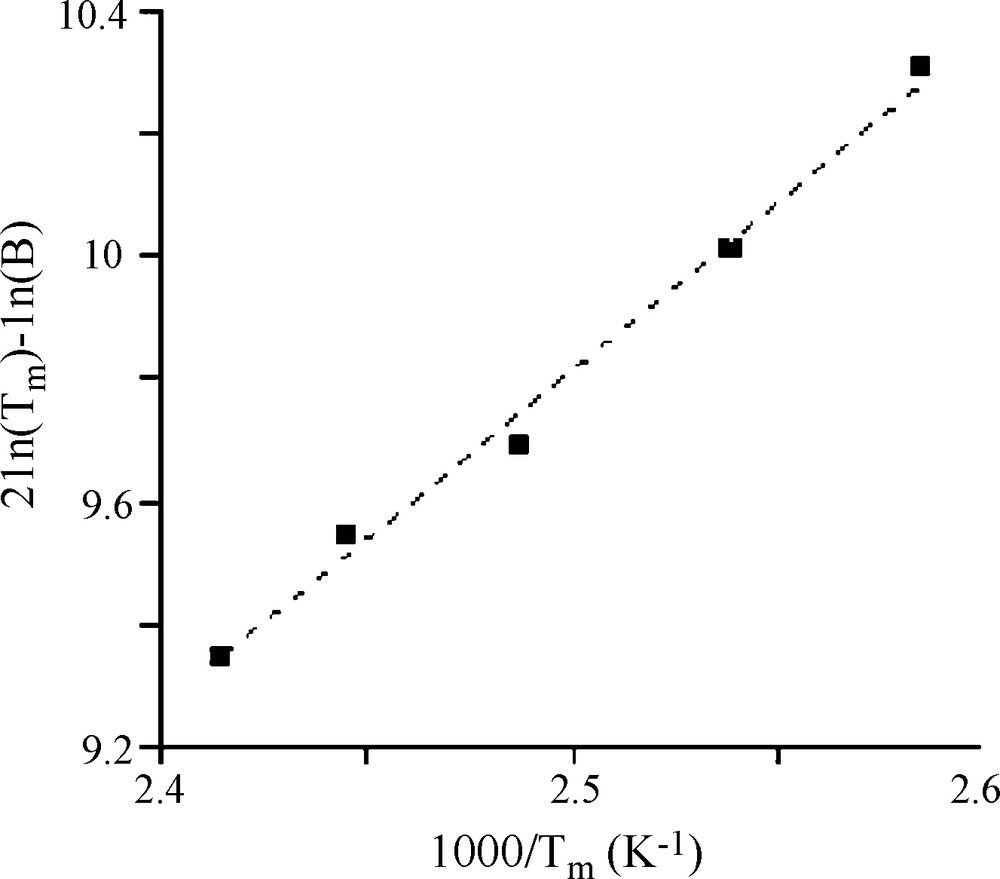
Cvetanovic curve obtained with temperature programmed desorption (TPD) experiments performed with β and Tm values presented in Table 1 for adsorption at 300 K using N2 flow containing 0.95% of toluene (P = 7.19 torr).
Adsorbed and desorbed amounts in mmoL/g at 298 K for different toluene pressures (torr) and the apparent energy of desorption (Ed) as well as the isosteric heat of adsorption for similar adsorbed amount (qst) in kJ/moL.
| P | nads | n1ads | n2ads | Ed (qst) |
| 7.19 | 2.99 | 0.68 | 2.27 | 46.3 (62) |
| 9.24 | 3.22 | 0.78 | 2.38 | 51.8 (46) |
| 12.47 | 3.45 | 0.91 | 2.51 | 56.3 (38) |
3.6 Comparison of the isosteric and temperature programmed desorption (TPD) methods
In the present work, the adsorbent RB1 used in pellets, the favoured shape for various technological applications, is mainly microporous but contains larger pores including those resulting from extrusion processes. These larger pores (cf. the pore size distribution presented in Fig. 3) present a lower adsorption potential for small molecules such as toluene. It is expected that adsorption in these pores yields to lower heats of adsorption related with the weakly adsorbed fraction (n1ads), whereas, the microporosity prevailing in the studied RB1 sample is associated with the stronger adsorbed fraction (n2ads) trapped in deeper and narrower pores (e.g. less accessible porosity).
In the present work, isosteric and TPD methods were selected because they are often used for the characterization of the strength of adsorbate–adsorbent interaction [2]. The obtained values of the heat effects involved remain within the magnitude of those usually reported for physical adsorption processes [18]. In the case of isosteric method, the observed decease of the heats values with sorbate loadings is usually attributed to the combined effect of sorbate–sorbent and sorbate–sorbate interactions [7]. However, in case of porous material, this decrease is associated with the progressive filling, starting from the narrowest micropores [13]. This behavior is, generally, explained by the energetic heterogeneity of an adsorbent surface, particularly, in case of a sharp decrease observed at very low coverage [17]. However, Ostrovskii [5] reported that the molar heat of physical adsorption decreases, also, with the surface coverage even at energetically homogeneous surfaces. This was explained, in case of multilayers formation, by the differences in the values of differential molar heats of adsorption for different physisorbed states onto different layers, within the micropores. Thus, the TPD profile shown in the part C of the cycle (Fig. 5) exhibits a single desorption peak suggesting the presence of a single energetic type of adsorption site, presumably, associated with toluene adsorption in the microporosity prevailing in the studied material. Note that the weakly adsorbed fraction of toluene on larger pores has been removed during isothermal desorption (part B of Fig. 5). These larger pores (cf. the pore size distribution presented in Fig. 3) present lower adsorption potential for small molecules such as toluene. The adsorption in these pores is responsible for lower heats of adsorption associated with the weakly adsorbed fraction (n1ads) representing about 24% of the total adsorbed amount. Nevertheless, this heat is needed to complete energy balances during adsorption and desorption cycles. The fact that this fraction has not been considered for TPD experiment could contribute to the differences observed in the heat values obtained by the two methods as shown in Table 4. Furthermore, the values of the heat effects obtained might be enhanced due to “confinement effect” in the pores depending on experimental conditions, particularly in case of physisorbed molecules with size similar to the predisposed pores [20]. In such a case, the influence of molecular diffusion through the pores has to be taken into account not only during adsorption but also during desorption [29]. Thus, it is obvious that the application of Cvetanovic and Amenomiya formula for the measurement of the desorption temperature following a simplified approach, does not directly reflect the desorption energy. Therefore, the obtained values cannot be systematically correlated with those of the heat of adsorption, which is a thermodynamic parameter relevant to the adsorption equilibrium. Although, the activation energy of desorption is equal to the heat of adsorption for non-activated adsorption (physisorption).
This issue requires careful quantification of the impact of molecules diffusion in micropores with respect to the contribution of different physical processes (heat and mass transfers), which is beyond the scope of the present work.
4 Conclusion
The present study aims at showing through the investigation of toluene vapour adsorption on a microporous activated carbon that different values of the heat effects are obtained with isosteric and TPD methods using adsorption experiments carried out, respectively, under static and dynamic conditions. The obtained values indicate that the involved adsorption process is non-activated (physisorption), that is, the activation energy of desorption is equal to the heat of adsorption. However, the application of Cvetanovic and Amenomiya equation yields to apparent energy of desorption values that cannot be correlated with those given by the isosteric method. The latter yields heat values determined using adsorption equilibrium data obtained under static conditions that are significantly different from those of the apparent energy of desorption given by TPD experiments carried out under dynamic conditions. Hence, the application of Cvetanovic and Amenomiya equation requires careful quantification of the contribution of heat and mass transfers processes due to molecules diffusion in the predisposed porosity.
Acknowledgments
The authors acknowledge the GRICES (Portugal) and CNRST (Morocco) for the financial support of the project (Chimie/06/2008/2009) and FCT for the Projecto Estratégico Pest OE/QUI/UI0612/2011 (CQB/FC/UL).