

1 Introduction
Due to its numerous properties, titanium dioxide is a very promising material. It is already used in paintings, implants, sunscreens or toothpastes but it is the photocatalytic water splitting reported by Fujishima and Honda in 1972 that has revealed the full potential of this material [1]. Since the 1990s, nanomaterials have shown that additional or enhanced properties could emerge when this scale range is reached. The dye-sensitized colloidal TiO2 solar cells designed by Oregan and Grätzel [2] have demonstrated that nanostructured titania could lead to such high-efficient devices. Many different geometries of nanosized TiO2 have thus been investigated during the recent years (see Ref. [3] for an extended review). Among the various morphologies, one-dimensional nanosystems are very promising [4]. In this field, electrochemically grown nanoporous semiconductors have opened the way and porous oxides such as Al2O3 membranes or TiO2 nanotubes (TiO2-nt) are now intensively investigated [5–7].
TiO2-nt have been used in many application fields such as photocatalysis [8], biomedicine [9], energy production and storage [10], microbatteries [11], dye-sensitized solar cells [12].
The nanotubular architecture of TiO2-nt is highly attractive because it obviously increases the active area with a large surface-to-volume ratio but it can also enhance the light absorption efficiency since the tube wall thickness can be tailored to correspond to the penetration depth of the incident radiation. The geometry of the TiO2-nt is indeed strongly influenced by the oxidation parameters such as the applied voltage (U), the F– concentration, the pH, and the nature of the solvent [7].
Cuprous oxide is a p-type semiconductor that exhibits interesting properties for visible light absorption. Since the band structures of Cu2O and TiO2 are favorably positioned, p/n heterojunctions have been successfully used as photocatalysts [13–15]. Attempts to fabricate photovoltaic cells based on Cu2O/TiO2-nt have also been recently reported [16–18]. In all cases cuprous oxide is deposited onto the titania nanotubes by electrochemical reduction in the electrolyte proposed earlier [19]. Further investigations of the deposition process has been proposed later [20]. Other materials have also been cathodically deposited onto TiO2-nt. Schmuki et al. have successfully performed the electrochemical filling of the nanotubes by metallic Cu after self-doping treatment carried out in NH4Cl [21] and Djenizian et al. have grown tin nanowires to improve the capacity of Li-ion batteries [11]. The wide variety of results found in literature shows the difficulty to achieve a highly conformal Cu2O deposition within the titania tubes.
In the present study, the anodization method to grow the TiO2-nt was similar to a previous study [22,23]. The influence of the polarization voltage and duration on the morphology of the nanotubes is firstly examined. The effect of thermal post-treatments on the crystalline structure of the tubes is then reported. The fabrication of the p/n heterojunctions by electrodeposition of Cu2O is emphasized in the second part. The electrochemical behavior of the TiO2-nt in the copper-containing electrolyte is investigated by cyclic voltammetry. The effect of the pH and the polarization method on the Cu2O deposit is investigated by scanning electron microscopy (SEM). Energy-dispersive X-ray spectroscopy (EDS) and X-ray diffraction (XRD) are used to identify the chemical composition of the deposits and to determine their crystalline structure.
2 Experimental
Titania nanotubes were anodically grown from 125 μm thick Ti foils (Advent, UK, 99.6% purity). Ti samples were cleaned successively in sonicating acetone, isopropanol and methanol baths during 5 min., rinsed in deionized water and dried under a nitrogen stream. The electrochemical anodizations were performed in 1 M H3PO4 + 1 M NaOH + 0.5% HF (pH ≈ 2) using a standard three-electrode setup with a Pt mesh as counter electrode and a mercury sulfate electrode (MSE, Hg/Hg2SO4, E° = 0.64 V vs. NHE) as reference. All potentials cited after are referred to this reference electrode. Before all the experiments, the open circuit potential (ocp) was measured waiting its stabilization. The voltage (between 5 and 60 V) was applied using a Modulab potentiostat/galvanostat (Solartron Analytical).
Cuprous oxide films were grown onto TiO2 nanotubes by electrochemical deposition using the same setup. The electrolyte was prepared according to Golden et al. [19]: 0.3 M CuSO4 + 3 M lactic acid and 5 M NaOH. The pH of the solution is adjusted by addition of NaOH. The temperature of the electrodeposition was set to 50 °C. The Cu2+ reduction to Cu+ was either performed by applying a continuous cathodic potential step or a pulsed voltage.
The morphology of both TiO2 nanotubes and Cu2O deposits was characterized by field-emission SEM using a JEOL 6320 F. The local chemical analysis was carried out in the SEM using a Brüker analyzer equipped with a Quantax acquisition system and a Si-Li diode detector exhibiting a resolution of 146 eV. The crystalline structure was studied by powder diffraction measurements using an INEL diffractometer equipped with a quartz monochromator and a 120° curved position sensitive detector (CPS-120), disposed horizontally. The measurements were obtained in reflection mode, the sample being positioned vertically on a goniometric head which is fixed on a rotating plate (Ω rotation). The radiation length corresponds to Cu Kα1 (1,54056 Å).
3 Results and discussion
3.1 Formation of the TiO2-nt
The TiO2-nt are produced potentiostatically in an acidic F– containing electrolyte. The formation of the nanotubes occurs through a competition between the anodic growth of the TiO2 massive film and its localized chemical dissolution due to the presence of fluoride ions [7,24]. The pitting corrosion and thus the pore nucleation originates from the second reaction. These two processes can be described schematically by the following simplified equations:
| (1) |
| (2) |
The morphology of the nanotube array can be controlled by adjusting the anodization parameters such as the applied voltage, the polarization time, the pH and fluoride concentration [25]. The pore diameter (Dnt) indeed increases linearly with the applied voltage.
Fig. 1 shows the variation of the anodic current with the concentration of F– ranging from 0 to 0.5%. Although the general aspect of the curves looks similar, i.e., an initial steep decrease followed by a current plateau around 2 mA cm–2, the enlarged view of the first minutes reveals that the current clearly depends on the fluoride concentration. The higher the F– concentration, the higher the current density. When the solution does not contain fluoride ions, a dense oxide film is formed while porous features are observed for 0.05% HF. Note that for a F– content higher than 1% no porous layer is observed. The TiO2 is dissolved for such high HF concentration. The evolution of the current observed for 0.25% HF shows the typical steps (noted R1, R2 and R3 on Fig. 1) of the TiO2-nt nucleation and growth described earlier [26]. R1 corresponds to the uniform TiO2 film formation. Pitting of the oxide film occurs in R2 and tube elongation takes place in R3.

Evolution of the current transient of Ti with the F− concentration (U = 20 V). The insert shows a magnified view of the initial time of the polarization. R1, R2 and R3 are referred in the text.
Fig. 2a shows the evolution of the tube length (lnt) with time. As expected lnt increases with t and reaches progressively a maximum value. In acidic solution, lnt is limited because the dissolution rate of the oxide at the tube mouth becomes equal to the porous etching rate. It has been shown that very long tubes can be achieved in neutral and viscous electrolytes because such chemical dissolution process is hampered (see e.g. Ref. [27]). The diameter of the tubes is plotted on Fig. 2b against the polarization time. As expected the Dnt increases quickly and reaches a plateau since each pore growth is limited by the surrounding tubes. The maximum diameter is almost attained within 60 min. To determine the influence of the applied voltage on Dnt, one has to consider this saturation delay to measure the diameter. The evolution of the tube diameter with the applied voltage is plotted on Fig. 2c. As expected, Dnt increases almost linearly with U. Up to 30 V, the experimental data fit relatively well with the empirical law (Dnt = 2.5 nm × U). For the highest voltage (U = 50 V), there is a strong discrepancy because at this voltage, the morphology of the tube mouth is strongly modified (Supporting information).

Size of TiO2-nt grown in 1 M H3PO4 + 1 M NaOH + 0.5% HF at 20 V. a: length of the nanotubes vs. time; b: diameter of the nanotubes vs. time; c: diameter of the tubes vs. applied voltage.
The anodization conditions have thus been selected according to the influence of the parameters described before and a specific nanotube morphology has been chosen for the following part of the work. Fig. 3 shows a SEM view the typical morphology of TiO2-nt grown in 1 M H3PO4 + 1 M NaOH + 0.5% HF at 20 V for 2 h. The nanotubes are relatively uniform and the average diameter is approximately 70 nm. The insert presents a cross section of the anodic film. As expected in an aqueous electrolyte, the nanotube walls have a wavy aspect due to the high surface tension during the growth. This increases the effective area of the porous structure.

SEM top view image of TiO2-nt grown in 1 M H3PO4 + 1 M NaOH + 0.5% HF at 20 V for 2 h. The insert shows the cross section of the deposit and the Ti substrate.
Several post-treatments can be carried out to improve the nanotubes. According to literature, the tetragonal phase anatase exhibits numerous interesting properties such as a good charge dissociation and transport [28]. Fig. 4 shows the effect of annealing in air on the crystalline structure of the porous film. The as-formed TiO2-nt are amorphous because, except the peaks attributed to the Ti substrate (noted T on Fig. 4), no diffraction peaks are visible on the diagram (a). When the samples are annealed for 2 h at 450 °C, additional peaks appear on the diffractogram (b). Those peaks (noted A) are ascribed to the anatase phase. If the temperature of the treatment is further increased (T = 750 °C), peaks (noted R) corresponding to the rutile phase are measured (c). In opposition to annealing carried out at 450 °C, the morphology of the TiO2-nt after heating at 750 °C is strongly modified. Under such annealing conditions, the nanotubular structure is lost, the tubes collapse and the main crystalline phase of TiO2 is rutile whereas the sample still exhibits a porous structure. XRD measurements have also been performed on the backside of the titanium substrate. Peaks corresponding to the TiO2 rutile phase are observed on the diffractogram. It indicates therefore that the sample is oxidized on both sides. Even the Ti substrate has been transformed to rutile phase.

X-ray difraction diagrams of TiO2-nt: a: as grown; b: annealed at 450 °C for 2 h; c: annealed at 750 °C for 2 h.
3.2 Cu2O electrodeposition on TiO2-nt
To build up the p/n junction, Cu2O has to be deposited onto the TiO2-nt. In the present study, it has been decided to use electrochemical deposition without any specific treatments such as self-doping or annealing proposed earlier by Schmuki et al. for Cu filling of titania nanotubes. Since TiO2 is a n-type semiconductor, the electrode/electrolyte junction is forward biased when cathodic voltages are applied and the Cu2+ reduction is possible. As proposed in a previously [19] lactic acid is used to achieve the reduction of Cu2+ to Cu+:
| (3) |
In order to have a stable solution, the electrochemical experiments were performed at 50 °C. The Cu2O electrochemical deposition onto TiO2-nt has firstly been investigated by cyclic voltammetry.
Fig. 5 shows two cyclic voltammograms of the TiO2 electrodes immersed in the plating electrolyte for two potential ranges. The ocp is around –0.15 V (see the black arrow on the figure). During the cyclic voltammetry, the potential was firstly swept into the cathodic direction and then to anodic overvoltages and finally stopped at the equilibrium potential.

Cyclic voltammograms of TiO2-nt in 0.3 M CuSO4 + 3 M CH3CH(OH)CO2H + 5 M NaOH (pH = 9). The insert shows an enlarged view of the low current region. The sweep rate is 20 mVs–1.
On both curves the onset for cathodic current is observed around –0.4 V. In order to attribute this reaction current, the voltammogram has stopped at –0.6 and –0.7 V (full and dashed lines, respectively). On the reverse scans, anodic peaks are clearly visible (AI and AII) when the cathodic limit was –0.7 V while it is almost invisible when the negative potential reached –0.6 V (A′ in the insert of Fig. 5). This indicates that the Cu2O deposition starts when the applied voltage is approximately –0.55 V (for less cathodic voltages A′ is not visible). This value is in agreement with the calculated redox potential of the Cu2+/Cu+ couple equal to –0.52 V vs. MSE [29]. AI and AII centered at –50 mV and 50 mV, respectively, are attributed to the oxidation of Cu2O to CuO and CuO to Cu2+. Similar anodic waves were observed in the same electrolyte on a gold electrode [30]. The anodic peak A′ corresponds to both oxidation processes. However, due to the small size of this anodic wave, it corresponds to the convolution of AI and AII. Note that it is unexpected to observe these peaks since TiO2 is a n-type semiconductor and thus it is reversed-bias when anodic voltages are applied. Anodic current can however proceed through defect that are numerous in such porous structure. On the cathodic branch of the voltammogram, no diffusion controlled current plateau is observed for further cathodic polarizations. This current increase could be ascribed to the water reduction. It is not the case because water reduction onto TiO2 occurs for much lower potentials. It was not possible to polarize the sample to highly negative values because the Cu2O is reduced to metallic Cu ( [29]). To explain this current evolution, a previous study carried out on indium tin oxide (ITO) has shown that Cu2O reduction does not proceed under mass transfer control [19]. Additionally, since Cu2O exhibits a p-type semiconductor behavior, the as-deposited Cu2O should self-limit further deposition. Kelly et al. [20] have, however, been able to propose a h+ assisted reduction mechanism to explain the Cu2O electrochemical formation onto fluorine-doped tin oxide (or FTO).
Fig. 6 shows the morphology of Cu2O deposits on TiO2-nt carried out under various conditions. Figs. 6a and b correspond to potentiostatic depositions performed at U = –0.8 V with a pH of 9 and 11, respectively. Fig. 6c shows a film obtained by pulsed voltage deposition at pH = 11. At pH = 9, using a continuous voltage, the Cu2O deposit exhibits globular features with an average diameter of 500 nm (Fig. 6a) while at pH = 11, under the same electrochemical conditions, the average diameter is around 200 nm and the particle density (Nd) increases from 1 × 10⁸ to 2.5 × 10⁸ particles/cm2. When the cathodic voltage is applied using short pulses, the deposit looks uniform and it is difficult to evaluate the particle diameter and density. These last deposition conditions appear to be optimal. However, it was not possible to verify unambiguously that cuprous oxide filled the titania nanotubes. When cross sections are performed on the whole sample, the nanotubes remain, indeed, unsegmented. According to previous studies [16–18], it seems that the cuprous oxide does not fill the tubes.
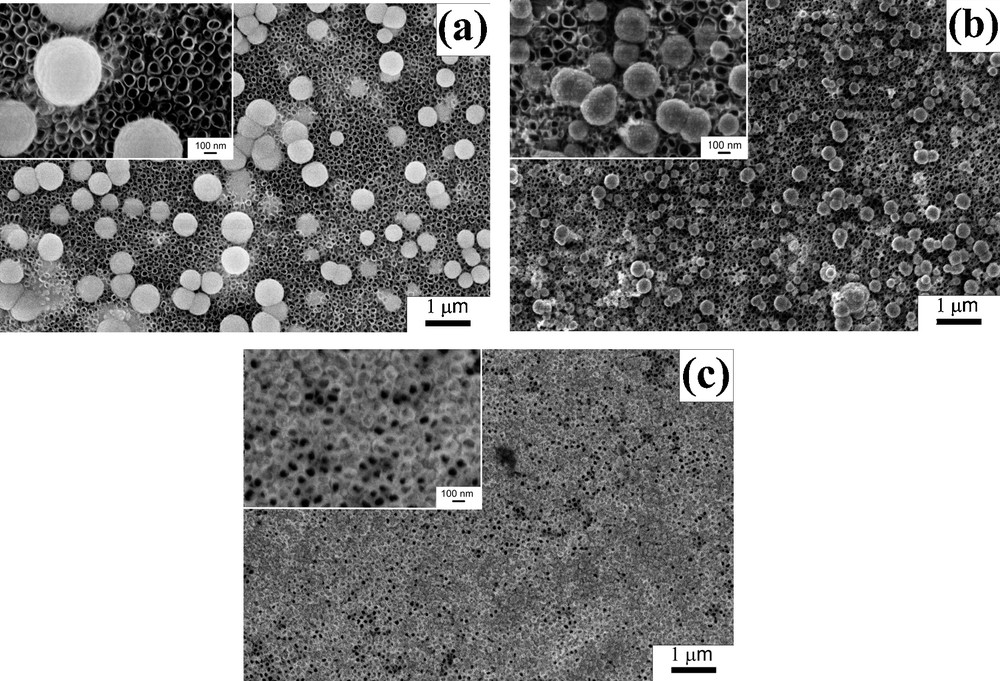
SEM images of Cu2O deposited onto TiO2-nt at pH = 9 (a) and at pH = 11 (b,c) applying a continuous (a,b) or a pulsed voltage (c). The potential step was –0.8 V for 300 s continuous mode and 1500 pulses of 0.25 s from OCP to –0.8 V with a relaxing time of 0.75 s were applied in pulsed mode.
In order to confirm the presence of copper within the deposited films, chemical analysis were performed in the SEM by EDS. The electron beam was then focussed on the large particles that are visible on Fig. 6a. The result is plotted on Fig. 7. It clearly indicates that Cu is present in the particles. As expected, Ti peaks are also observed because the penetration depth of the incident electron beam is higher than the thickness of the copper deposit. Obviously, this local chemical analysis cannot provide information about the oxidation state of the materials and thus the presence of Cu2O is not proven by this technique. Note that no oxygen peak appears because the intensity of Cu and Ti signals dominate largely.

Chemical composition of Cu2O/Cu electrodeposited on TiO2-nt analysed by EDS.
To confirm that cuprous oxide was deposited onto TiO2-nt and to determine the crystalline structure of the deposits, X-ray diffraction has been performed after the cathodic treatments. Fig. 8 shows the X-ray diffraction patterns of films deposited onto TiO2-nt surface at pH = 9 and 11. Both diagrams exhibit the diffraction peaks corresponding to the Ti substrate and Cu2O film (noted T and C, respectively on Fig. 8).
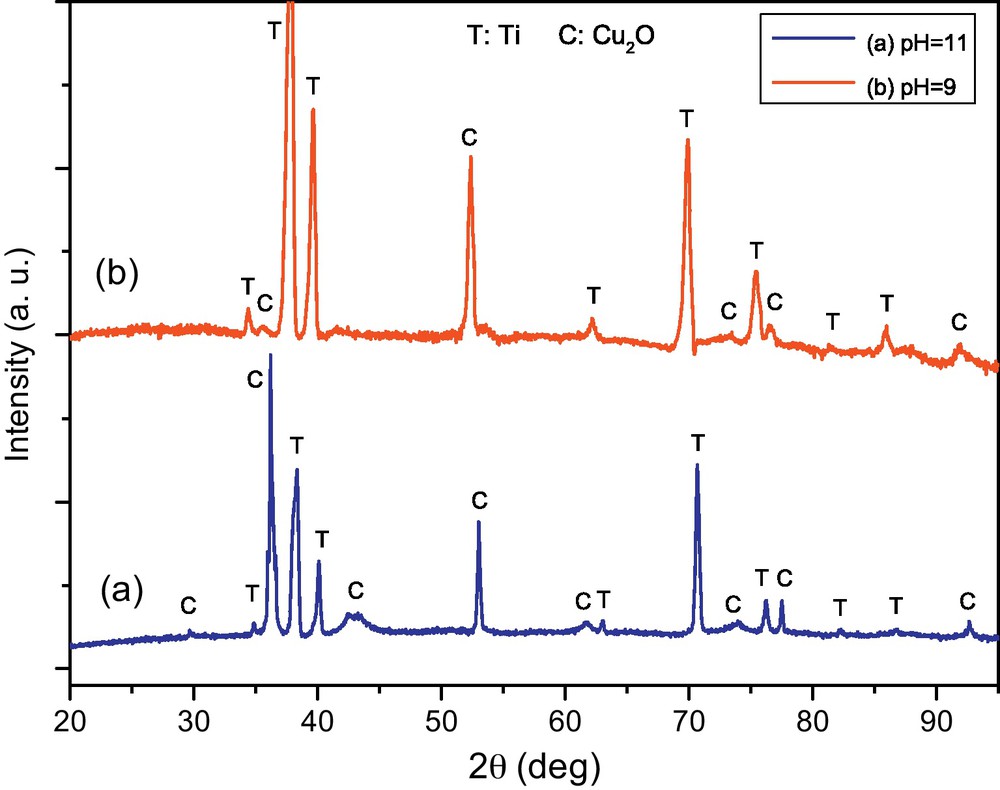
X-ray difraction diagrams of Cu2O electrodeposited on TiO2-nt varying the pH of the electrolyte: (a) pH = 11, pulsed voltage and (b) pH = 9, continuous voltage.
At pH = 11, it has been observed that varying the angle between the substrate and the incident X-ray beam, the intensity of the Cu2O signal changes considerably, with a strong intensity for the (111) reflection. This seems to indicate that the Cu2O grains are preferentially oriented with the (111) direction almost perpendicular to the substrate; further analysis should be done to confirm this. Note that no difference has been found between the films that have been grown under a continuous or a pulsed voltage. At pH = 9, the grains distribution is homogeneous and their number is lower than at pH = 11. Moreover, as it is shown on the diffraction pattern, the signal coming from the Cu2O is stronger, compared with the one coming from the substrate, at pH = 11 than at pH = 9. Thus, the coverage of TiO2-nt by the Cu2O seems more conformal and more homogeneous at pH = 11. Note that no peaks attributed to TiO2 appear on this diffraction pattern because the TiO2-nt have not been annealed and they are amorphous. Besides, it has been already shown that the temperature during the electrodeposition can contribute to the decreasing of the size of Cu2O grains. This is why here the experiments have been performed at 50 °C.
4 Conclusion
After the fabrication of TiO2-nt, Cu2O has been electrodeposited to fabricate p/n heterojunctions. The experimental parameters for the growth of TiO2-nt in aqueous electrolyte have been optimized to adjust their morphology and cristallinity after annealing post-treatment. The second step of this study was the electrodeposition of a Cu2O film. The best results are obtained at pH 11. The Cu2O particules deposited on TiO2-nt exhibit, indeed, a smaller average diameter but it was necessary to perform a pulsed deposition to get a homogeneous coverage of the tubes. It seems that the annealing of TiO2 nanotubes and their self-doping are requested pre-treatments to achieve a true filling of the pores. The next step of this sudy will be to carry out electrical measurements of charges dissociation potential of Cu2O/TiO2 p/n heterojunctions that have been fabricated.
Acknowledgments
The authors acknowledge Damien Chaudanson and Serge Nitsche for their precious help with the electron microscopy. This work is part of the CIMPACA II Programm that is supported by the European Regional Development Fund, the PACA Regional Council, the Bouches-du-Rhône council and the CNRS.